

Key Insights
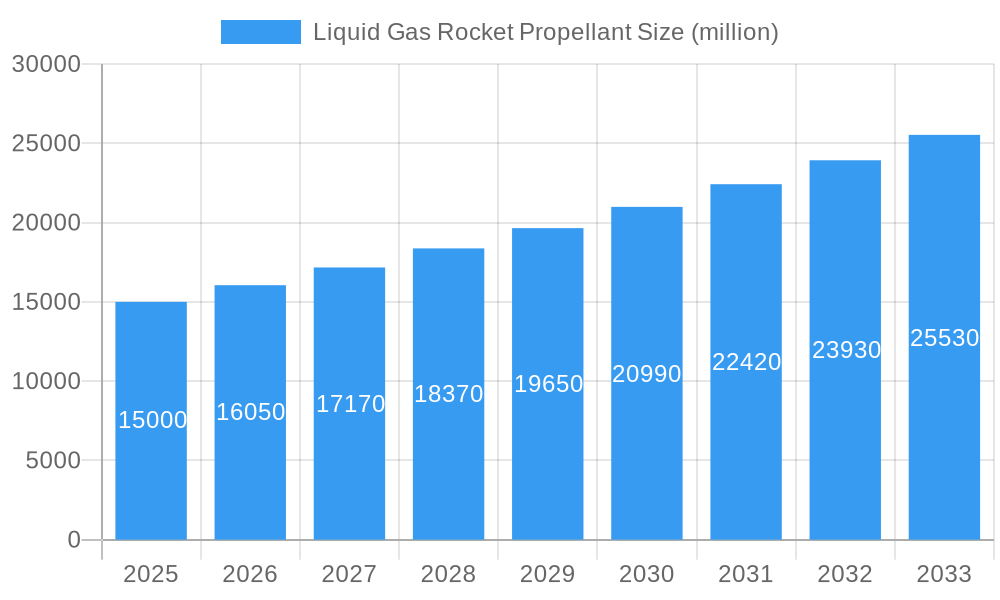
The liquid gas rocket propellant market is experiencing robust growth, driven by the increasing demand for space exploration and defense applications. The market, estimated at $15 billion in 2025, is projected to exhibit a Compound Annual Growth Rate (CAGR) of 7% from 2025 to 2033, reaching an estimated market value of approximately $28 billion by 2033. This growth is fueled by several key factors, including rising government investments in space programs globally (driven by both civil and military initiatives), the burgeoning commercial space industry with companies like SpaceX leading the charge, and the continuous advancement in rocket propulsion technology, leading to greater efficiency and payload capacity. Furthermore, the development of more environmentally friendly propellants is a significant trend, attracting further investment and innovation within the sector.
Liquid Gas Rocket Propellant Market Size (In Billion)
However, the market faces certain restraints. High manufacturing costs associated with specialized materials and stringent safety regulations pose challenges. The market's dependence on government funding and the inherent risks involved in space launches also present potential bottlenecks. Segmentation of the market reveals strong growth in cryogenic propellants (liquid oxygen, liquid hydrogen) due to their high performance, while solid propellants maintain a considerable share due to their simpler handling and storage. Major players like Air Products, Praxair (now part of Linde), Air Liquide, and SpaceX are actively shaping market dynamics through technological advancements, strategic partnerships, and geographic expansion. The competitive landscape is intensifying, leading to price competition and technological innovation to maintain market share. The regional distribution reflects a concentration in North America and Europe, driven by the presence of significant aerospace industries, but the Asia-Pacific region is expected to exhibit strong growth in the coming years.
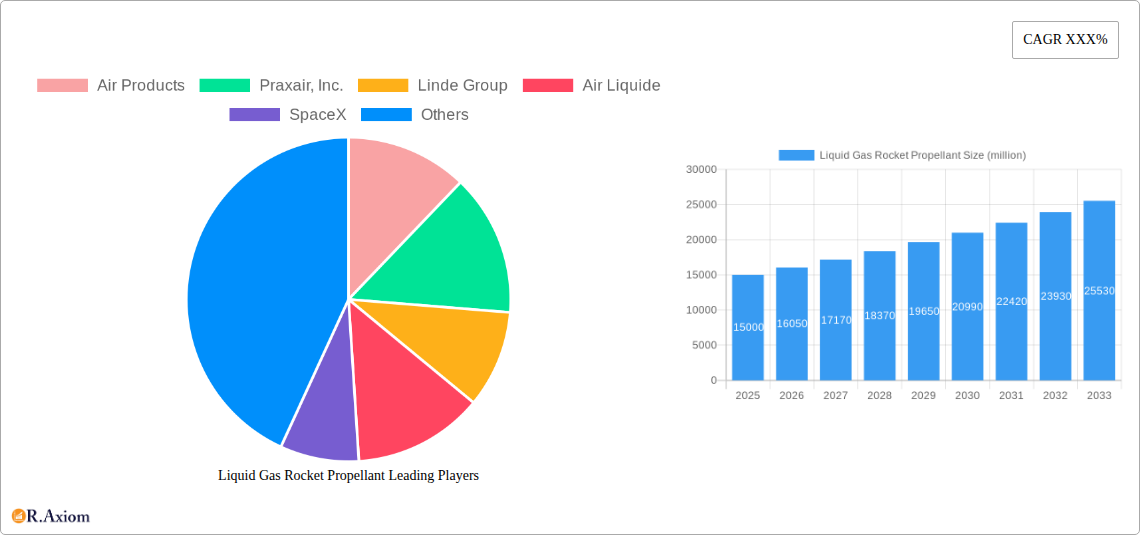
Liquid Gas Rocket Propellant Company Market Share
Liquid Gas Rocket Propellant Market: A Comprehensive Forecast & Analysis (2019-2033)
This in-depth report provides a comprehensive analysis of the global Liquid Gas Rocket Propellant market, offering valuable insights for industry stakeholders, investors, and researchers. The study covers the period from 2019 to 2033, with a focus on the forecast period of 2025-2033 and a base year of 2025. The report meticulously examines market dynamics, including growth drivers, challenges, emerging opportunities, and competitive landscape, providing actionable strategic recommendations for navigating this rapidly evolving sector. The market value is projected to reach xx million by 2033.
Liquid Gas Rocket Propellant Market Concentration & Innovation
The global liquid gas rocket propellant market exhibits a moderately concentrated structure, with key players such as Air Products, Praxair, Inc., Linde Group, and Air Liquide holding significant market share. The combined market share of these top four players is estimated at 60% in 2025. SpaceX and ISRO, major end-users, also exert considerable influence on market demand and innovation. Market concentration is influenced by high entry barriers, including significant capital investment requirements for manufacturing facilities and stringent regulatory compliance.
Innovation Drivers:
- Advancements in propellant formulation for increased performance and reduced environmental impact.
- Development of novel propulsion systems leveraging advanced liquid gas propellants.
- Focus on cost reduction through process optimization and economies of scale.
Regulatory Framework & Substitutes:
The industry operates under stringent safety and environmental regulations, impacting production costs and requiring significant investment in safety protocols. Limited viable substitutes exist, with the primary alternative being solid propellants, which often offer lower performance and increased environmental impact.
M&A Activities:
The past five years have witnessed significant M&A activity, with deal values exceeding $xx million. These mergers and acquisitions are primarily driven by companies seeking to expand their market share, diversify their product portfolio, and gain access to new technologies. For example, the merger of xx and xx in 2022 resulted in xx increase in market share.
Liquid Gas Rocket Propellant Industry Trends & Insights
The global liquid gas rocket propellant market is projected to witness robust growth during the forecast period (2025-2033), with a CAGR of xx%. This growth is primarily fueled by the increasing demand for space exploration, satellite launches, and military applications. The rising adoption of reusable rockets and the expanding commercial space industry are significant contributors. Technological disruptions, such as the development of greener propellants and advanced storage systems, are transforming the market landscape.
Consumer preferences are shifting towards higher-performance, environmentally friendly propellants. This trend is driving innovation in propellant formulations and manufacturing processes. The competitive dynamics are intense, with established players focusing on strategic partnerships, technology advancements, and expansion into new markets to maintain their competitive edge. Market penetration of liquid gas propellants in specific niche applications is expected to reach xx% by 2033.
Dominant Markets & Segments in Liquid Gas Rocket Propellant
The North American region is currently the dominant market for liquid gas rocket propellants, driven by strong government spending on space exploration and defense programs. The United States, in particular, holds a significant market share due to the presence of major players like SpaceX and a thriving commercial space sector.
Key Drivers for North American Dominance:
- High government funding for space programs and defense initiatives.
- Presence of major propellant manufacturers and space technology companies.
- Well-developed infrastructure supporting aerospace activities.
Europe and Asia-Pacific are also exhibiting significant growth potential. Europe benefits from a robust aerospace industry and strong government support for space research. The Asia-Pacific region's growth is fueled by increasing investment in space exploration programs in countries like India, China, and Japan. Detailed analysis in the full report reveals the specific market size and growth projections for each region.
Liquid Gas Rocket Propellant Product Developments
Recent product innovations have focused on developing high-performance propellants with improved specific impulse, increased density, and reduced toxicity. The development of cryogenic propellants and advanced oxidizers has enhanced the efficiency and performance of rocket engines. These advancements are driving the adoption of liquid gas propellants in various applications, from small satellite launches to large-scale space missions. The market is also witnessing growing adoption of more environmentally friendly propellants to meet stringent regulatory requirements and address growing environmental concerns.
Report Scope & Segmentation Analysis
This report segments the liquid gas rocket propellant market based on propellant type (e.g., kerosene, liquid hydrogen, liquid oxygen), application (e.g., space launch vehicles, satellites, missiles), and geography. Each segment's growth projections, market size, and competitive landscape are detailed within the full report. For instance, the liquid oxygen segment is projected to hold the largest market share due to its widespread use across various applications. The report also analyzes the competitive dynamics within each segment, highlighting key players and their market strategies.
Key Drivers of Liquid Gas Rocket Propellant Growth
The growth of the liquid gas rocket propellant market is propelled by several key factors: Firstly, the burgeoning space exploration industry is significantly driving demand. Secondly, the increasing number of satellite launches for commercial and government purposes fuels market expansion. Thirdly, technological advancements leading to improved propellant performance and efficiency further stimulate growth. Lastly, government support for space research and development, especially in key regions, is a critical catalyst.
Challenges in the Liquid Gas Rocket Propellant Sector
The liquid gas rocket propellant sector faces several challenges, including stringent safety regulations, the volatile nature of cryogenic propellants, and the need for specialized handling and storage facilities. Supply chain disruptions can significantly impact production and profitability, while intense competition from existing players and the emergence of new entrants pose ongoing challenges. The total cost of compliance with stringent safety regulations is estimated to be xx million annually, influencing the overall market dynamics.
Emerging Opportunities in Liquid Gas Rocket Propellant
Emerging opportunities lie in the development of next-generation propellants with superior performance and reduced environmental impact. The increasing focus on reusable launch vehicles presents a significant opportunity for the industry. Furthermore, the expansion of the commercial space sector and growing interest in space tourism are driving demand. The exploration of alternative propellants and propulsion systems also presents considerable potential for future market expansion.
Leading Players in the Liquid Gas Rocket Propellant Market
- Air Products
- Linde Group
- Air Liquide
- Praxair, Inc.
- SpaceX
- ISRO
- AMPAC Fine Chemicals
- CRS Chemicals
- Ultramet
- Eurenco
- Island Pyrochemical Industries
- AMPAC Fine Chemicals (SK)
- Safran Group
- JAXA
Key Developments in Liquid Gas Rocket Propellant Industry
- 2022, Q4: SpaceX successfully launched its Starship prototype, showcasing advancements in propellant utilization.
- 2023, Q1: Linde Group announced a significant investment in expanding its cryogenic propellant production capacity.
- 2024, Q2: A new joint venture between Air Products and a major aerospace company was formed to develop a next-generation green propellant. (Further detailed information on key industry developments is provided within the full report.)
Strategic Outlook for Liquid Gas Rocket Propellant Market
The liquid gas rocket propellant market is poised for continued growth, driven by increasing space exploration activities, technological advancements, and the expansion of the commercial space sector. Strategic opportunities exist for companies to focus on developing environmentally friendly propellants, improving propellant storage and handling technologies, and expanding their geographical presence. The future of the market hinges on continuous innovation, strategic partnerships, and adaptation to evolving regulatory frameworks. The potential for market expansion into emerging applications, such as in-space propulsion and advanced space tourism, should not be underestimated.
Liquid Gas Rocket Propellant Segmentation
-
1. Application
- 1.1. Commercial Use
- 1.2. Military Use
-
2. Type
- 2.1. Storable Propellants (Kerosene, Nitric Acid)
- 2.2. Cryogenic Propellants ( Liquid Hydrogen, Liquid Oxygen)
Liquid Gas Rocket Propellant Segmentation By Geography
-
1. North America
- 1.1. United States
- 1.2. Canada
- 1.3. Mexico
-
2. South America
- 2.1. Brazil
- 2.2. Argentina
- 2.3. Rest of South America
-
3. Europe
- 3.1. United Kingdom
- 3.2. Germany
- 3.3. France
- 3.4. Italy
- 3.5. Spain
- 3.6. Russia
- 3.7. Benelux
- 3.8. Nordics
- 3.9. Rest of Europe
-
4. Middle East & Africa
- 4.1. Turkey
- 4.2. Israel
- 4.3. GCC
- 4.4. North Africa
- 4.5. South Africa
- 4.6. Rest of Middle East & Africa
-
5. Asia Pacific
- 5.1. China
- 5.2. India
- 5.3. Japan
- 5.4. South Korea
- 5.5. ASEAN
- 5.6. Oceania
- 5.7. Rest of Asia Pacific
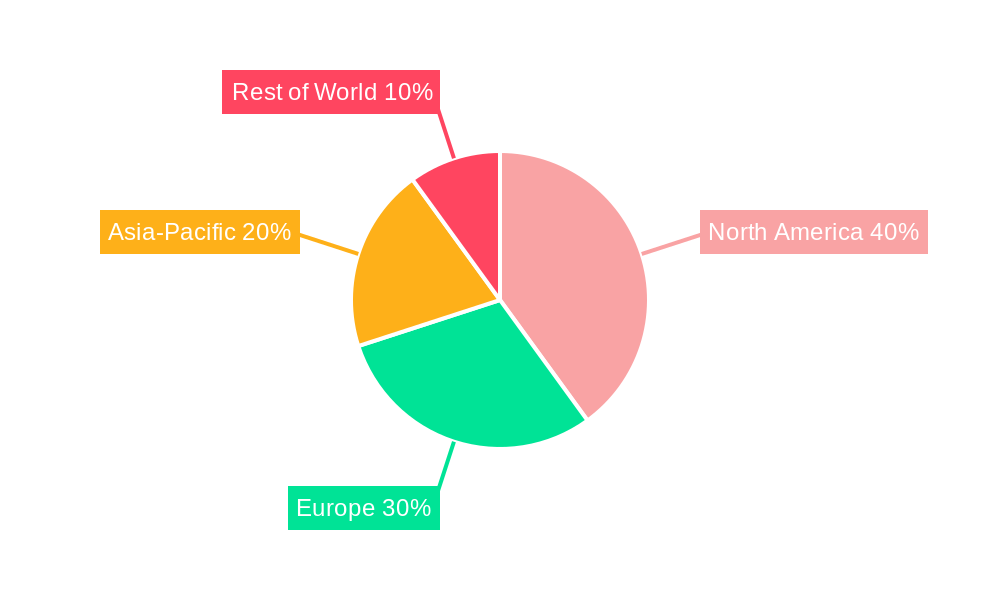
Liquid Gas Rocket Propellant Regional Market Share
Geographic Coverage of Liquid Gas Rocket Propellant
Liquid Gas Rocket Propellant REPORT HIGHLIGHTS
| Aspects | Details |
|---|---|
| Study Period | 2020-2034 |
| Base Year | 2025 |
| Estimated Year | 2026 |
| Forecast Period | 2026-2034 |
| Historical Period | 2020-2025 |
| Growth Rate | CAGR of 13.6% from 2020-2034 |
| Segmentation |
|
Table of Contents
- 1. Introduction
- 1.1. Research Scope
- 1.2. Market Segmentation
- 1.3. Research Objective
- 1.4. Definitions and Assumptions
- 2. Executive Summary
- 2.1. Market Snapshot
- 3. Market Dynamics
- 3.1. Market Drivers
- 3.2. Market Restrains
- 3.3. Market Trends
- 3.4. Market Opportunities
- 4. Market Factor Analysis
- 4.1. Porters Five Forces
- 4.1.1. Bargaining Power of Suppliers
- 4.1.2. Bargaining Power of Buyers
- 4.1.3. Threat of New Entrants
- 4.1.4. Threat of Substitutes
- 4.1.5. Competitive Rivalry
- 4.2. PESTEL analysis
- 4.3. BCG Analysis
- 4.3.1. Stars (High Growth, High Market Share)
- 4.3.2. Cash Cows (Low Growth, High Market Share)
- 4.3.3. Question Mark (High Growth, Low Market Share)
- 4.3.4. Dogs (Low Growth, Low Market Share)
- 4.4. Ansoff Matrix Analysis
- 4.5. Supply Chain Analysis
- 4.6. Regulatory Landscape
- 4.7. Current Market Potential and Opportunity Assessment (TAM–SAM–SOM Framework)
- 4.8. RAX Analyst Note
- 4.1. Porters Five Forces
- 5. Market Analysis, Insights and Forecast 2021-2033
- 5.1. Market Analysis, Insights and Forecast - by Application
- 5.1.1. Commercial Use
- 5.1.2. Military Use
- 5.2. Market Analysis, Insights and Forecast - by Type
- 5.2.1. Storable Propellants (Kerosene, Nitric Acid)
- 5.2.2. Cryogenic Propellants ( Liquid Hydrogen, Liquid Oxygen)
- 5.3. Market Analysis, Insights and Forecast - by Region
- 5.3.1. North America
- 5.3.2. South America
- 5.3.3. Europe
- 5.3.4. Middle East & Africa
- 5.3.5. Asia Pacific
- 5.1. Market Analysis, Insights and Forecast - by Application
- 6. Global Liquid Gas Rocket Propellant Analysis, Insights and Forecast, 2021-2033
- 6.1. Market Analysis, Insights and Forecast - by Application
- 6.1.1. Commercial Use
- 6.1.2. Military Use
- 6.2. Market Analysis, Insights and Forecast - by Type
- 6.2.1. Storable Propellants (Kerosene, Nitric Acid)
- 6.2.2. Cryogenic Propellants ( Liquid Hydrogen, Liquid Oxygen)
- 6.1. Market Analysis, Insights and Forecast - by Application
- 7. North America Liquid Gas Rocket Propellant Analysis, Insights and Forecast, 2020-2032
- 7.1. Market Analysis, Insights and Forecast - by Application
- 7.1.1. Commercial Use
- 7.1.2. Military Use
- 7.2. Market Analysis, Insights and Forecast - by Type
- 7.2.1. Storable Propellants (Kerosene, Nitric Acid)
- 7.2.2. Cryogenic Propellants ( Liquid Hydrogen, Liquid Oxygen)
- 7.1. Market Analysis, Insights and Forecast - by Application
- 8. South America Liquid Gas Rocket Propellant Analysis, Insights and Forecast, 2020-2032
- 8.1. Market Analysis, Insights and Forecast - by Application
- 8.1.1. Commercial Use
- 8.1.2. Military Use
- 8.2. Market Analysis, Insights and Forecast - by Type
- 8.2.1. Storable Propellants (Kerosene, Nitric Acid)
- 8.2.2. Cryogenic Propellants ( Liquid Hydrogen, Liquid Oxygen)
- 8.1. Market Analysis, Insights and Forecast - by Application
- 9. Europe Liquid Gas Rocket Propellant Analysis, Insights and Forecast, 2020-2032
- 9.1. Market Analysis, Insights and Forecast - by Application
- 9.1.1. Commercial Use
- 9.1.2. Military Use
- 9.2. Market Analysis, Insights and Forecast - by Type
- 9.2.1. Storable Propellants (Kerosene, Nitric Acid)
- 9.2.2. Cryogenic Propellants ( Liquid Hydrogen, Liquid Oxygen)
- 9.1. Market Analysis, Insights and Forecast - by Application
- 10. Middle East & Africa Liquid Gas Rocket Propellant Analysis, Insights and Forecast, 2020-2032
- 10.1. Market Analysis, Insights and Forecast - by Application
- 10.1.1. Commercial Use
- 10.1.2. Military Use
- 10.2. Market Analysis, Insights and Forecast - by Type
- 10.2.1. Storable Propellants (Kerosene, Nitric Acid)
- 10.2.2. Cryogenic Propellants ( Liquid Hydrogen, Liquid Oxygen)
- 10.1. Market Analysis, Insights and Forecast - by Application
- 11. Asia Pacific Liquid Gas Rocket Propellant Analysis, Insights and Forecast, 2020-2032
- 11.1. Market Analysis, Insights and Forecast - by Application
- 11.1.1. Commercial Use
- 11.1.2. Military Use
- 11.2. Market Analysis, Insights and Forecast - by Type
- 11.2.1. Storable Propellants (Kerosene, Nitric Acid)
- 11.2.2. Cryogenic Propellants ( Liquid Hydrogen, Liquid Oxygen)
- 11.1. Market Analysis, Insights and Forecast - by Application
- 12. Competitive Analysis
- 12.1. Company Profiles
- 12.1.1 Air Products
- 12.1.1.1. Company Overview
- 12.1.1.2. Products
- 12.1.1.3. Company Financials
- 12.1.1.4. SWOT Analysis
- 12.1.2 Praxair Inc.
- 12.1.2.1. Company Overview
- 12.1.2.2. Products
- 12.1.2.3. Company Financials
- 12.1.2.4. SWOT Analysis
- 12.1.3 Linde Group
- 12.1.3.1. Company Overview
- 12.1.3.2. Products
- 12.1.3.3. Company Financials
- 12.1.3.4. SWOT Analysis
- 12.1.4 Air Liquide
- 12.1.4.1. Company Overview
- 12.1.4.2. Products
- 12.1.4.3. Company Financials
- 12.1.4.4. SWOT Analysis
- 12.1.5 SpaceX
- 12.1.5.1. Company Overview
- 12.1.5.2. Products
- 12.1.5.3. Company Financials
- 12.1.5.4. SWOT Analysis
- 12.1.6 ISRO
- 12.1.6.1. Company Overview
- 12.1.6.2. Products
- 12.1.6.3. Company Financials
- 12.1.6.4. SWOT Analysis
- 12.1.7 AMPAC Fine Chemicals
- 12.1.7.1. Company Overview
- 12.1.7.2. Products
- 12.1.7.3. Company Financials
- 12.1.7.4. SWOT Analysis
- 12.1.8 CRS Chemicals
- 12.1.8.1. Company Overview
- 12.1.8.2. Products
- 12.1.8.3. Company Financials
- 12.1.8.4. SWOT Analysis
- 12.1.9 Ultramet
- 12.1.9.1. Company Overview
- 12.1.9.2. Products
- 12.1.9.3. Company Financials
- 12.1.9.4. SWOT Analysis
- 12.1.10 Eurenco
- 12.1.10.1. Company Overview
- 12.1.10.2. Products
- 12.1.10.3. Company Financials
- 12.1.10.4. SWOT Analysis
- 12.1.11 Island Pyrochemical Industries
- 12.1.11.1. Company Overview
- 12.1.11.2. Products
- 12.1.11.3. Company Financials
- 12.1.11.4. SWOT Analysis
- 12.1.12 AMPAC Fine Chemicals(SK)
- 12.1.12.1. Company Overview
- 12.1.12.2. Products
- 12.1.12.3. Company Financials
- 12.1.12.4. SWOT Analysis
- 12.1.13 Safran Group
- 12.1.13.1. Company Overview
- 12.1.13.2. Products
- 12.1.13.3. Company Financials
- 12.1.13.4. SWOT Analysis
- 12.1.14 JAXA
- 12.1.14.1. Company Overview
- 12.1.14.2. Products
- 12.1.14.3. Company Financials
- 12.1.14.4. SWOT Analysis
- 12.1.1 Air Products
- 12.2. Market Entropy
- 12.2.1 Company's Key Areas Served
- 12.2.2 Recent Developments
- 12.3. Company Market Share Analysis 2025
- 12.3.1 Top 5 Companies Market Share Analysis
- 12.3.2 Top 3 Companies Market Share Analysis
- 12.4. List of Potential Customers
- 13. Research Methodology
List of Figures
- Figure 1: Global Liquid Gas Rocket Propellant Revenue Breakdown (undefined, %) by Region 2025 & 2033
- Figure 2: North America Liquid Gas Rocket Propellant Revenue (undefined), by Application 2025 & 2033
- Figure 3: North America Liquid Gas Rocket Propellant Revenue Share (%), by Application 2025 & 2033
- Figure 4: North America Liquid Gas Rocket Propellant Revenue (undefined), by Type 2025 & 2033
- Figure 5: North America Liquid Gas Rocket Propellant Revenue Share (%), by Type 2025 & 2033
- Figure 6: North America Liquid Gas Rocket Propellant Revenue (undefined), by Country 2025 & 2033
- Figure 7: North America Liquid Gas Rocket Propellant Revenue Share (%), by Country 2025 & 2033
- Figure 8: South America Liquid Gas Rocket Propellant Revenue (undefined), by Application 2025 & 2033
- Figure 9: South America Liquid Gas Rocket Propellant Revenue Share (%), by Application 2025 & 2033
- Figure 10: South America Liquid Gas Rocket Propellant Revenue (undefined), by Type 2025 & 2033
- Figure 11: South America Liquid Gas Rocket Propellant Revenue Share (%), by Type 2025 & 2033
- Figure 12: South America Liquid Gas Rocket Propellant Revenue (undefined), by Country 2025 & 2033
- Figure 13: South America Liquid Gas Rocket Propellant Revenue Share (%), by Country 2025 & 2033
- Figure 14: Europe Liquid Gas Rocket Propellant Revenue (undefined), by Application 2025 & 2033
- Figure 15: Europe Liquid Gas Rocket Propellant Revenue Share (%), by Application 2025 & 2033
- Figure 16: Europe Liquid Gas Rocket Propellant Revenue (undefined), by Type 2025 & 2033
- Figure 17: Europe Liquid Gas Rocket Propellant Revenue Share (%), by Type 2025 & 2033
- Figure 18: Europe Liquid Gas Rocket Propellant Revenue (undefined), by Country 2025 & 2033
- Figure 19: Europe Liquid Gas Rocket Propellant Revenue Share (%), by Country 2025 & 2033
- Figure 20: Middle East & Africa Liquid Gas Rocket Propellant Revenue (undefined), by Application 2025 & 2033
- Figure 21: Middle East & Africa Liquid Gas Rocket Propellant Revenue Share (%), by Application 2025 & 2033
- Figure 22: Middle East & Africa Liquid Gas Rocket Propellant Revenue (undefined), by Type 2025 & 2033
- Figure 23: Middle East & Africa Liquid Gas Rocket Propellant Revenue Share (%), by Type 2025 & 2033
- Figure 24: Middle East & Africa Liquid Gas Rocket Propellant Revenue (undefined), by Country 2025 & 2033
- Figure 25: Middle East & Africa Liquid Gas Rocket Propellant Revenue Share (%), by Country 2025 & 2033
- Figure 26: Asia Pacific Liquid Gas Rocket Propellant Revenue (undefined), by Application 2025 & 2033
- Figure 27: Asia Pacific Liquid Gas Rocket Propellant Revenue Share (%), by Application 2025 & 2033
- Figure 28: Asia Pacific Liquid Gas Rocket Propellant Revenue (undefined), by Type 2025 & 2033
- Figure 29: Asia Pacific Liquid Gas Rocket Propellant Revenue Share (%), by Type 2025 & 2033
- Figure 30: Asia Pacific Liquid Gas Rocket Propellant Revenue (undefined), by Country 2025 & 2033
- Figure 31: Asia Pacific Liquid Gas Rocket Propellant Revenue Share (%), by Country 2025 & 2033
List of Tables
- Table 1: Global Liquid Gas Rocket Propellant Revenue undefined Forecast, by Application 2020 & 2033
- Table 2: Global Liquid Gas Rocket Propellant Revenue undefined Forecast, by Type 2020 & 2033
- Table 3: Global Liquid Gas Rocket Propellant Revenue undefined Forecast, by Region 2020 & 2033
- Table 4: Global Liquid Gas Rocket Propellant Revenue undefined Forecast, by Application 2020 & 2033
- Table 5: Global Liquid Gas Rocket Propellant Revenue undefined Forecast, by Type 2020 & 2033
- Table 6: Global Liquid Gas Rocket Propellant Revenue undefined Forecast, by Country 2020 & 2033
- Table 7: United States Liquid Gas Rocket Propellant Revenue (undefined) Forecast, by Application 2020 & 2033
- Table 8: Canada Liquid Gas Rocket Propellant Revenue (undefined) Forecast, by Application 2020 & 2033
- Table 9: Mexico Liquid Gas Rocket Propellant Revenue (undefined) Forecast, by Application 2020 & 2033
- Table 10: Global Liquid Gas Rocket Propellant Revenue undefined Forecast, by Application 2020 & 2033
- Table 11: Global Liquid Gas Rocket Propellant Revenue undefined Forecast, by Type 2020 & 2033
- Table 12: Global Liquid Gas Rocket Propellant Revenue undefined Forecast, by Country 2020 & 2033
- Table 13: Brazil Liquid Gas Rocket Propellant Revenue (undefined) Forecast, by Application 2020 & 2033
- Table 14: Argentina Liquid Gas Rocket Propellant Revenue (undefined) Forecast, by Application 2020 & 2033
- Table 15: Rest of South America Liquid Gas Rocket Propellant Revenue (undefined) Forecast, by Application 2020 & 2033
- Table 16: Global Liquid Gas Rocket Propellant Revenue undefined Forecast, by Application 2020 & 2033
- Table 17: Global Liquid Gas Rocket Propellant Revenue undefined Forecast, by Type 2020 & 2033
- Table 18: Global Liquid Gas Rocket Propellant Revenue undefined Forecast, by Country 2020 & 2033
- Table 19: United Kingdom Liquid Gas Rocket Propellant Revenue (undefined) Forecast, by Application 2020 & 2033
- Table 20: Germany Liquid Gas Rocket Propellant Revenue (undefined) Forecast, by Application 2020 & 2033
- Table 21: France Liquid Gas Rocket Propellant Revenue (undefined) Forecast, by Application 2020 & 2033
- Table 22: Italy Liquid Gas Rocket Propellant Revenue (undefined) Forecast, by Application 2020 & 2033
- Table 23: Spain Liquid Gas Rocket Propellant Revenue (undefined) Forecast, by Application 2020 & 2033
- Table 24: Russia Liquid Gas Rocket Propellant Revenue (undefined) Forecast, by Application 2020 & 2033
- Table 25: Benelux Liquid Gas Rocket Propellant Revenue (undefined) Forecast, by Application 2020 & 2033
- Table 26: Nordics Liquid Gas Rocket Propellant Revenue (undefined) Forecast, by Application 2020 & 2033
- Table 27: Rest of Europe Liquid Gas Rocket Propellant Revenue (undefined) Forecast, by Application 2020 & 2033
- Table 28: Global Liquid Gas Rocket Propellant Revenue undefined Forecast, by Application 2020 & 2033
- Table 29: Global Liquid Gas Rocket Propellant Revenue undefined Forecast, by Type 2020 & 2033
- Table 30: Global Liquid Gas Rocket Propellant Revenue undefined Forecast, by Country 2020 & 2033
- Table 31: Turkey Liquid Gas Rocket Propellant Revenue (undefined) Forecast, by Application 2020 & 2033
- Table 32: Israel Liquid Gas Rocket Propellant Revenue (undefined) Forecast, by Application 2020 & 2033
- Table 33: GCC Liquid Gas Rocket Propellant Revenue (undefined) Forecast, by Application 2020 & 2033
- Table 34: North Africa Liquid Gas Rocket Propellant Revenue (undefined) Forecast, by Application 2020 & 2033
- Table 35: South Africa Liquid Gas Rocket Propellant Revenue (undefined) Forecast, by Application 2020 & 2033
- Table 36: Rest of Middle East & Africa Liquid Gas Rocket Propellant Revenue (undefined) Forecast, by Application 2020 & 2033
- Table 37: Global Liquid Gas Rocket Propellant Revenue undefined Forecast, by Application 2020 & 2033
- Table 38: Global Liquid Gas Rocket Propellant Revenue undefined Forecast, by Type 2020 & 2033
- Table 39: Global Liquid Gas Rocket Propellant Revenue undefined Forecast, by Country 2020 & 2033
- Table 40: China Liquid Gas Rocket Propellant Revenue (undefined) Forecast, by Application 2020 & 2033
- Table 41: India Liquid Gas Rocket Propellant Revenue (undefined) Forecast, by Application 2020 & 2033
- Table 42: Japan Liquid Gas Rocket Propellant Revenue (undefined) Forecast, by Application 2020 & 2033
- Table 43: South Korea Liquid Gas Rocket Propellant Revenue (undefined) Forecast, by Application 2020 & 2033
- Table 44: ASEAN Liquid Gas Rocket Propellant Revenue (undefined) Forecast, by Application 2020 & 2033
- Table 45: Oceania Liquid Gas Rocket Propellant Revenue (undefined) Forecast, by Application 2020 & 2033
- Table 46: Rest of Asia Pacific Liquid Gas Rocket Propellant Revenue (undefined) Forecast, by Application 2020 & 2033
Frequently Asked Questions
1. What is the projected Compound Annual Growth Rate (CAGR) of the Liquid Gas Rocket Propellant?
The projected CAGR is approximately 13.6%.
2. Which companies are prominent players in the Liquid Gas Rocket Propellant?
Key companies in the market include Air Products, Praxair, Inc., Linde Group, Air Liquide, SpaceX, ISRO, AMPAC Fine Chemicals, CRS Chemicals, Ultramet, Eurenco, Island Pyrochemical Industries, AMPAC Fine Chemicals(SK), Safran Group, JAXA.
3. What are the main segments of the Liquid Gas Rocket Propellant?
The market segments include Application, Type.
4. Can you provide details about the market size?
The market size is estimated to be USD XXX N/A as of 2022.
5. What are some drivers contributing to market growth?
N/A
6. What are the notable trends driving market growth?
N/A
7. Are there any restraints impacting market growth?
N/A
8. Can you provide examples of recent developments in the market?
N/A
9. What pricing options are available for accessing the report?
Pricing options include single-user, multi-user, and enterprise licenses priced at USD 2900.00, USD 4350.00, and USD 5800.00 respectively.
10. Is the market size provided in terms of value or volume?
The market size is provided in terms of value, measured in N/A.
11. Are there any specific market keywords associated with the report?
Yes, the market keyword associated with the report is "Liquid Gas Rocket Propellant," which aids in identifying and referencing the specific market segment covered.
12. How do I determine which pricing option suits my needs best?
The pricing options vary based on user requirements and access needs. Individual users may opt for single-user licenses, while businesses requiring broader access may choose multi-user or enterprise licenses for cost-effective access to the report.
13. Are there any additional resources or data provided in the Liquid Gas Rocket Propellant report?
While the report offers comprehensive insights, it's advisable to review the specific contents or supplementary materials provided to ascertain if additional resources or data are available.
14. How can I stay updated on further developments or reports in the Liquid Gas Rocket Propellant?
To stay informed about further developments, trends, and reports in the Liquid Gas Rocket Propellant, consider subscribing to industry newsletters, following relevant companies and organizations, or regularly checking reputable industry news sources and publications.
Methodology
Step 1 - Identification of Relevant Samples Size from Population Database


Step 2 - Approaches for Defining Global Market Size (Value, Volume* & Price*)

Note*: In applicable scenarios
Step 3 - Data Sources
Primary Research
- Web Analytics
- Survey Reports
- Research Institute
- Latest Research Reports
- Opinion Leaders
Secondary Research
- Annual Reports
- White Paper
- Latest Press Release
- Industry Association
- Paid Database
- Investor Presentations

Step 4 - Data Triangulation
Involves using different sources of information in order to increase the validity of a study
These sources are likely to be stakeholders in a program - participants, other researchers, program staff, other community members, and so on.
Then we put all data in single framework & apply various statistical tools to find out the dynamic on the market.
During the analysis stage, feedback from the stakeholder groups would be compared to determine areas of agreement as well as areas of divergence