

Key Insights
The global Liquid Salts and Ionic Liquid market is poised for robust expansion, projected to reach an estimated $267 million by 2025, exhibiting a Compound Annual Growth Rate (CAGR) of 9.4% over the forecast period of 2025-2033. This significant growth is primarily propelled by the escalating demand for these versatile materials as efficient solvents in various industrial processes, including chemical synthesis and green chemistry applications. Their exceptional thermal stability, negligible vapor pressure, and tunable properties make them ideal replacements for conventional volatile organic compounds (VOCs), addressing growing environmental concerns and regulatory pressures. Furthermore, the increasing adoption of ionic liquids as antistatic agents in the electronics and textile industries, and as CO2 gas absorbents in carbon capture technologies, are key drivers contributing to market dynamism. The electrolyte segment, especially for advanced battery technologies, is also witnessing substantial growth, fueled by the burgeoning electric vehicle and portable electronics markets.
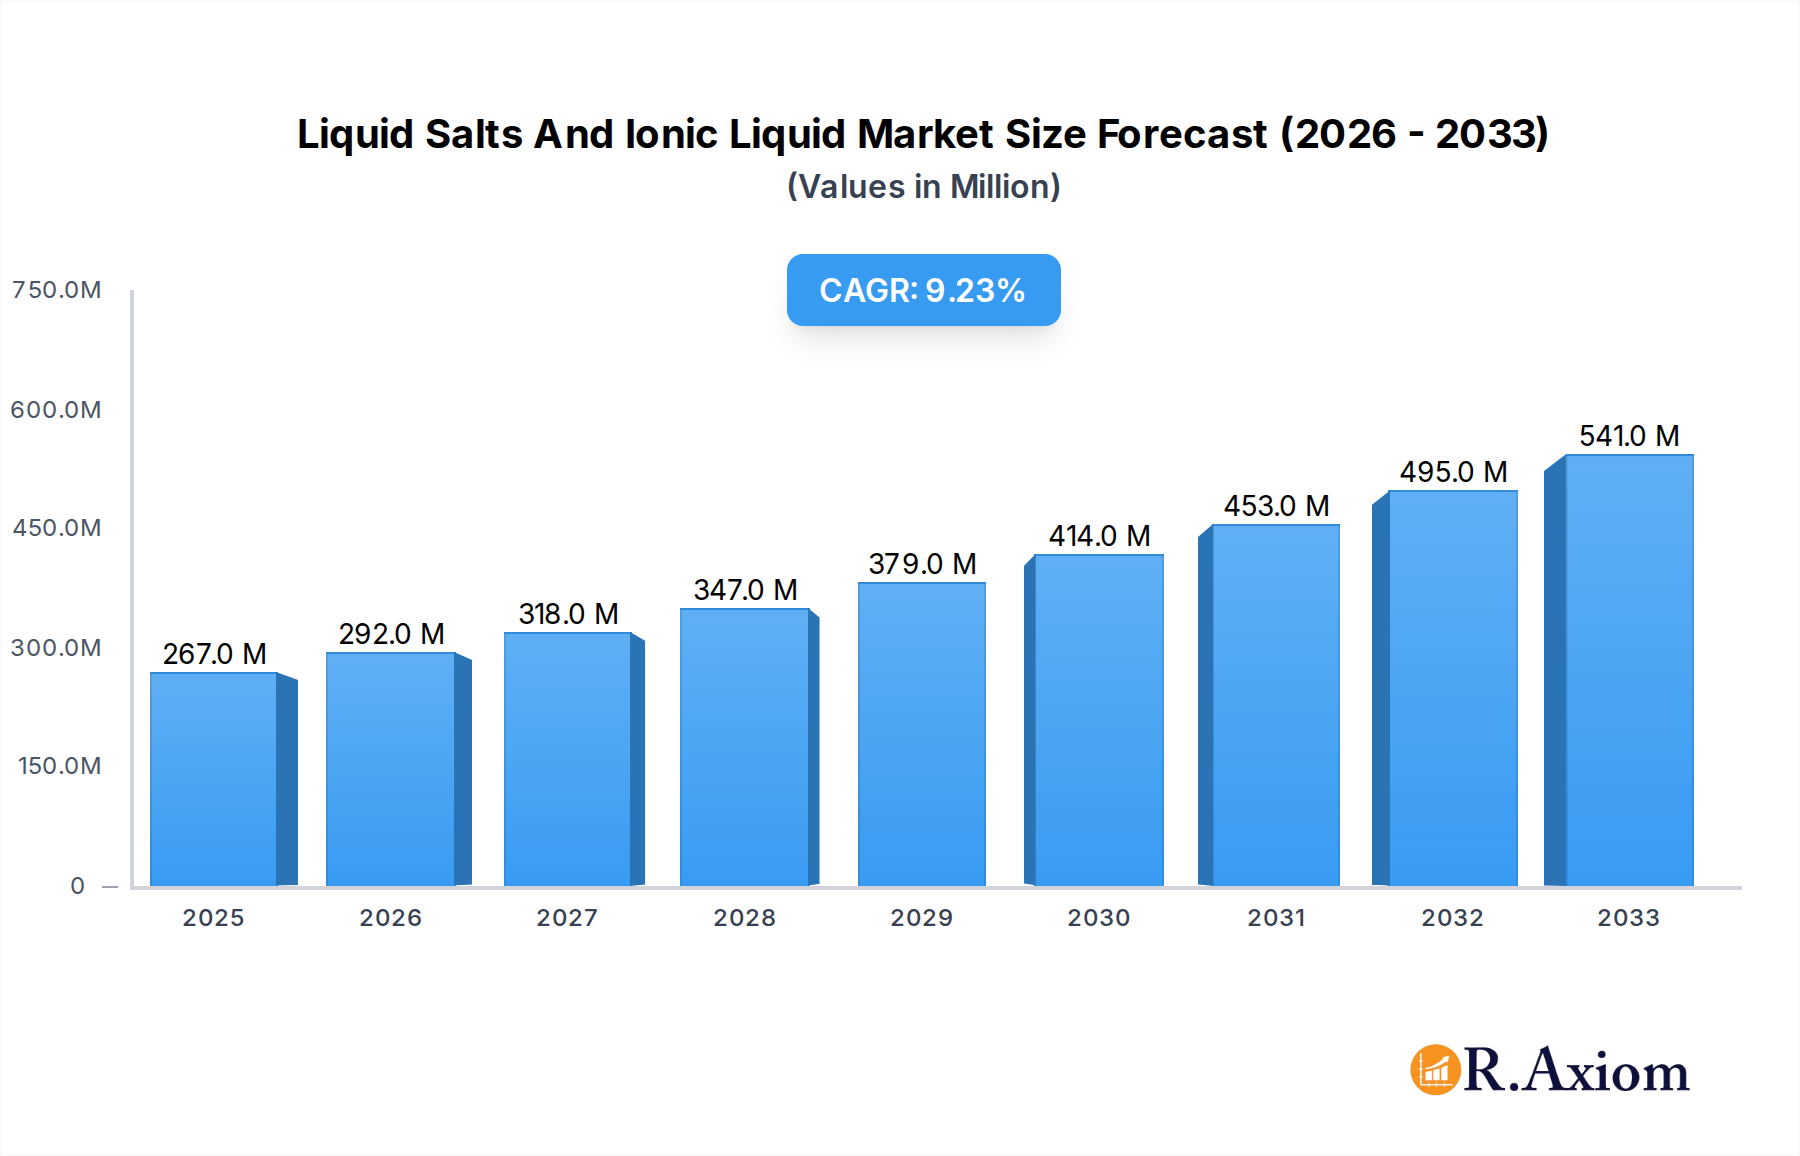
Liquid Salts And Ionic Liquid Market Size (In Million)
The market's trajectory is further shaped by a strong emphasis on research and development to explore novel applications and tailor ionic liquid properties for specific end-uses. Emerging trends include the development of task-specific ionic liquids for catalysis and advanced materials synthesis, as well as their utilization in biomass processing and pharmaceuticals. While the market is characterized by significant growth potential, certain restraints, such as the relatively high cost of production for some specialized ionic liquids and the need for standardized recycling and disposal methods, could temper the pace of adoption in certain sectors. However, ongoing technological advancements and increasing economies of scale are expected to mitigate these challenges. The market is segmented based on application, with Solvent, Antistatic Agent, and CO2 Gas Absorbent holding significant shares, and by type, with Imidazolium-based, Pyridinium-based, and Phosphonium-based ionic liquids dominating the landscape. Geographically, Asia Pacific, particularly China and India, is expected to be a major growth hub, owing to its expanding industrial base and increasing investments in R&D.

Liquid Salts And Ionic Liquid Company Market Share
This in-depth market research report provides an exhaustive analysis of the global Liquid Salts and Ionic Liquids market, encompassing historical data, current trends, and future projections. The study covers market size, segmentation, competitive landscape, innovation drivers, and growth opportunities, offering invaluable insights for industry stakeholders.
Study Period: 2019–2033 | Base Year: 2025 | Estimated Year: 2025 | Forecast Period: 2025–2033 | Historical Period: 2019–2024
Liquid Salts And Ionic Liquid Market Concentration & Innovation
The Liquid Salts and Ionic Liquids market exhibits a moderate level of concentration, with a blend of established chemical giants and specialized niche players driving innovation. Key companies like BASF, Evonik Industries, Solvay, and Merck hold significant market share, contributing to the development of novel applications and advanced formulations. Simultaneously, agile firms such as KOEI Chemical, Sanyo Chemical, Proionic, Solvionic, IoLiTec, Zhejiang Lande, Linzhou Keneng, and Jinkai Chemical are instrumental in pushing the boundaries of ionic liquid technology, particularly in specialized segments. Innovation is primarily driven by the demand for sustainable and high-performance alternatives to traditional solvents and electrolytes. Regulatory frameworks, particularly those promoting green chemistry and stricter environmental standards, are accelerating research and development in this sector. While direct product substitutes remain limited due to the unique properties of ionic liquids, advancements in alternative solvent technologies and next-generation battery chemistries present indirect competitive pressures. End-user trends indicate a growing preference for ionic liquids in applications demanding high thermal stability, low vapor pressure, and excellent electrochemical properties. Mergers and acquisitions (M&A) are a notable feature, with recent deal values estimated to be in the hundreds of millions of dollars, as larger corporations seek to acquire specialized expertise and expand their product portfolios. For instance, strategic acquisitions aimed at bolstering capabilities in areas like CO2 gas absorption and advanced electrolyte development are expected to shape the market landscape.
Liquid Salts And Ionic Liquid Industry Trends & Insights
The global Liquid Salts and Ionic Liquids market is poised for substantial growth, driven by a confluence of technological advancements, evolving consumer preferences, and increasing environmental consciousness. The compound annual growth rate (CAGR) is projected to be robust, estimated to be around 10% to 15% over the forecast period, reflecting the expanding applications and adoption across various industries. Market penetration is steadily increasing as industries recognize the unique advantages offered by these materials. For example, in the energy sector, ionic liquids are gaining traction as superior electrolytes for advanced battery technologies, enabling higher energy density and improved safety profiles. This trend is further amplified by the global push towards electrification and renewable energy storage solutions.
Technological disruptions are a significant catalyst. Researchers are continuously developing novel ionic liquid structures with tailored properties, such as enhanced biodegradability, reduced toxicity, and improved recyclability, addressing some of the earlier concerns associated with their environmental impact. The development of task-specific ionic liquids, designed for precise applications like selective gas separation or highly efficient catalysis, is a key area of innovation. This precision engineering allows for more sustainable and cost-effective industrial processes.
Consumer preferences are increasingly tilting towards "green" and sustainable solutions. Ionic liquids, with their low volatility and potential for recyclability, align perfectly with these demands. Industries are actively seeking to replace volatile organic compounds (VOCs) with ionic liquids in applications ranging from industrial cleaning and synthesis to advanced material processing.
Competitive dynamics are characterized by intense research and development activities, strategic partnerships, and a focus on cost-effective production methods. Companies are investing heavily in optimizing synthesis routes and scaling up production to meet growing demand. The competitive landscape is also shaped by intellectual property protection, with patents playing a crucial role in establishing market leadership. Emerging markets, particularly in Asia, are presenting significant growth opportunities due to expanding manufacturing bases and a growing emphasis on technological innovation. The integration of AI and machine learning in the design and discovery of new ionic liquids is also becoming a game-changer, accelerating the development cycle and leading to more targeted and efficient solutions. Furthermore, the increasing adoption of ionic liquids in areas like advanced lubricants and functional fluids is contributing to market expansion.
Dominant Markets & Segments in Liquid Salts And Ionic Liquid
The Liquid Salts and Ionic Liquids market is experiencing significant expansion across diverse applications and types, with specific regions and segments demonstrating leading growth.
Dominant Regions and Countries:
- North America and Europe: These regions currently hold a dominant position in terms of market share due to established chemical industries, strong research and development infrastructure, and stringent environmental regulations that favor sustainable alternatives. Significant investments in advanced materials and electrochemical technologies contribute to their leadership.
- Asia Pacific: This region is projected to witness the fastest growth rate. Economic policies promoting industrial development, a burgeoning manufacturing sector, and increasing government initiatives supporting green technologies are key drivers. Countries like China and South Korea are emerging as major hubs for ionic liquid production and application development.
Dominant Segments by Application:
- Solvent: Ionic liquids are extensively utilized as environmentally friendly solvents in various chemical reactions and separation processes. Their tunable properties, low vapor pressure, and high thermal stability make them ideal replacements for traditional VOCs. The demand is fueled by the pharmaceutical, agrochemical, and fine chemical industries seeking greener synthesis routes.
- Electrolyte: This segment is experiencing rapid growth, particularly in the battery industry. Ionic liquids offer superior ionic conductivity, wider electrochemical windows, and enhanced safety compared to conventional electrolytes in lithium-ion batteries, next-generation batteries (e.g., solid-state), and supercapacitors. The global shift towards electric vehicles and renewable energy storage is a major impetus.
- CO2 Gas Absorbent: With the increasing global focus on carbon capture and storage (CCS) technologies, ionic liquids are gaining prominence as highly efficient absorbents for CO2. Their tunable affinity for CO2 allows for selective capture from flue gases, contributing to climate change mitigation efforts.
- Catalysis: Ionic liquids serve as versatile catalytic media and even as catalysts themselves, offering benefits such as improved reaction rates, selectivity, and recyclability of the catalyst. This application is crucial in petrochemical processing, polymerization, and fine chemical synthesis.
- Lubricant: The unique properties of ionic liquids, including high thermal stability, low volatility, and excellent film-forming capabilities, make them attractive as high-performance lubricants in demanding industrial applications.
- Antistatic Agent: Ionic liquids are employed in the plastics and textiles industries to impart antistatic properties, preventing charge build-up and improving material handling and product performance.
Dominant Segments by Type:
- Imidazolium-based Ionic Liquids: These constitute the largest and most widely studied class of ionic liquids, offering a broad range of tunable properties and finding extensive use across various applications, including solvents, electrolytes, and catalysts. Their versatility and well-established synthesis routes contribute to their dominance.
- Phosphonium-based Ionic Liquids: These are gaining traction for applications requiring high thermal stability and specific functionalities, such as in advanced lubricants and electrolytes for high-temperature batteries.
- Pyridinium-based Ionic Liquids: While a smaller segment, these are finding niche applications where specific chemical interactions or solubility profiles are required.
Key drivers for dominance in these segments include technological advancements in synthesis and purification, cost-effectiveness of production, regulatory support for sustainable chemicals, and growing end-user demand for high-performance and environmentally benign materials.
Liquid Salts And Ionic Liquid Product Developments
Recent product developments in Liquid Salts and Ionic Liquids are characterized by a strong emphasis on sustainability, enhanced performance, and novel applications. Companies are innovating to create task-specific ionic liquids with tailored properties for highly specialized uses. Key advancements include the development of biodegradable and bio-derived ionic liquids, addressing environmental concerns and appealing to eco-conscious industries. Furthermore, ionic liquids with improved thermal stability and wider electrochemical windows are being introduced for use in next-generation energy storage devices and high-temperature catalytic processes. The competitive advantage lies in offering customized solutions that outperform conventional materials in terms of efficiency, safety, and environmental impact, catering to the evolving needs of sectors like advanced manufacturing, renewable energy, and specialty chemicals.
Report Scope & Segmentation Analysis
The scope of this report encompasses a comprehensive analysis of the global Liquid Salts and Ionic Liquids market, segmented by Application and Type.
Application Segments:
- Solvent: This segment is projected to experience steady growth, driven by the chemical, pharmaceutical, and research sectors seeking greener alternatives to traditional solvents. Market size is estimated to reach several hundred million dollars by the forecast period.
- Antistatic Agent: Growth in this segment is linked to the demand from the electronics, packaging, and textile industries. Projected market penetration is moderate but consistent.
- CO2 Gas Absorbent: This segment is poised for significant expansion due to the increasing focus on carbon capture technologies. Its market size is expected to grow substantially as climate change mitigation efforts intensify.
- Lubricant: Applications in aerospace, automotive, and industrial machinery are fueling growth, with a focus on high-performance and extreme-condition lubrication.
- Electrolyte: This is a rapidly growing segment, primarily driven by the battery industry's demand for advanced energy storage solutions.
- Catalysis: Continuous innovation in chemical synthesis and process efficiency is driving demand for ionic liquids as catalysts and catalytic media.
- Other: This segment includes emerging applications and niche uses that contribute to the overall market diversification.
Type Segments:
- Imidazolium-based: This segment represents the largest market share due to its versatility and widespread application. Its growth is expected to remain robust.
- Pyridinium-based: This segment caters to specific niche applications and is expected to exhibit moderate growth.
- Phosphonium-based: Driven by demand for high-temperature applications and specialized electrolytes, this segment is projected to grow at a faster pace.
- Other: This segment includes other classes of ionic liquids and novel structures, contributing to the overall innovation landscape.
Key Drivers of Liquid Salts And Ionic Liquid Growth
The growth of the Liquid Salts and Ionic Liquids market is propelled by several key factors. Environmentally conscious regulations and the increasing demand for sustainable chemical processes are major drivers, pushing industries to adopt greener alternatives to volatile organic compounds (VOCs). Technological advancements in the synthesis and application of ionic liquids, leading to enhanced performance characteristics such as high thermal stability, low vapor pressure, and tunable solvency, are critical. The burgeoning renewable energy sector, particularly the demand for advanced battery technologies and supercapacitors, presents a significant growth catalyst for ionic liquid electrolytes. Furthermore, their unique properties are finding increasing use in specialized applications like CO2 capture, catalysis, and high-performance lubricants, creating new market avenues.
Challenges in the Liquid Salts And Ionic Liquid Sector
Despite the promising growth trajectory, the Liquid Salts and Ionic Liquids sector faces several challenges. The high cost of synthesis and purification compared to traditional solvents remains a significant barrier to widespread adoption in some price-sensitive applications. Concerns regarding the long-term environmental impact and biodegradability of certain ionic liquids, although being addressed through research, can still influence market perception and regulatory scrutiny. Scaling up production to meet the demands of rapidly growing sectors like energy storage can also present logistical and technical hurdles. Moreover, competition from alternative advanced materials and the need for extensive research and development to discover new applications can slow down market penetration in certain areas.
Emerging Opportunities in Liquid Salts And Ionic Liquid
Emerging opportunities in the Liquid Salts and Ionic Liquids market are abundant and diverse. The growing global emphasis on decarbonization and carbon capture technologies presents a substantial opportunity for ionic liquids as efficient CO2 absorbents. The rapid expansion of the electric vehicle market and the continuous quest for safer and higher-performing energy storage solutions are creating immense demand for ionic liquid electrolytes. Furthermore, the development of ionic liquids for use in advanced materials, such as functional polymers and membranes, and in bio-based applications like drug delivery and bioremediation, offers significant untapped potential. The exploration of ionic liquids in niche industrial processes, including advanced separation techniques and sustainable manufacturing, is also expected to drive future growth.
Leading Players in the Liquid Salts And Ionic Liquid Market
- BASF
- Evonik Industries
- Solvay
- Merck
- KOEI Chemical
- Sanyo Chemical
- Proionic
- Solvionic
- IoLiTec
- Zhejiang Lande
- Linzhou Keneng
- Jinkai Chemical
Key Developments in Liquid Salts And Ionic Liquid Industry
- 2024: Launch of novel biodegradable ionic liquids for pharmaceutical synthesis applications, enhancing sustainability.
- 2023: Significant advancements in the development of high-voltage electrolytes for next-generation lithium-ion batteries, improving energy density and safety.
- 2023: Strategic partnerships formed for large-scale production of ionic liquids for carbon capture technologies, addressing climate change concerns.
- 2022: Introduction of new phosphonium-based ionic liquids with exceptional thermal stability for high-performance lubricant applications.
- 2021: Increased M&A activity as larger chemical companies acquire specialized ionic liquid manufacturers to expand their portfolios and technological capabilities.
- 2020: Development of ion gels based on ionic liquids for flexible electronics and wearable devices, opening new application frontiers.
Strategic Outlook for Liquid Salts And Ionic Liquid Market
The strategic outlook for the Liquid Salts and Ionic Liquids market is exceptionally promising, driven by the inherent versatility and unique properties of these materials. Continued investment in research and development will be crucial for unlocking new applications and optimizing existing ones, particularly in high-growth areas like sustainable energy, advanced materials, and environmental technologies. Collaborations between academic institutions and industry players will accelerate innovation and facilitate the translation of laboratory discoveries into commercial products. Furthermore, a focus on cost-effective and scalable production methods, alongside efforts to improve the biodegradability and reduce the environmental footprint of ionic liquids, will be key to achieving widespread market penetration. The market is expected to witness significant consolidation and strategic alliances as companies aim to leverage synergies and expand their global reach in response to increasing demand for high-performance, sustainable chemical solutions.
Liquid Salts And Ionic Liquid Segmentation
-
1. Application
- 1.1. Solvent
- 1.2. Antistatic Agent
- 1.3. CO2 Gas Absorbent
- 1.4. Lubricant
- 1.5. Electrolyte
- 1.6. Catalysis
- 1.7. Other
-
2. Type
- 2.1. Imidazolium-based
- 2.2. Pyridinium-based
- 2.3. Phosphonium-based
- 2.4. Other
Liquid Salts And Ionic Liquid Segmentation By Geography
-
1. North America
- 1.1. United States
- 1.2. Canada
- 1.3. Mexico
-
2. South America
- 2.1. Brazil
- 2.2. Argentina
- 2.3. Rest of South America
-
3. Europe
- 3.1. United Kingdom
- 3.2. Germany
- 3.3. France
- 3.4. Italy
- 3.5. Spain
- 3.6. Russia
- 3.7. Benelux
- 3.8. Nordics
- 3.9. Rest of Europe
-
4. Middle East & Africa
- 4.1. Turkey
- 4.2. Israel
- 4.3. GCC
- 4.4. North Africa
- 4.5. South Africa
- 4.6. Rest of Middle East & Africa
-
5. Asia Pacific
- 5.1. China
- 5.2. India
- 5.3. Japan
- 5.4. South Korea
- 5.5. ASEAN
- 5.6. Oceania
- 5.7. Rest of Asia Pacific
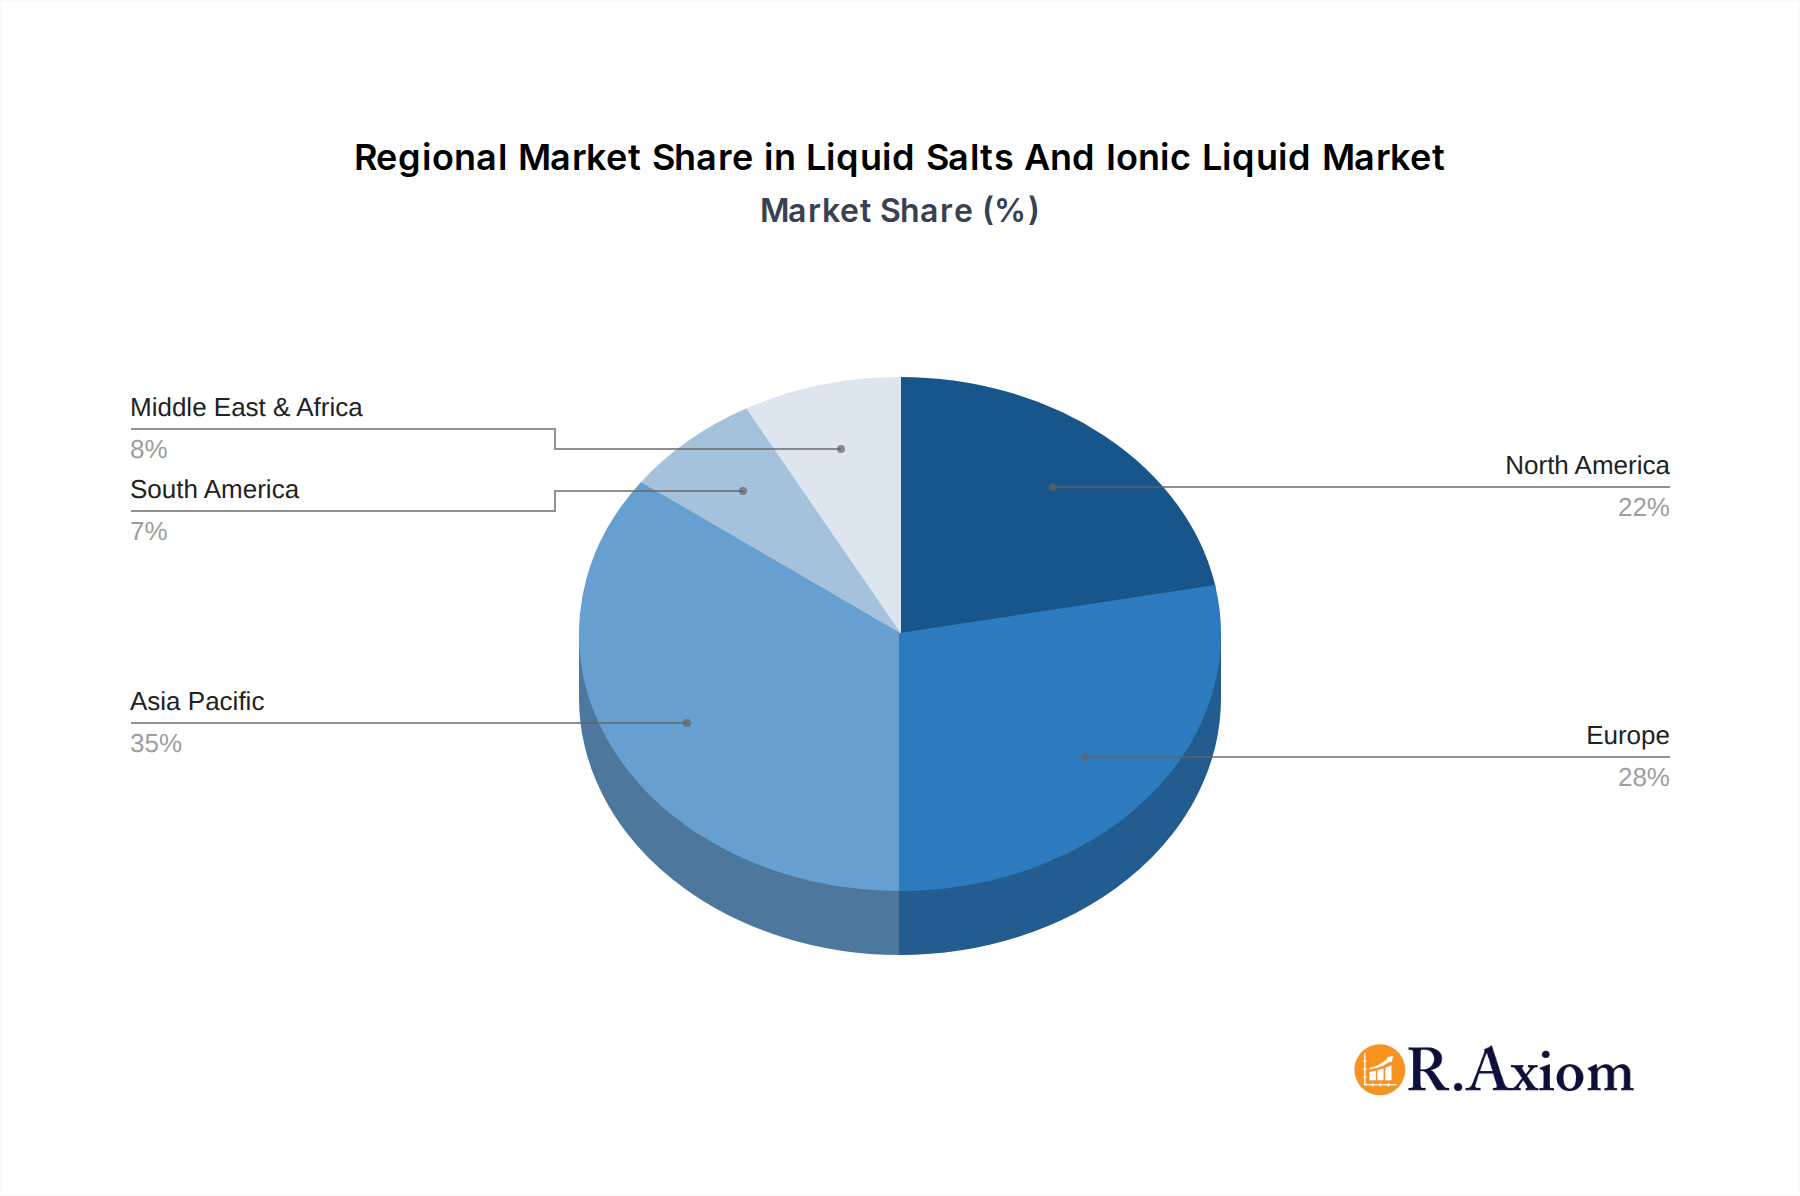
Liquid Salts And Ionic Liquid Regional Market Share
Geographic Coverage of Liquid Salts And Ionic Liquid
Liquid Salts And Ionic Liquid REPORT HIGHLIGHTS
| Aspects | Details |
|---|---|
| Study Period | 2020-2034 |
| Base Year | 2025 |
| Estimated Year | 2026 |
| Forecast Period | 2026-2034 |
| Historical Period | 2020-2025 |
| Growth Rate | CAGR of 9.4% from 2020-2034 |
| Segmentation |
|
Table of Contents
- 1. Introduction
- 1.1. Research Scope
- 1.2. Market Segmentation
- 1.3. Research Objective
- 1.4. Definitions and Assumptions
- 2. Executive Summary
- 2.1. Market Snapshot
- 3. Market Dynamics
- 3.1. Market Drivers
- 3.2. Market Restrains
- 3.3. Market Trends
- 3.4. Market Opportunities
- 4. Market Factor Analysis
- 4.1. Porters Five Forces
- 4.1.1. Bargaining Power of Suppliers
- 4.1.2. Bargaining Power of Buyers
- 4.1.3. Threat of New Entrants
- 4.1.4. Threat of Substitutes
- 4.1.5. Competitive Rivalry
- 4.2. PESTEL analysis
- 4.3. BCG Analysis
- 4.3.1. Stars (High Growth, High Market Share)
- 4.3.2. Cash Cows (Low Growth, High Market Share)
- 4.3.3. Question Mark (High Growth, Low Market Share)
- 4.3.4. Dogs (Low Growth, Low Market Share)
- 4.4. Ansoff Matrix Analysis
- 4.5. Supply Chain Analysis
- 4.6. Regulatory Landscape
- 4.7. Current Market Potential and Opportunity Assessment (TAM–SAM–SOM Framework)
- 4.8. RAX Analyst Note
- 4.1. Porters Five Forces
- 5. Market Analysis, Insights and Forecast 2021-2033
- 5.1. Market Analysis, Insights and Forecast - by Application
- 5.1.1. Solvent
- 5.1.2. Antistatic Agent
- 5.1.3. CO2 Gas Absorbent
- 5.1.4. Lubricant
- 5.1.5. Electrolyte
- 5.1.6. Catalysis
- 5.1.7. Other
- 5.2. Market Analysis, Insights and Forecast - by Type
- 5.2.1. Imidazolium-based
- 5.2.2. Pyridinium-based
- 5.2.3. Phosphonium-based
- 5.2.4. Other
- 5.3. Market Analysis, Insights and Forecast - by Region
- 5.3.1. North America
- 5.3.2. South America
- 5.3.3. Europe
- 5.3.4. Middle East & Africa
- 5.3.5. Asia Pacific
- 5.1. Market Analysis, Insights and Forecast - by Application
- 6. Global Liquid Salts And Ionic Liquid Analysis, Insights and Forecast, 2021-2033
- 6.1. Market Analysis, Insights and Forecast - by Application
- 6.1.1. Solvent
- 6.1.2. Antistatic Agent
- 6.1.3. CO2 Gas Absorbent
- 6.1.4. Lubricant
- 6.1.5. Electrolyte
- 6.1.6. Catalysis
- 6.1.7. Other
- 6.2. Market Analysis, Insights and Forecast - by Type
- 6.2.1. Imidazolium-based
- 6.2.2. Pyridinium-based
- 6.2.3. Phosphonium-based
- 6.2.4. Other
- 6.1. Market Analysis, Insights and Forecast - by Application
- 7. North America Liquid Salts And Ionic Liquid Analysis, Insights and Forecast, 2020-2032
- 7.1. Market Analysis, Insights and Forecast - by Application
- 7.1.1. Solvent
- 7.1.2. Antistatic Agent
- 7.1.3. CO2 Gas Absorbent
- 7.1.4. Lubricant
- 7.1.5. Electrolyte
- 7.1.6. Catalysis
- 7.1.7. Other
- 7.2. Market Analysis, Insights and Forecast - by Type
- 7.2.1. Imidazolium-based
- 7.2.2. Pyridinium-based
- 7.2.3. Phosphonium-based
- 7.2.4. Other
- 7.1. Market Analysis, Insights and Forecast - by Application
- 8. South America Liquid Salts And Ionic Liquid Analysis, Insights and Forecast, 2020-2032
- 8.1. Market Analysis, Insights and Forecast - by Application
- 8.1.1. Solvent
- 8.1.2. Antistatic Agent
- 8.1.3. CO2 Gas Absorbent
- 8.1.4. Lubricant
- 8.1.5. Electrolyte
- 8.1.6. Catalysis
- 8.1.7. Other
- 8.2. Market Analysis, Insights and Forecast - by Type
- 8.2.1. Imidazolium-based
- 8.2.2. Pyridinium-based
- 8.2.3. Phosphonium-based
- 8.2.4. Other
- 8.1. Market Analysis, Insights and Forecast - by Application
- 9. Europe Liquid Salts And Ionic Liquid Analysis, Insights and Forecast, 2020-2032
- 9.1. Market Analysis, Insights and Forecast - by Application
- 9.1.1. Solvent
- 9.1.2. Antistatic Agent
- 9.1.3. CO2 Gas Absorbent
- 9.1.4. Lubricant
- 9.1.5. Electrolyte
- 9.1.6. Catalysis
- 9.1.7. Other
- 9.2. Market Analysis, Insights and Forecast - by Type
- 9.2.1. Imidazolium-based
- 9.2.2. Pyridinium-based
- 9.2.3. Phosphonium-based
- 9.2.4. Other
- 9.1. Market Analysis, Insights and Forecast - by Application
- 10. Middle East & Africa Liquid Salts And Ionic Liquid Analysis, Insights and Forecast, 2020-2032
- 10.1. Market Analysis, Insights and Forecast - by Application
- 10.1.1. Solvent
- 10.1.2. Antistatic Agent
- 10.1.3. CO2 Gas Absorbent
- 10.1.4. Lubricant
- 10.1.5. Electrolyte
- 10.1.6. Catalysis
- 10.1.7. Other
- 10.2. Market Analysis, Insights and Forecast - by Type
- 10.2.1. Imidazolium-based
- 10.2.2. Pyridinium-based
- 10.2.3. Phosphonium-based
- 10.2.4. Other
- 10.1. Market Analysis, Insights and Forecast - by Application
- 11. Asia Pacific Liquid Salts And Ionic Liquid Analysis, Insights and Forecast, 2020-2032
- 11.1. Market Analysis, Insights and Forecast - by Application
- 11.1.1. Solvent
- 11.1.2. Antistatic Agent
- 11.1.3. CO2 Gas Absorbent
- 11.1.4. Lubricant
- 11.1.5. Electrolyte
- 11.1.6. Catalysis
- 11.1.7. Other
- 11.2. Market Analysis, Insights and Forecast - by Type
- 11.2.1. Imidazolium-based
- 11.2.2. Pyridinium-based
- 11.2.3. Phosphonium-based
- 11.2.4. Other
- 11.1. Market Analysis, Insights and Forecast - by Application
- 12. Competitive Analysis
- 12.1. Company Profiles
- 12.1.1 BASF
- 12.1.1.1. Company Overview
- 12.1.1.2. Products
- 12.1.1.3. Company Financials
- 12.1.1.4. SWOT Analysis
- 12.1.2 Evonik Industries
- 12.1.2.1. Company Overview
- 12.1.2.2. Products
- 12.1.2.3. Company Financials
- 12.1.2.4. SWOT Analysis
- 12.1.3 Solvay
- 12.1.3.1. Company Overview
- 12.1.3.2. Products
- 12.1.3.3. Company Financials
- 12.1.3.4. SWOT Analysis
- 12.1.4 Merck
- 12.1.4.1. Company Overview
- 12.1.4.2. Products
- 12.1.4.3. Company Financials
- 12.1.4.4. SWOT Analysis
- 12.1.5 KOEI Chemical
- 12.1.5.1. Company Overview
- 12.1.5.2. Products
- 12.1.5.3. Company Financials
- 12.1.5.4. SWOT Analysis
- 12.1.6 Sanyo Chemical
- 12.1.6.1. Company Overview
- 12.1.6.2. Products
- 12.1.6.3. Company Financials
- 12.1.6.4. SWOT Analysis
- 12.1.7 Proionic
- 12.1.7.1. Company Overview
- 12.1.7.2. Products
- 12.1.7.3. Company Financials
- 12.1.7.4. SWOT Analysis
- 12.1.8 Solvionic
- 12.1.8.1. Company Overview
- 12.1.8.2. Products
- 12.1.8.3. Company Financials
- 12.1.8.4. SWOT Analysis
- 12.1.9 IoLiTec
- 12.1.9.1. Company Overview
- 12.1.9.2. Products
- 12.1.9.3. Company Financials
- 12.1.9.4. SWOT Analysis
- 12.1.10 Zhejiang Lande
- 12.1.10.1. Company Overview
- 12.1.10.2. Products
- 12.1.10.3. Company Financials
- 12.1.10.4. SWOT Analysis
- 12.1.11 Linzhou Keneng
- 12.1.11.1. Company Overview
- 12.1.11.2. Products
- 12.1.11.3. Company Financials
- 12.1.11.4. SWOT Analysis
- 12.1.12 Jinkai Chemical
- 12.1.12.1. Company Overview
- 12.1.12.2. Products
- 12.1.12.3. Company Financials
- 12.1.12.4. SWOT Analysis
- 12.1.1 BASF
- 12.2. Market Entropy
- 12.2.1 Company's Key Areas Served
- 12.2.2 Recent Developments
- 12.3. Company Market Share Analysis 2025
- 12.3.1 Top 5 Companies Market Share Analysis
- 12.3.2 Top 3 Companies Market Share Analysis
- 12.4. List of Potential Customers
- 13. Research Methodology
List of Figures
- Figure 1: Global Liquid Salts And Ionic Liquid Revenue Breakdown (million, %) by Region 2025 & 2033
- Figure 2: Global Liquid Salts And Ionic Liquid Volume Breakdown (K, %) by Region 2025 & 2033
- Figure 3: North America Liquid Salts And Ionic Liquid Revenue (million), by Application 2025 & 2033
- Figure 4: North America Liquid Salts And Ionic Liquid Volume (K), by Application 2025 & 2033
- Figure 5: North America Liquid Salts And Ionic Liquid Revenue Share (%), by Application 2025 & 2033
- Figure 6: North America Liquid Salts And Ionic Liquid Volume Share (%), by Application 2025 & 2033
- Figure 7: North America Liquid Salts And Ionic Liquid Revenue (million), by Type 2025 & 2033
- Figure 8: North America Liquid Salts And Ionic Liquid Volume (K), by Type 2025 & 2033
- Figure 9: North America Liquid Salts And Ionic Liquid Revenue Share (%), by Type 2025 & 2033
- Figure 10: North America Liquid Salts And Ionic Liquid Volume Share (%), by Type 2025 & 2033
- Figure 11: North America Liquid Salts And Ionic Liquid Revenue (million), by Country 2025 & 2033
- Figure 12: North America Liquid Salts And Ionic Liquid Volume (K), by Country 2025 & 2033
- Figure 13: North America Liquid Salts And Ionic Liquid Revenue Share (%), by Country 2025 & 2033
- Figure 14: North America Liquid Salts And Ionic Liquid Volume Share (%), by Country 2025 & 2033
- Figure 15: South America Liquid Salts And Ionic Liquid Revenue (million), by Application 2025 & 2033
- Figure 16: South America Liquid Salts And Ionic Liquid Volume (K), by Application 2025 & 2033
- Figure 17: South America Liquid Salts And Ionic Liquid Revenue Share (%), by Application 2025 & 2033
- Figure 18: South America Liquid Salts And Ionic Liquid Volume Share (%), by Application 2025 & 2033
- Figure 19: South America Liquid Salts And Ionic Liquid Revenue (million), by Type 2025 & 2033
- Figure 20: South America Liquid Salts And Ionic Liquid Volume (K), by Type 2025 & 2033
- Figure 21: South America Liquid Salts And Ionic Liquid Revenue Share (%), by Type 2025 & 2033
- Figure 22: South America Liquid Salts And Ionic Liquid Volume Share (%), by Type 2025 & 2033
- Figure 23: South America Liquid Salts And Ionic Liquid Revenue (million), by Country 2025 & 2033
- Figure 24: South America Liquid Salts And Ionic Liquid Volume (K), by Country 2025 & 2033
- Figure 25: South America Liquid Salts And Ionic Liquid Revenue Share (%), by Country 2025 & 2033
- Figure 26: South America Liquid Salts And Ionic Liquid Volume Share (%), by Country 2025 & 2033
- Figure 27: Europe Liquid Salts And Ionic Liquid Revenue (million), by Application 2025 & 2033
- Figure 28: Europe Liquid Salts And Ionic Liquid Volume (K), by Application 2025 & 2033
- Figure 29: Europe Liquid Salts And Ionic Liquid Revenue Share (%), by Application 2025 & 2033
- Figure 30: Europe Liquid Salts And Ionic Liquid Volume Share (%), by Application 2025 & 2033
- Figure 31: Europe Liquid Salts And Ionic Liquid Revenue (million), by Type 2025 & 2033
- Figure 32: Europe Liquid Salts And Ionic Liquid Volume (K), by Type 2025 & 2033
- Figure 33: Europe Liquid Salts And Ionic Liquid Revenue Share (%), by Type 2025 & 2033
- Figure 34: Europe Liquid Salts And Ionic Liquid Volume Share (%), by Type 2025 & 2033
- Figure 35: Europe Liquid Salts And Ionic Liquid Revenue (million), by Country 2025 & 2033
- Figure 36: Europe Liquid Salts And Ionic Liquid Volume (K), by Country 2025 & 2033
- Figure 37: Europe Liquid Salts And Ionic Liquid Revenue Share (%), by Country 2025 & 2033
- Figure 38: Europe Liquid Salts And Ionic Liquid Volume Share (%), by Country 2025 & 2033
- Figure 39: Middle East & Africa Liquid Salts And Ionic Liquid Revenue (million), by Application 2025 & 2033
- Figure 40: Middle East & Africa Liquid Salts And Ionic Liquid Volume (K), by Application 2025 & 2033
- Figure 41: Middle East & Africa Liquid Salts And Ionic Liquid Revenue Share (%), by Application 2025 & 2033
- Figure 42: Middle East & Africa Liquid Salts And Ionic Liquid Volume Share (%), by Application 2025 & 2033
- Figure 43: Middle East & Africa Liquid Salts And Ionic Liquid Revenue (million), by Type 2025 & 2033
- Figure 44: Middle East & Africa Liquid Salts And Ionic Liquid Volume (K), by Type 2025 & 2033
- Figure 45: Middle East & Africa Liquid Salts And Ionic Liquid Revenue Share (%), by Type 2025 & 2033
- Figure 46: Middle East & Africa Liquid Salts And Ionic Liquid Volume Share (%), by Type 2025 & 2033
- Figure 47: Middle East & Africa Liquid Salts And Ionic Liquid Revenue (million), by Country 2025 & 2033
- Figure 48: Middle East & Africa Liquid Salts And Ionic Liquid Volume (K), by Country 2025 & 2033
- Figure 49: Middle East & Africa Liquid Salts And Ionic Liquid Revenue Share (%), by Country 2025 & 2033
- Figure 50: Middle East & Africa Liquid Salts And Ionic Liquid Volume Share (%), by Country 2025 & 2033
- Figure 51: Asia Pacific Liquid Salts And Ionic Liquid Revenue (million), by Application 2025 & 2033
- Figure 52: Asia Pacific Liquid Salts And Ionic Liquid Volume (K), by Application 2025 & 2033
- Figure 53: Asia Pacific Liquid Salts And Ionic Liquid Revenue Share (%), by Application 2025 & 2033
- Figure 54: Asia Pacific Liquid Salts And Ionic Liquid Volume Share (%), by Application 2025 & 2033
- Figure 55: Asia Pacific Liquid Salts And Ionic Liquid Revenue (million), by Type 2025 & 2033
- Figure 56: Asia Pacific Liquid Salts And Ionic Liquid Volume (K), by Type 2025 & 2033
- Figure 57: Asia Pacific Liquid Salts And Ionic Liquid Revenue Share (%), by Type 2025 & 2033
- Figure 58: Asia Pacific Liquid Salts And Ionic Liquid Volume Share (%), by Type 2025 & 2033
- Figure 59: Asia Pacific Liquid Salts And Ionic Liquid Revenue (million), by Country 2025 & 2033
- Figure 60: Asia Pacific Liquid Salts And Ionic Liquid Volume (K), by Country 2025 & 2033
- Figure 61: Asia Pacific Liquid Salts And Ionic Liquid Revenue Share (%), by Country 2025 & 2033
- Figure 62: Asia Pacific Liquid Salts And Ionic Liquid Volume Share (%), by Country 2025 & 2033
List of Tables
- Table 1: Global Liquid Salts And Ionic Liquid Revenue million Forecast, by Application 2020 & 2033
- Table 2: Global Liquid Salts And Ionic Liquid Volume K Forecast, by Application 2020 & 2033
- Table 3: Global Liquid Salts And Ionic Liquid Revenue million Forecast, by Type 2020 & 2033
- Table 4: Global Liquid Salts And Ionic Liquid Volume K Forecast, by Type 2020 & 2033
- Table 5: Global Liquid Salts And Ionic Liquid Revenue million Forecast, by Region 2020 & 2033
- Table 6: Global Liquid Salts And Ionic Liquid Volume K Forecast, by Region 2020 & 2033
- Table 7: Global Liquid Salts And Ionic Liquid Revenue million Forecast, by Application 2020 & 2033
- Table 8: Global Liquid Salts And Ionic Liquid Volume K Forecast, by Application 2020 & 2033
- Table 9: Global Liquid Salts And Ionic Liquid Revenue million Forecast, by Type 2020 & 2033
- Table 10: Global Liquid Salts And Ionic Liquid Volume K Forecast, by Type 2020 & 2033
- Table 11: Global Liquid Salts And Ionic Liquid Revenue million Forecast, by Country 2020 & 2033
- Table 12: Global Liquid Salts And Ionic Liquid Volume K Forecast, by Country 2020 & 2033
- Table 13: United States Liquid Salts And Ionic Liquid Revenue (million) Forecast, by Application 2020 & 2033
- Table 14: United States Liquid Salts And Ionic Liquid Volume (K) Forecast, by Application 2020 & 2033
- Table 15: Canada Liquid Salts And Ionic Liquid Revenue (million) Forecast, by Application 2020 & 2033
- Table 16: Canada Liquid Salts And Ionic Liquid Volume (K) Forecast, by Application 2020 & 2033
- Table 17: Mexico Liquid Salts And Ionic Liquid Revenue (million) Forecast, by Application 2020 & 2033
- Table 18: Mexico Liquid Salts And Ionic Liquid Volume (K) Forecast, by Application 2020 & 2033
- Table 19: Global Liquid Salts And Ionic Liquid Revenue million Forecast, by Application 2020 & 2033
- Table 20: Global Liquid Salts And Ionic Liquid Volume K Forecast, by Application 2020 & 2033
- Table 21: Global Liquid Salts And Ionic Liquid Revenue million Forecast, by Type 2020 & 2033
- Table 22: Global Liquid Salts And Ionic Liquid Volume K Forecast, by Type 2020 & 2033
- Table 23: Global Liquid Salts And Ionic Liquid Revenue million Forecast, by Country 2020 & 2033
- Table 24: Global Liquid Salts And Ionic Liquid Volume K Forecast, by Country 2020 & 2033
- Table 25: Brazil Liquid Salts And Ionic Liquid Revenue (million) Forecast, by Application 2020 & 2033
- Table 26: Brazil Liquid Salts And Ionic Liquid Volume (K) Forecast, by Application 2020 & 2033
- Table 27: Argentina Liquid Salts And Ionic Liquid Revenue (million) Forecast, by Application 2020 & 2033
- Table 28: Argentina Liquid Salts And Ionic Liquid Volume (K) Forecast, by Application 2020 & 2033
- Table 29: Rest of South America Liquid Salts And Ionic Liquid Revenue (million) Forecast, by Application 2020 & 2033
- Table 30: Rest of South America Liquid Salts And Ionic Liquid Volume (K) Forecast, by Application 2020 & 2033
- Table 31: Global Liquid Salts And Ionic Liquid Revenue million Forecast, by Application 2020 & 2033
- Table 32: Global Liquid Salts And Ionic Liquid Volume K Forecast, by Application 2020 & 2033
- Table 33: Global Liquid Salts And Ionic Liquid Revenue million Forecast, by Type 2020 & 2033
- Table 34: Global Liquid Salts And Ionic Liquid Volume K Forecast, by Type 2020 & 2033
- Table 35: Global Liquid Salts And Ionic Liquid Revenue million Forecast, by Country 2020 & 2033
- Table 36: Global Liquid Salts And Ionic Liquid Volume K Forecast, by Country 2020 & 2033
- Table 37: United Kingdom Liquid Salts And Ionic Liquid Revenue (million) Forecast, by Application 2020 & 2033
- Table 38: United Kingdom Liquid Salts And Ionic Liquid Volume (K) Forecast, by Application 2020 & 2033
- Table 39: Germany Liquid Salts And Ionic Liquid Revenue (million) Forecast, by Application 2020 & 2033
- Table 40: Germany Liquid Salts And Ionic Liquid Volume (K) Forecast, by Application 2020 & 2033
- Table 41: France Liquid Salts And Ionic Liquid Revenue (million) Forecast, by Application 2020 & 2033
- Table 42: France Liquid Salts And Ionic Liquid Volume (K) Forecast, by Application 2020 & 2033
- Table 43: Italy Liquid Salts And Ionic Liquid Revenue (million) Forecast, by Application 2020 & 2033
- Table 44: Italy Liquid Salts And Ionic Liquid Volume (K) Forecast, by Application 2020 & 2033
- Table 45: Spain Liquid Salts And Ionic Liquid Revenue (million) Forecast, by Application 2020 & 2033
- Table 46: Spain Liquid Salts And Ionic Liquid Volume (K) Forecast, by Application 2020 & 2033
- Table 47: Russia Liquid Salts And Ionic Liquid Revenue (million) Forecast, by Application 2020 & 2033
- Table 48: Russia Liquid Salts And Ionic Liquid Volume (K) Forecast, by Application 2020 & 2033
- Table 49: Benelux Liquid Salts And Ionic Liquid Revenue (million) Forecast, by Application 2020 & 2033
- Table 50: Benelux Liquid Salts And Ionic Liquid Volume (K) Forecast, by Application 2020 & 2033
- Table 51: Nordics Liquid Salts And Ionic Liquid Revenue (million) Forecast, by Application 2020 & 2033
- Table 52: Nordics Liquid Salts And Ionic Liquid Volume (K) Forecast, by Application 2020 & 2033
- Table 53: Rest of Europe Liquid Salts And Ionic Liquid Revenue (million) Forecast, by Application 2020 & 2033
- Table 54: Rest of Europe Liquid Salts And Ionic Liquid Volume (K) Forecast, by Application 2020 & 2033
- Table 55: Global Liquid Salts And Ionic Liquid Revenue million Forecast, by Application 2020 & 2033
- Table 56: Global Liquid Salts And Ionic Liquid Volume K Forecast, by Application 2020 & 2033
- Table 57: Global Liquid Salts And Ionic Liquid Revenue million Forecast, by Type 2020 & 2033
- Table 58: Global Liquid Salts And Ionic Liquid Volume K Forecast, by Type 2020 & 2033
- Table 59: Global Liquid Salts And Ionic Liquid Revenue million Forecast, by Country 2020 & 2033
- Table 60: Global Liquid Salts And Ionic Liquid Volume K Forecast, by Country 2020 & 2033
- Table 61: Turkey Liquid Salts And Ionic Liquid Revenue (million) Forecast, by Application 2020 & 2033
- Table 62: Turkey Liquid Salts And Ionic Liquid Volume (K) Forecast, by Application 2020 & 2033
- Table 63: Israel Liquid Salts And Ionic Liquid Revenue (million) Forecast, by Application 2020 & 2033
- Table 64: Israel Liquid Salts And Ionic Liquid Volume (K) Forecast, by Application 2020 & 2033
- Table 65: GCC Liquid Salts And Ionic Liquid Revenue (million) Forecast, by Application 2020 & 2033
- Table 66: GCC Liquid Salts And Ionic Liquid Volume (K) Forecast, by Application 2020 & 2033
- Table 67: North Africa Liquid Salts And Ionic Liquid Revenue (million) Forecast, by Application 2020 & 2033
- Table 68: North Africa Liquid Salts And Ionic Liquid Volume (K) Forecast, by Application 2020 & 2033
- Table 69: South Africa Liquid Salts And Ionic Liquid Revenue (million) Forecast, by Application 2020 & 2033
- Table 70: South Africa Liquid Salts And Ionic Liquid Volume (K) Forecast, by Application 2020 & 2033
- Table 71: Rest of Middle East & Africa Liquid Salts And Ionic Liquid Revenue (million) Forecast, by Application 2020 & 2033
- Table 72: Rest of Middle East & Africa Liquid Salts And Ionic Liquid Volume (K) Forecast, by Application 2020 & 2033
- Table 73: Global Liquid Salts And Ionic Liquid Revenue million Forecast, by Application 2020 & 2033
- Table 74: Global Liquid Salts And Ionic Liquid Volume K Forecast, by Application 2020 & 2033
- Table 75: Global Liquid Salts And Ionic Liquid Revenue million Forecast, by Type 2020 & 2033
- Table 76: Global Liquid Salts And Ionic Liquid Volume K Forecast, by Type 2020 & 2033
- Table 77: Global Liquid Salts And Ionic Liquid Revenue million Forecast, by Country 2020 & 2033
- Table 78: Global Liquid Salts And Ionic Liquid Volume K Forecast, by Country 2020 & 2033
- Table 79: China Liquid Salts And Ionic Liquid Revenue (million) Forecast, by Application 2020 & 2033
- Table 80: China Liquid Salts And Ionic Liquid Volume (K) Forecast, by Application 2020 & 2033
- Table 81: India Liquid Salts And Ionic Liquid Revenue (million) Forecast, by Application 2020 & 2033
- Table 82: India Liquid Salts And Ionic Liquid Volume (K) Forecast, by Application 2020 & 2033
- Table 83: Japan Liquid Salts And Ionic Liquid Revenue (million) Forecast, by Application 2020 & 2033
- Table 84: Japan Liquid Salts And Ionic Liquid Volume (K) Forecast, by Application 2020 & 2033
- Table 85: South Korea Liquid Salts And Ionic Liquid Revenue (million) Forecast, by Application 2020 & 2033
- Table 86: South Korea Liquid Salts And Ionic Liquid Volume (K) Forecast, by Application 2020 & 2033
- Table 87: ASEAN Liquid Salts And Ionic Liquid Revenue (million) Forecast, by Application 2020 & 2033
- Table 88: ASEAN Liquid Salts And Ionic Liquid Volume (K) Forecast, by Application 2020 & 2033
- Table 89: Oceania Liquid Salts And Ionic Liquid Revenue (million) Forecast, by Application 2020 & 2033
- Table 90: Oceania Liquid Salts And Ionic Liquid Volume (K) Forecast, by Application 2020 & 2033
- Table 91: Rest of Asia Pacific Liquid Salts And Ionic Liquid Revenue (million) Forecast, by Application 2020 & 2033
- Table 92: Rest of Asia Pacific Liquid Salts And Ionic Liquid Volume (K) Forecast, by Application 2020 & 2033
Frequently Asked Questions
1. What is the projected Compound Annual Growth Rate (CAGR) of the Liquid Salts And Ionic Liquid?
The projected CAGR is approximately 9.4%.
2. Which companies are prominent players in the Liquid Salts And Ionic Liquid?
Key companies in the market include BASF, Evonik Industries, Solvay, Merck, KOEI Chemical, Sanyo Chemical, Proionic, Solvionic, IoLiTec, Zhejiang Lande, Linzhou Keneng, Jinkai Chemical.
3. What are the main segments of the Liquid Salts And Ionic Liquid?
The market segments include Application, Type.
4. Can you provide details about the market size?
The market size is estimated to be USD 267 million as of 2022.
5. What are some drivers contributing to market growth?
N/A
6. What are the notable trends driving market growth?
N/A
7. Are there any restraints impacting market growth?
N/A
8. Can you provide examples of recent developments in the market?
N/A
9. What pricing options are available for accessing the report?
Pricing options include single-user, multi-user, and enterprise licenses priced at USD 3950.00, USD 5925.00, and USD 7900.00 respectively.
10. Is the market size provided in terms of value or volume?
The market size is provided in terms of value, measured in million and volume, measured in K.
11. Are there any specific market keywords associated with the report?
Yes, the market keyword associated with the report is "Liquid Salts And Ionic Liquid," which aids in identifying and referencing the specific market segment covered.
12. How do I determine which pricing option suits my needs best?
The pricing options vary based on user requirements and access needs. Individual users may opt for single-user licenses, while businesses requiring broader access may choose multi-user or enterprise licenses for cost-effective access to the report.
13. Are there any additional resources or data provided in the Liquid Salts And Ionic Liquid report?
While the report offers comprehensive insights, it's advisable to review the specific contents or supplementary materials provided to ascertain if additional resources or data are available.
14. How can I stay updated on further developments or reports in the Liquid Salts And Ionic Liquid?
To stay informed about further developments, trends, and reports in the Liquid Salts And Ionic Liquid, consider subscribing to industry newsletters, following relevant companies and organizations, or regularly checking reputable industry news sources and publications.
Methodology
Step 1 - Identification of Relevant Samples Size from Population Database


Step 2 - Approaches for Defining Global Market Size (Value, Volume* & Price*)

Note*: In applicable scenarios
Step 3 - Data Sources
Primary Research
- Web Analytics
- Survey Reports
- Research Institute
- Latest Research Reports
- Opinion Leaders
Secondary Research
- Annual Reports
- White Paper
- Latest Press Release
- Industry Association
- Paid Database
- Investor Presentations

Step 4 - Data Triangulation
Involves using different sources of information in order to increase the validity of a study
These sources are likely to be stakeholders in a program - participants, other researchers, program staff, other community members, and so on.
Then we put all data in single framework & apply various statistical tools to find out the dynamic on the market.
During the analysis stage, feedback from the stakeholder groups would be compared to determine areas of agreement as well as areas of divergence