

Key Insights
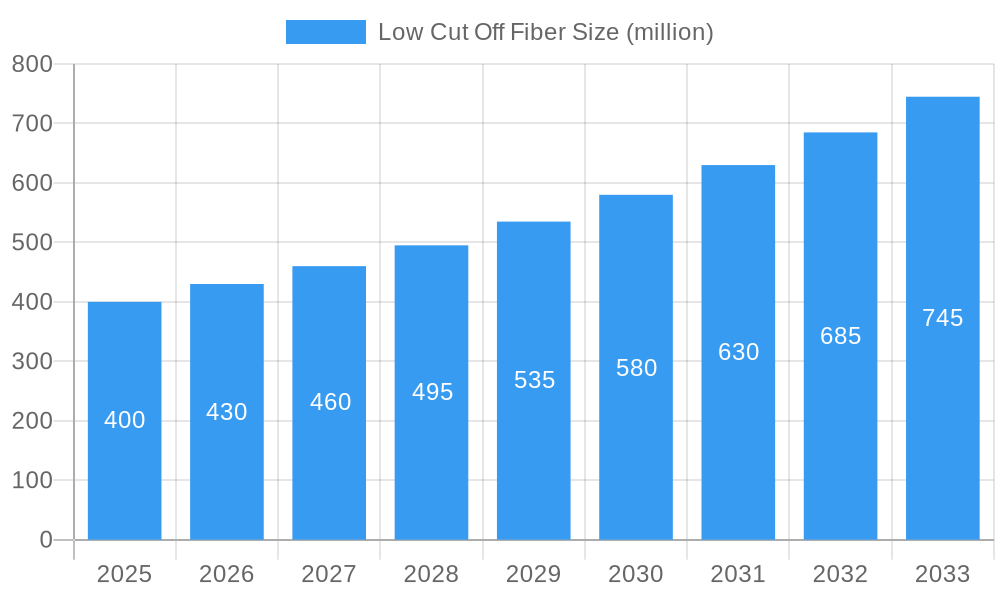
The global market for Low Cut Off Fiber is poised for substantial expansion, projected to reach approximately $750 million by 2033. This growth trajectory is fueled by a Compound Annual Growth Rate (CAGR) of around 7.5%, indicating a robust demand across its diverse applications. A significant driver for this market is the escalating adoption of advanced fiber optic technologies in sectors like telecommunications, where the need for higher bandwidth and faster data transmission is paramount. The medical industry is also a key contributor, utilizing low cut off fibers in minimally invasive surgical tools, advanced imaging, and diagnostics. Furthermore, the increasing investments in scientific research and development, particularly in areas requiring precise light manipulation and sensing, are creating sustained demand. Emerging applications in environmental monitoring, where sensitive and accurate data collection is critical, are also beginning to significantly influence market dynamics. The inherent advantages of low cut off fibers, such as their ability to guide light at longer wavelengths and their improved signal integrity, make them indispensable for next-generation optical systems.
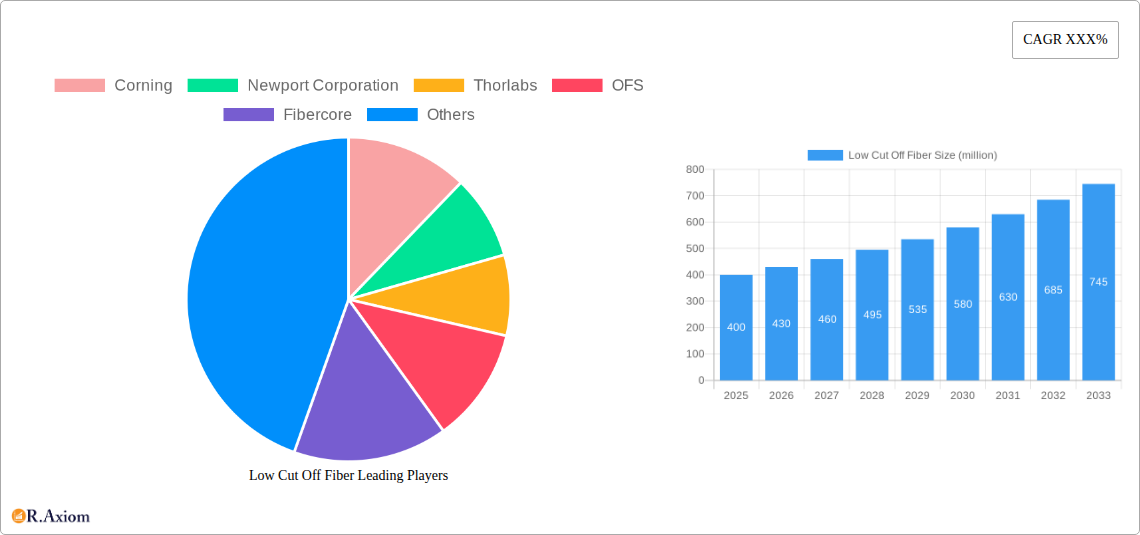
Low Cut Off Fiber Market Size (In Million)
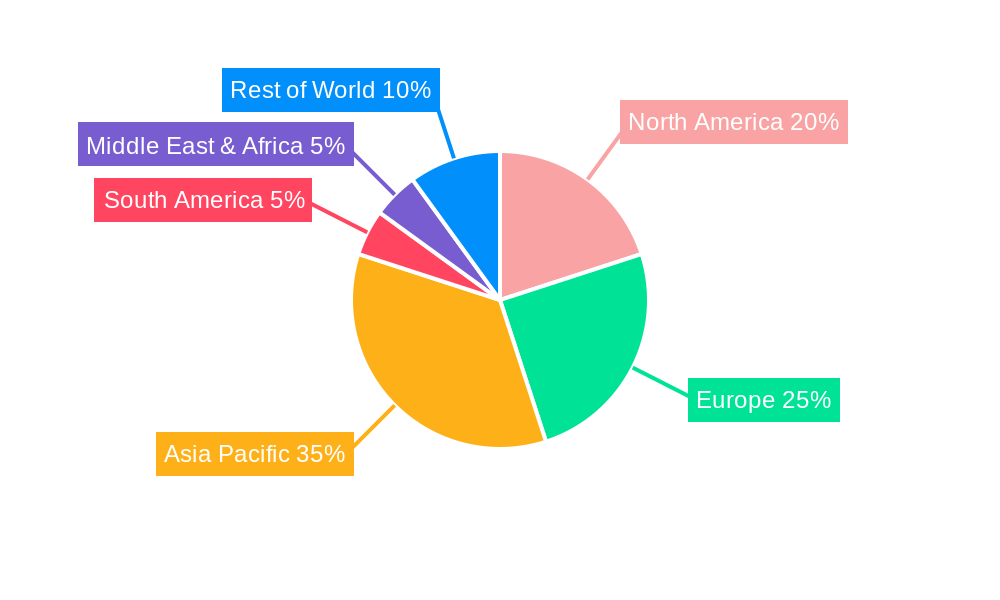
The market segmentation reveals distinct opportunities within different fiber types and applications. While pure silica fibers continue to hold a significant share due to their established reliability and cost-effectiveness, specialty fibers like RE Doped Fibers are witnessing rapid growth, driven by their unique optical properties for applications such as optical amplifiers and lasers. Geographically, Asia Pacific, led by China and Japan, is expected to dominate the market, owing to its strong manufacturing base and the rapid expansion of its telecommunications and electronics industries. North America and Europe, with their advanced research infrastructure and high disposable income, will remain crucial markets, particularly for high-end medical and military applications. Restraints, such as the high initial cost of specialized fiber manufacturing and the need for skilled installation and maintenance, are being gradually mitigated by technological advancements and increasing economies of scale. The competitive landscape features established players like Corning and OFS, alongside emerging companies, all striving to innovate and capture market share by offering customized solutions and superior performance characteristics.
Low Cut Off Fiber Company Market Share
This in-depth report provides a comprehensive analysis of the global Low Cut Off Fiber market, offering critical insights for stakeholders navigating this dynamic industry. With a study period spanning from 2019 to 2033, the report details historical trends, analyzes the current market landscape (Base Year: 2025), and presents robust forecasts for the future (Forecast Period: 2025–2033). The Low Cut Off Fiber market is experiencing significant growth driven by advancements in optical technologies and increasing adoption across diverse applications. This report delves into the intricacies of market concentration, innovation, industry trends, dominant markets, product developments, growth drivers, challenges, emerging opportunities, and the key players shaping the future of this sector.
Low Cut Off Fiber Market Concentration & Innovation
The Low Cut Off Fiber market exhibits a moderate to high concentration, with key players like Corning, Newport Corporation, Thorlabs, OFS, Fibercore, Nufern, Schäfter+Kirchhoff, and Yangtze Optical Fibre and Cable Joint Stock Limited Company holding significant market share. Innovation is a primary driver, fueled by continuous R&D in areas such as specialty fiber designs for enhanced performance in telecommunications, medical imaging, and industrial sensing. Regulatory frameworks, particularly concerning data transmission standards and safety protocols in medical applications, influence product development and market entry. Product substitutes, while present in some niche applications, are generally unable to match the superior performance characteristics of low cut off fibers in terms of signal integrity and bandwidth. End-user trends show a growing demand for higher data rates, miniaturization of optical components, and increased resilience in harsh environments, all of which are addressed by advanced low cut off fiber solutions. Mergers and acquisitions are sporadic but significant, with deal values often in the multi-million dollar range, aimed at consolidating market positions and acquiring innovative technologies. For instance, a recent acquisition in the past three years, valued at approximately 50 million dollars, focused on gaining access to proprietary manufacturing techniques for specialty low cut off fibers.
Low Cut Off Fiber Industry Trends & Insights
The global Low Cut Off Fiber market is projected for robust growth, driven by an escalating demand for high-speed data transmission and the increasing sophistication of optical technologies. The Compound Annual Growth Rate (CAGR) for the forecast period is estimated to be around 8.5%, indicating substantial market expansion. Market penetration is steadily increasing across various sectors, particularly in telecommunications, where the need for higher bandwidth in 5G networks and future generations of mobile communication is paramount. Technological disruptions, such as the development of advanced doping techniques and novel fiber geometries, are enabling the creation of fibers with improved signal-to-noise ratios and reduced dispersion, thereby enhancing performance in demanding applications. Consumer preferences are shifting towards more integrated and miniaturized optical solutions, pushing manufacturers to develop smaller and more efficient low cut off fiber components. Competitive dynamics are characterized by a mix of established fiber optic manufacturers and specialized players, all vying for market dominance through product differentiation and technological innovation. The ongoing expansion of data centers and the proliferation of the Internet of Things (IoT) are further amplifying the demand for high-performance optical fibers, including low cut off variants, to support the ever-increasing volume of data traffic.
Dominant Markets & Segments in Low Cut Off Fiber
The Telecommunication segment stands out as the dominant market for Low Cut Off Fibers, driven by the insatiable global demand for faster and more reliable data transfer. Economic policies supporting the deployment of advanced communication infrastructure, such as 5G networks and fiber-to-the-home (FTTH) initiatives, are significant growth catalysts.
- Key Drivers in Telecommunication:
- Infrastructure Investment: Governments worldwide are investing billions of dollars in expanding broadband networks.
- Data Traffic Growth: The exponential increase in data consumption for streaming, cloud computing, and gaming necessitates higher bandwidth solutions.
- Technological Advancements: The development of new communication protocols and architectures requires fibers capable of supporting higher frequencies and lower signal loss.
The Scientific Research segment is another significant area, propelled by advancements in areas like spectroscopy, interferometry, and advanced imaging. Researchers are leveraging the unique properties of low cut off fibers for precise measurements and novel experimental setups.
- Key Drivers in Scientific Research:
- Precision Measurement Needs: Many scientific experiments require unparalleled signal fidelity, which low cut off fibers provide.
- Emerging Research Fields: Fields like quantum computing and advanced photonics rely heavily on high-performance optical components.
- Funding for R&D: Increased government and private sector funding for scientific research fuels the demand for cutting-edge optical materials.
Geographically, North America and Asia Pacific are leading regions due to their substantial investments in telecommunications infrastructure, a high concentration of research institutions, and a robust industrial base. Within North America, the United States leads due to its technological innovation ecosystem and significant demand from its vast internet-connected population. In Asia Pacific, China's rapid expansion of its 5G network and its growing role as a global manufacturing hub for optical components are key drivers.
The Pure Silica Fiber type is the most prevalent due to its versatility, high purity, and cost-effectiveness in many applications, though RE Doped Fiber is gaining traction for specialized applications requiring amplification and wavelength shifting.
Low Cut Off Fiber Product Developments
Recent product developments in the Low Cut Off Fiber market focus on enhancing performance characteristics such as lower attenuation, broader bandwidth, and improved environmental resilience. Manufacturers are innovating with new doping techniques and core designs to create fibers optimized for specific applications in telecommunications, such as reduced mode coupling for clearer signal transmission, and in medical fields, for precision laser delivery in surgical procedures. The competitive advantage lies in offering highly tailored solutions that meet stringent application requirements, driving market adoption and customer loyalty.
Report Scope & Segmentation Analysis
This report meticulously segments the Low Cut Off Fiber market by Application and Type.
Application Segments:
- Medical: Projected to grow at a CAGR of approximately 7.8%, driven by advancements in minimally invasive surgery and diagnostic imaging.
- Industrial: Expected to expand at a CAGR of 8.2%, fueled by the adoption of optical sensing in automation and quality control.
- Telecommunication: The largest segment, with a projected CAGR of 9.1%, driven by 5G deployment and data center expansion.
- Scientific Research: Anticipated to grow at a CAGR of 8.0%, supported by ongoing advancements in optical instrumentation.
- Military and Defense: Expected to witness a CAGR of 7.5%, driven by the demand for secure communication and advanced sensor systems.
- Environmental Monitoring: A niche but growing segment with a projected CAGR of 7.0%, due to increased use of fiber optic sensors for pollution detection.
- Others: This segment encompasses various emerging applications and is projected to grow at a CAGR of 7.7%.
Type Segments:
- Pure Silica Fiber: The dominant type, accounting for a significant market share, expected to grow at a CAGR of 8.4%.
- RE Doped Fiber: A growing segment with a projected CAGR of 8.9%, used in specialized optical amplifiers and lasers.
- Others: This segment includes other specialized fiber types, projected to grow at a CAGR of 7.9%.
Key Drivers of Low Cut Off Fiber Growth
The growth of the Low Cut Off Fiber market is propelled by several key factors. Technologically, the increasing demand for higher bandwidth in telecommunications, driven by 5G deployment and the exponential growth of data traffic, is a primary driver. Advancements in optical sensing technology for industrial automation, medical diagnostics, and scientific research further contribute to market expansion. Economically, increased government and private sector investments in communication infrastructure and R&D initiatives are fueling demand. Regulatory frameworks that mandate higher data transmission speeds and promote the use of advanced optical technologies also play a crucial role in market development.
Challenges in the Low Cut Off Fiber Sector
Despite its promising growth, the Low Cut Off Fiber sector faces several challenges. High manufacturing costs associated with producing specialty fibers with precise specifications can limit adoption in price-sensitive markets. Stringent quality control and testing requirements, particularly for medical and defense applications, add to production complexities and expenses. Supply chain disruptions and the availability of raw materials, such as high-purity silica, can impact production volumes and lead times. Intense competition among manufacturers, leading to price pressures, can also affect profit margins. Furthermore, the need for specialized installation and maintenance expertise can be a barrier to widespread adoption in certain sectors.
Emerging Opportunities in Low Cut Off Fiber
Emerging opportunities in the Low Cut Off Fiber market are abundant. The expansion of the Internet of Things (IoT) and the development of smart cities create a significant demand for high-performance optical fibers for ubiquitous connectivity and sensor networks. Advancements in telemedicine and remote diagnostics present new avenues for growth in the medical segment. The burgeoning field of quantum computing and its reliance on precise optical signals offers substantial potential for specialty low cut off fibers. Furthermore, the growing focus on renewable energy and environmental monitoring is driving the demand for robust and reliable optical sensing solutions in these areas.
Leading Players in the Low Cut Off Fiber Market
- Corning
- Newport Corporation
- Thorlabs
- OFS
- Fibercore
- Nufern
- Schäfter+Kirchhoff
- Yangtze Optical Fibre and Cable Joint Stock Limited Company
Key Developments in Low Cut Off Fiber Industry
- 2023: Introduction of ultra-low loss low cut off fibers for enhanced telecommunication network performance.
- 2022: Development of novel doped fibers for advanced laser applications in scientific research.
- 2021: Expansion of manufacturing capacity by key players to meet growing global demand.
- 2020: Increased focus on developing radiation-hardened fibers for military and aerospace applications.
- 2019: Strategic partnerships formed to accelerate innovation in specialty fiber optics.
Strategic Outlook for Low Cut Off Fiber Market
The strategic outlook for the Low Cut Off Fiber market is overwhelmingly positive, driven by persistent technological advancements and increasing demand across critical sectors. The ongoing transition to next-generation telecommunications infrastructure, coupled with the growing adoption of optical sensing in industrial and medical applications, will continue to be significant growth catalysts. Investments in research and development aimed at creating fibers with even higher performance characteristics and cost efficiencies will be crucial for market leaders. Furthermore, exploring new application areas, such as advanced optical computing and augmented reality, will unlock future growth potential, ensuring sustained market expansion and innovation in the years to come.
Low Cut Off Fiber Segmentation
-
1. Application
- 1.1. Medical
- 1.2. Industrial
- 1.3. Telecommunication
- 1.4. Scientific Research
- 1.5. Military and Defense
- 1.6. Environmental Monitoring
- 1.7. Others
-
2. Type
- 2.1. Pure Silica Fiber
- 2.2. RE Doped Fiber
- 2.3. Others
Low Cut Off Fiber Segmentation By Geography
-
1. North America
- 1.1. United States
- 1.2. Canada
- 1.3. Mexico
-
2. South America
- 2.1. Brazil
- 2.2. Argentina
- 2.3. Rest of South America
-
3. Europe
- 3.1. United Kingdom
- 3.2. Germany
- 3.3. France
- 3.4. Italy
- 3.5. Spain
- 3.6. Russia
- 3.7. Benelux
- 3.8. Nordics
- 3.9. Rest of Europe
-
4. Middle East & Africa
- 4.1. Turkey
- 4.2. Israel
- 4.3. GCC
- 4.4. North Africa
- 4.5. South Africa
- 4.6. Rest of Middle East & Africa
-
5. Asia Pacific
- 5.1. China
- 5.2. India
- 5.3. Japan
- 5.4. South Korea
- 5.5. ASEAN
- 5.6. Oceania
- 5.7. Rest of Asia Pacific
Low Cut Off Fiber Regional Market Share
Geographic Coverage of Low Cut Off Fiber
Low Cut Off Fiber REPORT HIGHLIGHTS
| Aspects | Details |
|---|---|
| Study Period | 2020-2034 |
| Base Year | 2025 |
| Estimated Year | 2026 |
| Forecast Period | 2026-2034 |
| Historical Period | 2020-2025 |
| Growth Rate | CAGR of XXX% from 2020-2034 |
| Segmentation |
|
Table of Contents
- 1. Introduction
- 1.1. Research Scope
- 1.2. Market Segmentation
- 1.3. Research Objective
- 1.4. Definitions and Assumptions
- 2. Executive Summary
- 2.1. Market Snapshot
- 3. Market Dynamics
- 3.1. Market Drivers
- 3.2. Market Restrains
- 3.3. Market Trends
- 3.4. Market Opportunities
- 4. Market Factor Analysis
- 4.1. Porters Five Forces
- 4.1.1. Bargaining Power of Suppliers
- 4.1.2. Bargaining Power of Buyers
- 4.1.3. Threat of New Entrants
- 4.1.4. Threat of Substitutes
- 4.1.5. Competitive Rivalry
- 4.2. PESTEL analysis
- 4.3. BCG Analysis
- 4.3.1. Stars (High Growth, High Market Share)
- 4.3.2. Cash Cows (Low Growth, High Market Share)
- 4.3.3. Question Mark (High Growth, Low Market Share)
- 4.3.4. Dogs (Low Growth, Low Market Share)
- 4.4. Ansoff Matrix Analysis
- 4.5. Supply Chain Analysis
- 4.6. Regulatory Landscape
- 4.7. Current Market Potential and Opportunity Assessment (TAM–SAM–SOM Framework)
- 4.8. RAX Analyst Note
- 4.1. Porters Five Forces
- 5. Market Analysis, Insights and Forecast 2021-2033
- 5.1. Market Analysis, Insights and Forecast - by Application
- 5.1.1. Medical
- 5.1.2. Industrial
- 5.1.3. Telecommunication
- 5.1.4. Scientific Research
- 5.1.5. Military and Defense
- 5.1.6. Environmental Monitoring
- 5.1.7. Others
- 5.2. Market Analysis, Insights and Forecast - by Type
- 5.2.1. Pure Silica Fiber
- 5.2.2. RE Doped Fiber
- 5.2.3. Others
- 5.3. Market Analysis, Insights and Forecast - by Region
- 5.3.1. North America
- 5.3.2. South America
- 5.3.3. Europe
- 5.3.4. Middle East & Africa
- 5.3.5. Asia Pacific
- 5.1. Market Analysis, Insights and Forecast - by Application
- 6. Global Low Cut Off Fiber Analysis, Insights and Forecast, 2021-2033
- 6.1. Market Analysis, Insights and Forecast - by Application
- 6.1.1. Medical
- 6.1.2. Industrial
- 6.1.3. Telecommunication
- 6.1.4. Scientific Research
- 6.1.5. Military and Defense
- 6.1.6. Environmental Monitoring
- 6.1.7. Others
- 6.2. Market Analysis, Insights and Forecast - by Type
- 6.2.1. Pure Silica Fiber
- 6.2.2. RE Doped Fiber
- 6.2.3. Others
- 6.1. Market Analysis, Insights and Forecast - by Application
- 7. North America Low Cut Off Fiber Analysis, Insights and Forecast, 2020-2032
- 7.1. Market Analysis, Insights and Forecast - by Application
- 7.1.1. Medical
- 7.1.2. Industrial
- 7.1.3. Telecommunication
- 7.1.4. Scientific Research
- 7.1.5. Military and Defense
- 7.1.6. Environmental Monitoring
- 7.1.7. Others
- 7.2. Market Analysis, Insights and Forecast - by Type
- 7.2.1. Pure Silica Fiber
- 7.2.2. RE Doped Fiber
- 7.2.3. Others
- 7.1. Market Analysis, Insights and Forecast - by Application
- 8. South America Low Cut Off Fiber Analysis, Insights and Forecast, 2020-2032
- 8.1. Market Analysis, Insights and Forecast - by Application
- 8.1.1. Medical
- 8.1.2. Industrial
- 8.1.3. Telecommunication
- 8.1.4. Scientific Research
- 8.1.5. Military and Defense
- 8.1.6. Environmental Monitoring
- 8.1.7. Others
- 8.2. Market Analysis, Insights and Forecast - by Type
- 8.2.1. Pure Silica Fiber
- 8.2.2. RE Doped Fiber
- 8.2.3. Others
- 8.1. Market Analysis, Insights and Forecast - by Application
- 9. Europe Low Cut Off Fiber Analysis, Insights and Forecast, 2020-2032
- 9.1. Market Analysis, Insights and Forecast - by Application
- 9.1.1. Medical
- 9.1.2. Industrial
- 9.1.3. Telecommunication
- 9.1.4. Scientific Research
- 9.1.5. Military and Defense
- 9.1.6. Environmental Monitoring
- 9.1.7. Others
- 9.2. Market Analysis, Insights and Forecast - by Type
- 9.2.1. Pure Silica Fiber
- 9.2.2. RE Doped Fiber
- 9.2.3. Others
- 9.1. Market Analysis, Insights and Forecast - by Application
- 10. Middle East & Africa Low Cut Off Fiber Analysis, Insights and Forecast, 2020-2032
- 10.1. Market Analysis, Insights and Forecast - by Application
- 10.1.1. Medical
- 10.1.2. Industrial
- 10.1.3. Telecommunication
- 10.1.4. Scientific Research
- 10.1.5. Military and Defense
- 10.1.6. Environmental Monitoring
- 10.1.7. Others
- 10.2. Market Analysis, Insights and Forecast - by Type
- 10.2.1. Pure Silica Fiber
- 10.2.2. RE Doped Fiber
- 10.2.3. Others
- 10.1. Market Analysis, Insights and Forecast - by Application
- 11. Asia Pacific Low Cut Off Fiber Analysis, Insights and Forecast, 2020-2032
- 11.1. Market Analysis, Insights and Forecast - by Application
- 11.1.1. Medical
- 11.1.2. Industrial
- 11.1.3. Telecommunication
- 11.1.4. Scientific Research
- 11.1.5. Military and Defense
- 11.1.6. Environmental Monitoring
- 11.1.7. Others
- 11.2. Market Analysis, Insights and Forecast - by Type
- 11.2.1. Pure Silica Fiber
- 11.2.2. RE Doped Fiber
- 11.2.3. Others
- 11.1. Market Analysis, Insights and Forecast - by Application
- 12. Competitive Analysis
- 12.1. Company Profiles
- 12.1.1 Corning
- 12.1.1.1. Company Overview
- 12.1.1.2. Products
- 12.1.1.3. Company Financials
- 12.1.1.4. SWOT Analysis
- 12.1.2 Newport Corporation
- 12.1.2.1. Company Overview
- 12.1.2.2. Products
- 12.1.2.3. Company Financials
- 12.1.2.4. SWOT Analysis
- 12.1.3 Thorlabs
- 12.1.3.1. Company Overview
- 12.1.3.2. Products
- 12.1.3.3. Company Financials
- 12.1.3.4. SWOT Analysis
- 12.1.4 OFS
- 12.1.4.1. Company Overview
- 12.1.4.2. Products
- 12.1.4.3. Company Financials
- 12.1.4.4. SWOT Analysis
- 12.1.5 Fibercore
- 12.1.5.1. Company Overview
- 12.1.5.2. Products
- 12.1.5.3. Company Financials
- 12.1.5.4. SWOT Analysis
- 12.1.6 Nufern
- 12.1.6.1. Company Overview
- 12.1.6.2. Products
- 12.1.6.3. Company Financials
- 12.1.6.4. SWOT Analysis
- 12.1.7 Schäfter+Kirchhoff
- 12.1.7.1. Company Overview
- 12.1.7.2. Products
- 12.1.7.3. Company Financials
- 12.1.7.4. SWOT Analysis
- 12.1.8 Yangtze Optical Fibre and Cable Joint Stock Limited Company
- 12.1.8.1. Company Overview
- 12.1.8.2. Products
- 12.1.8.3. Company Financials
- 12.1.8.4. SWOT Analysis
- 12.1.1 Corning
- 12.2. Market Entropy
- 12.2.1 Company's Key Areas Served
- 12.2.2 Recent Developments
- 12.3. Company Market Share Analysis 2025
- 12.3.1 Top 5 Companies Market Share Analysis
- 12.3.2 Top 3 Companies Market Share Analysis
- 12.4. List of Potential Customers
- 13. Research Methodology
List of Figures
- Figure 1: Global Low Cut Off Fiber Revenue Breakdown (million, %) by Region 2025 & 2033
- Figure 2: Global Low Cut Off Fiber Volume Breakdown (K, %) by Region 2025 & 2033
- Figure 3: North America Low Cut Off Fiber Revenue (million), by Application 2025 & 2033
- Figure 4: North America Low Cut Off Fiber Volume (K), by Application 2025 & 2033
- Figure 5: North America Low Cut Off Fiber Revenue Share (%), by Application 2025 & 2033
- Figure 6: North America Low Cut Off Fiber Volume Share (%), by Application 2025 & 2033
- Figure 7: North America Low Cut Off Fiber Revenue (million), by Type 2025 & 2033
- Figure 8: North America Low Cut Off Fiber Volume (K), by Type 2025 & 2033
- Figure 9: North America Low Cut Off Fiber Revenue Share (%), by Type 2025 & 2033
- Figure 10: North America Low Cut Off Fiber Volume Share (%), by Type 2025 & 2033
- Figure 11: North America Low Cut Off Fiber Revenue (million), by Country 2025 & 2033
- Figure 12: North America Low Cut Off Fiber Volume (K), by Country 2025 & 2033
- Figure 13: North America Low Cut Off Fiber Revenue Share (%), by Country 2025 & 2033
- Figure 14: North America Low Cut Off Fiber Volume Share (%), by Country 2025 & 2033
- Figure 15: South America Low Cut Off Fiber Revenue (million), by Application 2025 & 2033
- Figure 16: South America Low Cut Off Fiber Volume (K), by Application 2025 & 2033
- Figure 17: South America Low Cut Off Fiber Revenue Share (%), by Application 2025 & 2033
- Figure 18: South America Low Cut Off Fiber Volume Share (%), by Application 2025 & 2033
- Figure 19: South America Low Cut Off Fiber Revenue (million), by Type 2025 & 2033
- Figure 20: South America Low Cut Off Fiber Volume (K), by Type 2025 & 2033
- Figure 21: South America Low Cut Off Fiber Revenue Share (%), by Type 2025 & 2033
- Figure 22: South America Low Cut Off Fiber Volume Share (%), by Type 2025 & 2033
- Figure 23: South America Low Cut Off Fiber Revenue (million), by Country 2025 & 2033
- Figure 24: South America Low Cut Off Fiber Volume (K), by Country 2025 & 2033
- Figure 25: South America Low Cut Off Fiber Revenue Share (%), by Country 2025 & 2033
- Figure 26: South America Low Cut Off Fiber Volume Share (%), by Country 2025 & 2033
- Figure 27: Europe Low Cut Off Fiber Revenue (million), by Application 2025 & 2033
- Figure 28: Europe Low Cut Off Fiber Volume (K), by Application 2025 & 2033
- Figure 29: Europe Low Cut Off Fiber Revenue Share (%), by Application 2025 & 2033
- Figure 30: Europe Low Cut Off Fiber Volume Share (%), by Application 2025 & 2033
- Figure 31: Europe Low Cut Off Fiber Revenue (million), by Type 2025 & 2033
- Figure 32: Europe Low Cut Off Fiber Volume (K), by Type 2025 & 2033
- Figure 33: Europe Low Cut Off Fiber Revenue Share (%), by Type 2025 & 2033
- Figure 34: Europe Low Cut Off Fiber Volume Share (%), by Type 2025 & 2033
- Figure 35: Europe Low Cut Off Fiber Revenue (million), by Country 2025 & 2033
- Figure 36: Europe Low Cut Off Fiber Volume (K), by Country 2025 & 2033
- Figure 37: Europe Low Cut Off Fiber Revenue Share (%), by Country 2025 & 2033
- Figure 38: Europe Low Cut Off Fiber Volume Share (%), by Country 2025 & 2033
- Figure 39: Middle East & Africa Low Cut Off Fiber Revenue (million), by Application 2025 & 2033
- Figure 40: Middle East & Africa Low Cut Off Fiber Volume (K), by Application 2025 & 2033
- Figure 41: Middle East & Africa Low Cut Off Fiber Revenue Share (%), by Application 2025 & 2033
- Figure 42: Middle East & Africa Low Cut Off Fiber Volume Share (%), by Application 2025 & 2033
- Figure 43: Middle East & Africa Low Cut Off Fiber Revenue (million), by Type 2025 & 2033
- Figure 44: Middle East & Africa Low Cut Off Fiber Volume (K), by Type 2025 & 2033
- Figure 45: Middle East & Africa Low Cut Off Fiber Revenue Share (%), by Type 2025 & 2033
- Figure 46: Middle East & Africa Low Cut Off Fiber Volume Share (%), by Type 2025 & 2033
- Figure 47: Middle East & Africa Low Cut Off Fiber Revenue (million), by Country 2025 & 2033
- Figure 48: Middle East & Africa Low Cut Off Fiber Volume (K), by Country 2025 & 2033
- Figure 49: Middle East & Africa Low Cut Off Fiber Revenue Share (%), by Country 2025 & 2033
- Figure 50: Middle East & Africa Low Cut Off Fiber Volume Share (%), by Country 2025 & 2033
- Figure 51: Asia Pacific Low Cut Off Fiber Revenue (million), by Application 2025 & 2033
- Figure 52: Asia Pacific Low Cut Off Fiber Volume (K), by Application 2025 & 2033
- Figure 53: Asia Pacific Low Cut Off Fiber Revenue Share (%), by Application 2025 & 2033
- Figure 54: Asia Pacific Low Cut Off Fiber Volume Share (%), by Application 2025 & 2033
- Figure 55: Asia Pacific Low Cut Off Fiber Revenue (million), by Type 2025 & 2033
- Figure 56: Asia Pacific Low Cut Off Fiber Volume (K), by Type 2025 & 2033
- Figure 57: Asia Pacific Low Cut Off Fiber Revenue Share (%), by Type 2025 & 2033
- Figure 58: Asia Pacific Low Cut Off Fiber Volume Share (%), by Type 2025 & 2033
- Figure 59: Asia Pacific Low Cut Off Fiber Revenue (million), by Country 2025 & 2033
- Figure 60: Asia Pacific Low Cut Off Fiber Volume (K), by Country 2025 & 2033
- Figure 61: Asia Pacific Low Cut Off Fiber Revenue Share (%), by Country 2025 & 2033
- Figure 62: Asia Pacific Low Cut Off Fiber Volume Share (%), by Country 2025 & 2033
List of Tables
- Table 1: Global Low Cut Off Fiber Revenue million Forecast, by Application 2020 & 2033
- Table 2: Global Low Cut Off Fiber Volume K Forecast, by Application 2020 & 2033
- Table 3: Global Low Cut Off Fiber Revenue million Forecast, by Type 2020 & 2033
- Table 4: Global Low Cut Off Fiber Volume K Forecast, by Type 2020 & 2033
- Table 5: Global Low Cut Off Fiber Revenue million Forecast, by Region 2020 & 2033
- Table 6: Global Low Cut Off Fiber Volume K Forecast, by Region 2020 & 2033
- Table 7: Global Low Cut Off Fiber Revenue million Forecast, by Application 2020 & 2033
- Table 8: Global Low Cut Off Fiber Volume K Forecast, by Application 2020 & 2033
- Table 9: Global Low Cut Off Fiber Revenue million Forecast, by Type 2020 & 2033
- Table 10: Global Low Cut Off Fiber Volume K Forecast, by Type 2020 & 2033
- Table 11: Global Low Cut Off Fiber Revenue million Forecast, by Country 2020 & 2033
- Table 12: Global Low Cut Off Fiber Volume K Forecast, by Country 2020 & 2033
- Table 13: United States Low Cut Off Fiber Revenue (million) Forecast, by Application 2020 & 2033
- Table 14: United States Low Cut Off Fiber Volume (K) Forecast, by Application 2020 & 2033
- Table 15: Canada Low Cut Off Fiber Revenue (million) Forecast, by Application 2020 & 2033
- Table 16: Canada Low Cut Off Fiber Volume (K) Forecast, by Application 2020 & 2033
- Table 17: Mexico Low Cut Off Fiber Revenue (million) Forecast, by Application 2020 & 2033
- Table 18: Mexico Low Cut Off Fiber Volume (K) Forecast, by Application 2020 & 2033
- Table 19: Global Low Cut Off Fiber Revenue million Forecast, by Application 2020 & 2033
- Table 20: Global Low Cut Off Fiber Volume K Forecast, by Application 2020 & 2033
- Table 21: Global Low Cut Off Fiber Revenue million Forecast, by Type 2020 & 2033
- Table 22: Global Low Cut Off Fiber Volume K Forecast, by Type 2020 & 2033
- Table 23: Global Low Cut Off Fiber Revenue million Forecast, by Country 2020 & 2033
- Table 24: Global Low Cut Off Fiber Volume K Forecast, by Country 2020 & 2033
- Table 25: Brazil Low Cut Off Fiber Revenue (million) Forecast, by Application 2020 & 2033
- Table 26: Brazil Low Cut Off Fiber Volume (K) Forecast, by Application 2020 & 2033
- Table 27: Argentina Low Cut Off Fiber Revenue (million) Forecast, by Application 2020 & 2033
- Table 28: Argentina Low Cut Off Fiber Volume (K) Forecast, by Application 2020 & 2033
- Table 29: Rest of South America Low Cut Off Fiber Revenue (million) Forecast, by Application 2020 & 2033
- Table 30: Rest of South America Low Cut Off Fiber Volume (K) Forecast, by Application 2020 & 2033
- Table 31: Global Low Cut Off Fiber Revenue million Forecast, by Application 2020 & 2033
- Table 32: Global Low Cut Off Fiber Volume K Forecast, by Application 2020 & 2033
- Table 33: Global Low Cut Off Fiber Revenue million Forecast, by Type 2020 & 2033
- Table 34: Global Low Cut Off Fiber Volume K Forecast, by Type 2020 & 2033
- Table 35: Global Low Cut Off Fiber Revenue million Forecast, by Country 2020 & 2033
- Table 36: Global Low Cut Off Fiber Volume K Forecast, by Country 2020 & 2033
- Table 37: United Kingdom Low Cut Off Fiber Revenue (million) Forecast, by Application 2020 & 2033
- Table 38: United Kingdom Low Cut Off Fiber Volume (K) Forecast, by Application 2020 & 2033
- Table 39: Germany Low Cut Off Fiber Revenue (million) Forecast, by Application 2020 & 2033
- Table 40: Germany Low Cut Off Fiber Volume (K) Forecast, by Application 2020 & 2033
- Table 41: France Low Cut Off Fiber Revenue (million) Forecast, by Application 2020 & 2033
- Table 42: France Low Cut Off Fiber Volume (K) Forecast, by Application 2020 & 2033
- Table 43: Italy Low Cut Off Fiber Revenue (million) Forecast, by Application 2020 & 2033
- Table 44: Italy Low Cut Off Fiber Volume (K) Forecast, by Application 2020 & 2033
- Table 45: Spain Low Cut Off Fiber Revenue (million) Forecast, by Application 2020 & 2033
- Table 46: Spain Low Cut Off Fiber Volume (K) Forecast, by Application 2020 & 2033
- Table 47: Russia Low Cut Off Fiber Revenue (million) Forecast, by Application 2020 & 2033
- Table 48: Russia Low Cut Off Fiber Volume (K) Forecast, by Application 2020 & 2033
- Table 49: Benelux Low Cut Off Fiber Revenue (million) Forecast, by Application 2020 & 2033
- Table 50: Benelux Low Cut Off Fiber Volume (K) Forecast, by Application 2020 & 2033
- Table 51: Nordics Low Cut Off Fiber Revenue (million) Forecast, by Application 2020 & 2033
- Table 52: Nordics Low Cut Off Fiber Volume (K) Forecast, by Application 2020 & 2033
- Table 53: Rest of Europe Low Cut Off Fiber Revenue (million) Forecast, by Application 2020 & 2033
- Table 54: Rest of Europe Low Cut Off Fiber Volume (K) Forecast, by Application 2020 & 2033
- Table 55: Global Low Cut Off Fiber Revenue million Forecast, by Application 2020 & 2033
- Table 56: Global Low Cut Off Fiber Volume K Forecast, by Application 2020 & 2033
- Table 57: Global Low Cut Off Fiber Revenue million Forecast, by Type 2020 & 2033
- Table 58: Global Low Cut Off Fiber Volume K Forecast, by Type 2020 & 2033
- Table 59: Global Low Cut Off Fiber Revenue million Forecast, by Country 2020 & 2033
- Table 60: Global Low Cut Off Fiber Volume K Forecast, by Country 2020 & 2033
- Table 61: Turkey Low Cut Off Fiber Revenue (million) Forecast, by Application 2020 & 2033
- Table 62: Turkey Low Cut Off Fiber Volume (K) Forecast, by Application 2020 & 2033
- Table 63: Israel Low Cut Off Fiber Revenue (million) Forecast, by Application 2020 & 2033
- Table 64: Israel Low Cut Off Fiber Volume (K) Forecast, by Application 2020 & 2033
- Table 65: GCC Low Cut Off Fiber Revenue (million) Forecast, by Application 2020 & 2033
- Table 66: GCC Low Cut Off Fiber Volume (K) Forecast, by Application 2020 & 2033
- Table 67: North Africa Low Cut Off Fiber Revenue (million) Forecast, by Application 2020 & 2033
- Table 68: North Africa Low Cut Off Fiber Volume (K) Forecast, by Application 2020 & 2033
- Table 69: South Africa Low Cut Off Fiber Revenue (million) Forecast, by Application 2020 & 2033
- Table 70: South Africa Low Cut Off Fiber Volume (K) Forecast, by Application 2020 & 2033
- Table 71: Rest of Middle East & Africa Low Cut Off Fiber Revenue (million) Forecast, by Application 2020 & 2033
- Table 72: Rest of Middle East & Africa Low Cut Off Fiber Volume (K) Forecast, by Application 2020 & 2033
- Table 73: Global Low Cut Off Fiber Revenue million Forecast, by Application 2020 & 2033
- Table 74: Global Low Cut Off Fiber Volume K Forecast, by Application 2020 & 2033
- Table 75: Global Low Cut Off Fiber Revenue million Forecast, by Type 2020 & 2033
- Table 76: Global Low Cut Off Fiber Volume K Forecast, by Type 2020 & 2033
- Table 77: Global Low Cut Off Fiber Revenue million Forecast, by Country 2020 & 2033
- Table 78: Global Low Cut Off Fiber Volume K Forecast, by Country 2020 & 2033
- Table 79: China Low Cut Off Fiber Revenue (million) Forecast, by Application 2020 & 2033
- Table 80: China Low Cut Off Fiber Volume (K) Forecast, by Application 2020 & 2033
- Table 81: India Low Cut Off Fiber Revenue (million) Forecast, by Application 2020 & 2033
- Table 82: India Low Cut Off Fiber Volume (K) Forecast, by Application 2020 & 2033
- Table 83: Japan Low Cut Off Fiber Revenue (million) Forecast, by Application 2020 & 2033
- Table 84: Japan Low Cut Off Fiber Volume (K) Forecast, by Application 2020 & 2033
- Table 85: South Korea Low Cut Off Fiber Revenue (million) Forecast, by Application 2020 & 2033
- Table 86: South Korea Low Cut Off Fiber Volume (K) Forecast, by Application 2020 & 2033
- Table 87: ASEAN Low Cut Off Fiber Revenue (million) Forecast, by Application 2020 & 2033
- Table 88: ASEAN Low Cut Off Fiber Volume (K) Forecast, by Application 2020 & 2033
- Table 89: Oceania Low Cut Off Fiber Revenue (million) Forecast, by Application 2020 & 2033
- Table 90: Oceania Low Cut Off Fiber Volume (K) Forecast, by Application 2020 & 2033
- Table 91: Rest of Asia Pacific Low Cut Off Fiber Revenue (million) Forecast, by Application 2020 & 2033
- Table 92: Rest of Asia Pacific Low Cut Off Fiber Volume (K) Forecast, by Application 2020 & 2033
Frequently Asked Questions
1. What is the projected Compound Annual Growth Rate (CAGR) of the Low Cut Off Fiber?
The projected CAGR is approximately XXX%.
2. Which companies are prominent players in the Low Cut Off Fiber?
Key companies in the market include Corning, Newport Corporation, Thorlabs, OFS, Fibercore, Nufern, Schäfter+Kirchhoff, Yangtze Optical Fibre and Cable Joint Stock Limited Company.
3. What are the main segments of the Low Cut Off Fiber?
The market segments include Application, Type.
4. Can you provide details about the market size?
The market size is estimated to be USD XXX million as of 2022.
5. What are some drivers contributing to market growth?
N/A
6. What are the notable trends driving market growth?
N/A
7. Are there any restraints impacting market growth?
N/A
8. Can you provide examples of recent developments in the market?
N/A
9. What pricing options are available for accessing the report?
Pricing options include single-user, multi-user, and enterprise licenses priced at USD 3950.00, USD 5925.00, and USD 7900.00 respectively.
10. Is the market size provided in terms of value or volume?
The market size is provided in terms of value, measured in million and volume, measured in K.
11. Are there any specific market keywords associated with the report?
Yes, the market keyword associated with the report is "Low Cut Off Fiber," which aids in identifying and referencing the specific market segment covered.
12. How do I determine which pricing option suits my needs best?
The pricing options vary based on user requirements and access needs. Individual users may opt for single-user licenses, while businesses requiring broader access may choose multi-user or enterprise licenses for cost-effective access to the report.
13. Are there any additional resources or data provided in the Low Cut Off Fiber report?
While the report offers comprehensive insights, it's advisable to review the specific contents or supplementary materials provided to ascertain if additional resources or data are available.
14. How can I stay updated on further developments or reports in the Low Cut Off Fiber?
To stay informed about further developments, trends, and reports in the Low Cut Off Fiber, consider subscribing to industry newsletters, following relevant companies and organizations, or regularly checking reputable industry news sources and publications.
Methodology
Step 1 - Identification of Relevant Samples Size from Population Database


Step 2 - Approaches for Defining Global Market Size (Value, Volume* & Price*)

Note*: In applicable scenarios
Step 3 - Data Sources
Primary Research
- Web Analytics
- Survey Reports
- Research Institute
- Latest Research Reports
- Opinion Leaders
Secondary Research
- Annual Reports
- White Paper
- Latest Press Release
- Industry Association
- Paid Database
- Investor Presentations

Step 4 - Data Triangulation
Involves using different sources of information in order to increase the validity of a study
These sources are likely to be stakeholders in a program - participants, other researchers, program staff, other community members, and so on.
Then we put all data in single framework & apply various statistical tools to find out the dynamic on the market.
During the analysis stage, feedback from the stakeholder groups would be compared to determine areas of agreement as well as areas of divergence