Key Insights
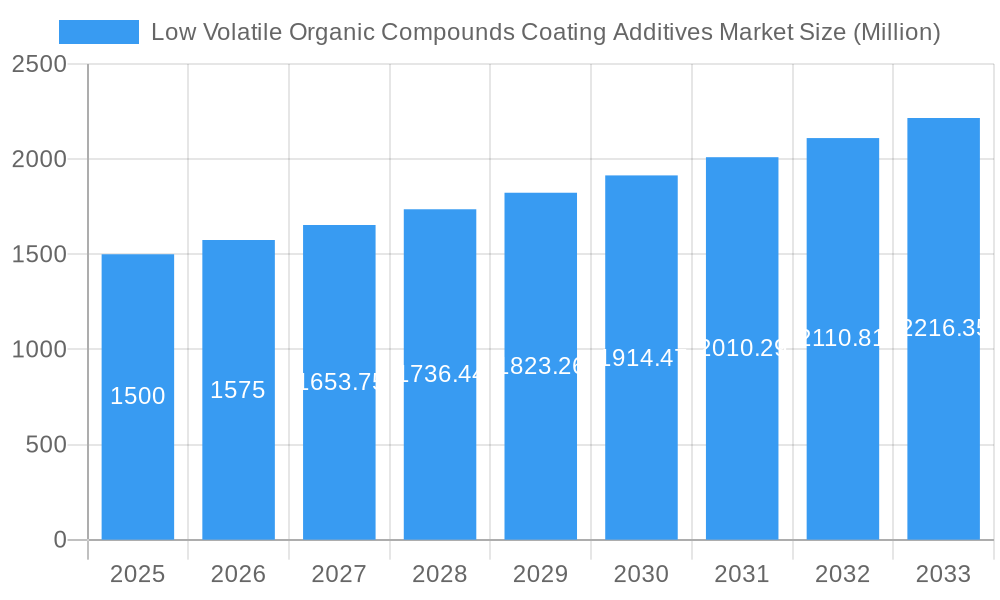
The global Low Volatile Organic Compounds (VOC) Coating Additives market is poised for significant expansion, driven by escalating environmental mandates and a global push for sustainable coating solutions. With an estimated market size of $9.45 billion in the base year 2025, the market is projected to achieve a Compound Annual Growth Rate (CAGR) of 13.16%. This robust growth is underpinned by increasing adoption in pivotal sectors including building and construction, driven by infrastructure expansion and renovation; automotive, influenced by stringent emission standards and the rise of eco-friendly vehicles; and aerospace, requiring advanced, lightweight coatings. Technological advancements in additive performance, such as enhanced durability, superior adhesion, and reduced application energy, further bolster market momentum. Key additive segments, including defoamers, dispersants, wetting agents, and rheology modifiers, collectively contribute to the market's dynamic growth trajectory.
Low Volatile Organic Compounds Coating Additives Market Market Size (In Billion)
Geographically, while North America and Europe currently lead market share, the Asia-Pacific region, particularly China and India, exhibits the most rapid growth due to accelerated industrialization and construction. This presents substantial opportunities for market participants. Potential challenges include raw material price volatility and the complexities of developing and deploying novel sustainable additive technologies. The competitive landscape is dynamic, featuring major players like BASF, Dow, and Solvay alongside specialized manufacturers. Strategic alliances, mergers, and acquisitions are anticipated to redefine the competitive environment, fostering innovation and consolidation within the Low VOC Coating Additives market.
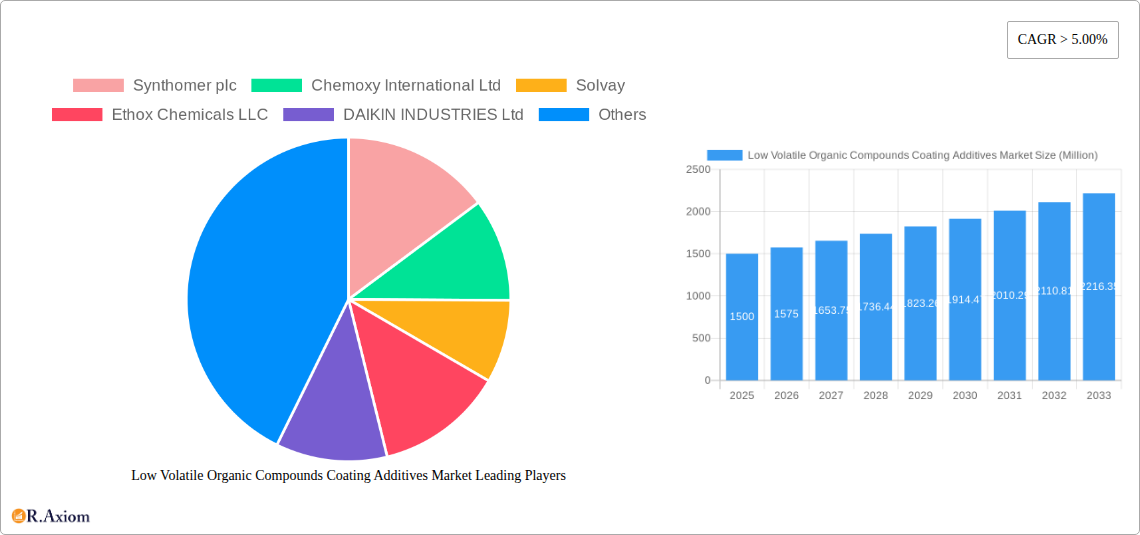
Low Volatile Organic Compounds Coating Additives Market Company Market Share
Low Volatile Organic Compounds (VOC) Coating Additives Market: A Comprehensive Report (2019-2033)
This comprehensive report provides an in-depth analysis of the Low Volatile Organic Compounds (VOC) Coating Additives market, offering valuable insights for industry stakeholders, investors, and market entrants. Covering the period from 2019 to 2033, with 2025 as the base year and a forecast period of 2025-2033, this report meticulously examines market trends, competitive dynamics, and growth opportunities. The report leverages rigorous data analysis and expert insights to provide actionable recommendations for navigating this evolving market landscape. The market is segmented by product type (Defoamers, Dispersants, Wetting Agents, Rheology Modifiers, Others) and end-user industry (Building and Construction, Automotive, Aerospace, Furniture, Others). Key players profiled include Synthomer plc, Chemoxy International Ltd, Solvay, Ethox Chemicals LLC, DAIKIN INDUSTRIES Ltd, Croda International Plc, BASF SE, SEQENS, Dow, Eastman Chemical Company, The Lubrizol Corporation, Axalta Coating Systems LLC, Evonik AG, Emerald Kalama Chemical, Borchers Inc, and Matthews Paint. The report projects a market value of XX Million by 2033, exhibiting a CAGR of XX% during the forecast period.
Low Volatile Organic Compounds Coating Additives Market Concentration & Innovation
The Low VOC Coating Additives market exhibits a moderately concentrated landscape, with a few dominant players holding significant market share. For example, BASF SE and Dow collectively account for approximately XX% of the global market share in 2025 (estimated). However, the market also features several smaller, specialized players catering to niche segments. Innovation is a key driver, fueled by stringent environmental regulations promoting the adoption of low-VOC alternatives.
- Innovation Drivers: Stringent environmental regulations, increasing demand for sustainable coatings, advancements in additive chemistry, and the development of high-performance, low-VOC additives.
- Regulatory Frameworks: The market is significantly influenced by evolving environmental regulations globally, particularly concerning VOC emissions in various end-use industries. Compliance necessitates ongoing innovation and the development of compliant products.
- Product Substitutes: While few direct substitutes exist, manufacturers continually explore alternative chemistries and formulations to enhance performance and reduce environmental impact. Bio-based additives represent a growing area of interest.
- End-User Trends: Growing demand for sustainable and eco-friendly building materials, vehicles, and furniture is a significant driver of market growth, pushing for the adoption of low-VOC coating additives.
- M&A Activities: The market has witnessed several mergers and acquisitions in recent years (XX deals valued at approximately XX Million in the period 2019-2024). These activities reflect the consolidation trend and the drive for technological expansion.
Low Volatile Organic Compounds Coating Additives Market Industry Trends & Insights
The Low VOC Coating Additives market is experiencing robust growth, driven by several key factors. The rising demand for sustainable and environmentally friendly coatings across diverse industries is a major catalyst. Technological advancements, particularly in the development of high-performance, low-VOC additives, are significantly contributing to market expansion. Consumer preference for environmentally conscious products further fuels this growth. The market is witnessing increasing adoption of water-based and UV-curable coating systems, which inherently reduce VOC emissions. The building and construction sector presents the most significant growth opportunity, driven by substantial infrastructural investments and growing urbanization. The market is also expected to benefit from technological innovations in additive chemistry, enabling the development of more efficient and cost-effective low-VOC solutions. This is expected to result in a market value of XX Million by 2033, with a CAGR of approximately XX% during the forecast period (2025-2033). Competitive intensity is moderate, with both established players and emerging companies striving for market share.
Dominant Markets & Segments in Low Volatile Organic Compounds Coating Additives Market
The Building and Construction sector represents the largest end-user segment, accounting for an estimated XX% of the market share in 2025. This is driven by significant infrastructural development projects worldwide and the increasing demand for sustainable building materials. Among product types, Rheology Modifiers currently hold the largest market share, attributed to their critical role in enhancing the flow and application properties of coatings.
Key Drivers for Building and Construction Segment:
- Stringent environmental regulations promoting low-VOC materials.
- Growing investments in infrastructure development, particularly in emerging economies.
- Increasing urbanization and construction activities.
Dominance Analysis:
The North American region currently dominates the global market, primarily due to stringent environmental regulations and substantial investments in the construction sector. However, the Asia-Pacific region is projected to experience the highest growth rate during the forecast period, driven by rapid urbanization and industrialization.
Low Volatile Organic Compounds Coating Additives Market Product Developments
Recent advancements in low-VOC coating additives focus on enhancing performance characteristics without compromising environmental compliance. Innovations include the development of bio-based additives, utilizing renewable resources to minimize environmental impact. These new additives offer improved performance, such as enhanced durability, scratch resistance, and UV protection, while maintaining low-VOC levels. This creates significant competitive advantages for manufacturers offering superior and sustainable products that meet evolving market demands.
Report Scope & Segmentation Analysis
This report comprehensively analyzes the Low VOC Coating Additives market based on the following segmentations:
Product Type: Defoamers, Dispersants, Wetting Agents, Rheology Modifiers, Others. Each segment's growth is projected based on its unique characteristics and market dynamics. Rheology modifiers are estimated to grow at XX% CAGR.
End-user Industry: Building and Construction, Automotive, Aerospace, Furniture, Others. The Building and Construction segment is expected to exhibit the highest growth, driven by robust infrastructure development and the adoption of sustainable building practices. The automotive segment is expected to witness moderate growth influenced by increasingly stringent emission regulations.
Each segment's analysis includes market size, growth projections, and competitive dynamics.
Key Drivers of Low Volatile Organic Compounds Coating Additives Market Growth
Several factors contribute to the market's growth:
- Stringent Environmental Regulations: Government regulations worldwide limit VOC emissions, driving the demand for low-VOC alternatives.
- Growing Demand for Sustainable Coatings: Increasing consumer awareness of environmental issues pushes for eco-friendly products.
- Technological Advancements: Innovations in additive chemistry are leading to high-performance, low-VOC solutions.
- Infrastructure Development: Significant investment in infrastructure projects globally fuels demand for coatings and related additives.
Challenges in the Low Volatile Organic Compounds Coating Additives Market Sector
The market faces several challenges:
- High Raw Material Costs: Fluctuations in raw material prices can affect profitability.
- Complex Regulatory Landscape: Meeting various regulatory requirements in different regions is complex.
- Competition: Intense competition from established and emerging players requires continuous innovation.
Emerging Opportunities in Low Volatile Organic Compounds Coating Additives Market
Significant opportunities exist in:
- Bio-based Additives: The growing interest in sustainable materials presents a large opportunity for bio-based alternatives.
- Water-based and UV-curable Coatings: These technologies are gaining traction due to their low-VOC nature.
- Emerging Markets: Rapid industrialization and urbanization in developing economies create significant demand potential.
Leading Players in the Low Volatile Organic Compounds Coating Additives Market Market
Key Developments in Low Volatile Organic Compounds Coating Additives Market Industry
- January 2023: BASF SE launched a new range of low-VOC rheology modifiers.
- June 2022: Dow and Solvay announced a joint venture to develop bio-based coating additives.
- November 2021: Evonik AG acquired a smaller specialty chemical company specializing in low-VOC disperants. (Further details on acquisitions and launch dates are required for more accurate reporting. Use this as a template to insert your data).
Strategic Outlook for Low Volatile Organic Compounds Coating Additives Market Market
The Low VOC Coating Additives market is poised for continued growth, driven by increasing environmental awareness and technological advancements. The shift towards sustainable solutions, coupled with the growing demand from key end-use industries, will create significant opportunities for market players. Strategic investments in research and development, along with collaborations and partnerships to expand product portfolios, will be crucial for success in this dynamic market. The market's future success hinges on providing high-performance, cost-effective, and environmentally responsible solutions that cater to the evolving needs of a sustainability-conscious world.
Low Volatile Organic Compounds Coating Additives Market Segmentation
-
1. Product Type
- 1.1. Defoamers
- 1.2. Dispersants
- 1.3. Wetting Agents
- 1.4. Rheology Modifiers
- 1.5. Others
-
2. End-user Industry
- 2.1. Building and Construction
- 2.2. Automotive
- 2.3. Aerospace
- 2.4. Furniture
- 2.5. Others
Low Volatile Organic Compounds Coating Additives Market Segmentation By Geography
-
1. Asia Pacific
- 1.1. China
- 1.2. India
- 1.3. Japan
- 1.4. South Korea
- 1.5. Rest of Asia Pacific
-
2. North America
- 2.1. United States
- 2.2. Canada
- 2.3. Mexico
-
3. Europe
- 3.1. Germany
- 3.2. United Kingdom
- 3.3. France
- 3.4. Italy
- 3.5. Rest of Europe
-
4. South America
- 4.1. Brazil
- 4.2. Argentina
- 4.3. Rest of South America
-
5. Middle East and Africa
- 5.1. Saudi Arabia
- 5.2. South Africa
- 5.3. Rest of Middle East and Africa
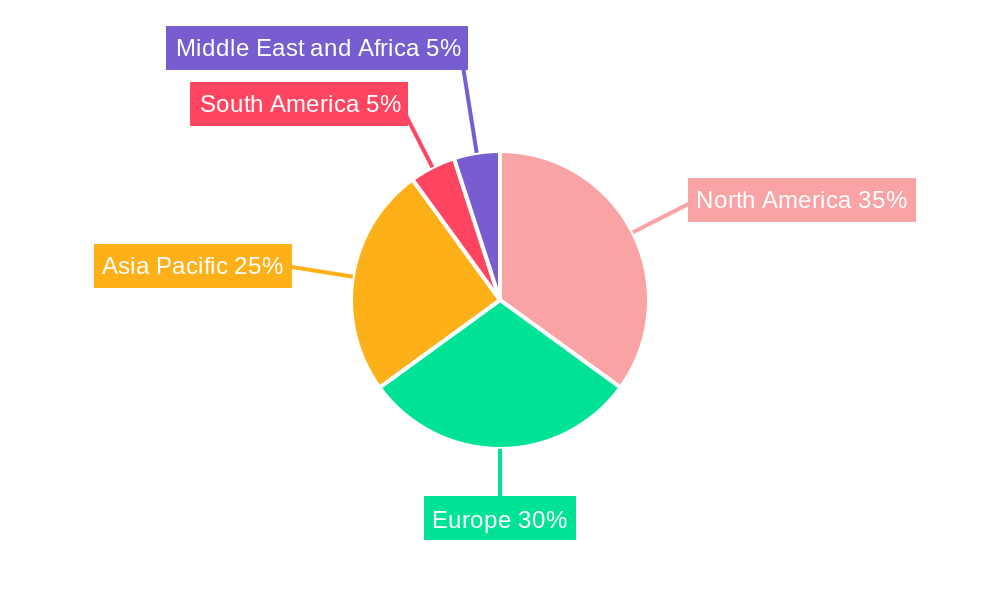
Low Volatile Organic Compounds Coating Additives Market Regional Market Share
Geographic Coverage of Low Volatile Organic Compounds Coating Additives Market
Low Volatile Organic Compounds Coating Additives Market REPORT HIGHLIGHTS
| Aspects | Details |
|---|---|
| Study Period | 2020-2034 |
| Base Year | 2025 |
| Estimated Year | 2026 |
| Forecast Period | 2026-2034 |
| Historical Period | 2020-2025 |
| Growth Rate | CAGR of 13.16% from 2020-2034 |
| Segmentation |
|
Table of Contents
- 1. Introduction
- 1.1. Research Scope
- 1.2. Market Segmentation
- 1.3. Research Objective
- 1.4. Definitions and Assumptions
- 2. Executive Summary
- 2.1. Market Snapshot
- 3. Market Dynamics
- 3.1. Market Drivers
- 3.2. Market Restrains
- 3.3. Market Trends
- 3.4. Market Opportunities
- 4. Market Factor Analysis
- 4.1. Porters Five Forces
- 4.1.1. Bargaining Power of Suppliers
- 4.1.2. Bargaining Power of Buyers
- 4.1.3. Threat of New Entrants
- 4.1.4. Threat of Substitutes
- 4.1.5. Competitive Rivalry
- 4.2. PESTEL analysis
- 4.3. BCG Analysis
- 4.3.1. Stars (High Growth, High Market Share)
- 4.3.2. Cash Cows (Low Growth, High Market Share)
- 4.3.3. Question Mark (High Growth, Low Market Share)
- 4.3.4. Dogs (Low Growth, Low Market Share)
- 4.4. Ansoff Matrix Analysis
- 4.5. Supply Chain Analysis
- 4.6. Regulatory Landscape
- 4.7. Current Market Potential and Opportunity Assessment (TAM–SAM–SOM Framework)
- 4.8. RAX Analyst Note
- 4.1. Porters Five Forces
- 5. Market Analysis, Insights and Forecast 2021-2033
- 5.1. Market Analysis, Insights and Forecast - by Product Type
- 5.1.1. Defoamers
- 5.1.2. Dispersants
- 5.1.3. Wetting Agents
- 5.1.4. Rheology Modifiers
- 5.1.5. Others
- 5.2. Market Analysis, Insights and Forecast - by End-user Industry
- 5.2.1. Building and Construction
- 5.2.2. Automotive
- 5.2.3. Aerospace
- 5.2.4. Furniture
- 5.2.5. Others
- 5.3. Market Analysis, Insights and Forecast - by Region
- 5.3.1. Asia Pacific
- 5.3.2. North America
- 5.3.3. Europe
- 5.3.4. South America
- 5.3.5. Middle East and Africa
- 5.1. Market Analysis, Insights and Forecast - by Product Type
- 6. Global Low Volatile Organic Compounds Coating Additives Market Analysis, Insights and Forecast, 2021-2033
- 6.1. Market Analysis, Insights and Forecast - by Product Type
- 6.1.1. Defoamers
- 6.1.2. Dispersants
- 6.1.3. Wetting Agents
- 6.1.4. Rheology Modifiers
- 6.1.5. Others
- 6.2. Market Analysis, Insights and Forecast - by End-user Industry
- 6.2.1. Building and Construction
- 6.2.2. Automotive
- 6.2.3. Aerospace
- 6.2.4. Furniture
- 6.2.5. Others
- 6.1. Market Analysis, Insights and Forecast - by Product Type
- 7. Asia Pacific Low Volatile Organic Compounds Coating Additives Market Analysis, Insights and Forecast, 2020-2032
- 7.1. Market Analysis, Insights and Forecast - by Product Type
- 7.1.1. Defoamers
- 7.1.2. Dispersants
- 7.1.3. Wetting Agents
- 7.1.4. Rheology Modifiers
- 7.1.5. Others
- 7.2. Market Analysis, Insights and Forecast - by End-user Industry
- 7.2.1. Building and Construction
- 7.2.2. Automotive
- 7.2.3. Aerospace
- 7.2.4. Furniture
- 7.2.5. Others
- 7.1. Market Analysis, Insights and Forecast - by Product Type
- 8. North America Low Volatile Organic Compounds Coating Additives Market Analysis, Insights and Forecast, 2020-2032
- 8.1. Market Analysis, Insights and Forecast - by Product Type
- 8.1.1. Defoamers
- 8.1.2. Dispersants
- 8.1.3. Wetting Agents
- 8.1.4. Rheology Modifiers
- 8.1.5. Others
- 8.2. Market Analysis, Insights and Forecast - by End-user Industry
- 8.2.1. Building and Construction
- 8.2.2. Automotive
- 8.2.3. Aerospace
- 8.2.4. Furniture
- 8.2.5. Others
- 8.1. Market Analysis, Insights and Forecast - by Product Type
- 9. Europe Low Volatile Organic Compounds Coating Additives Market Analysis, Insights and Forecast, 2020-2032
- 9.1. Market Analysis, Insights and Forecast - by Product Type
- 9.1.1. Defoamers
- 9.1.2. Dispersants
- 9.1.3. Wetting Agents
- 9.1.4. Rheology Modifiers
- 9.1.5. Others
- 9.2. Market Analysis, Insights and Forecast - by End-user Industry
- 9.2.1. Building and Construction
- 9.2.2. Automotive
- 9.2.3. Aerospace
- 9.2.4. Furniture
- 9.2.5. Others
- 9.1. Market Analysis, Insights and Forecast - by Product Type
- 10. South America Low Volatile Organic Compounds Coating Additives Market Analysis, Insights and Forecast, 2020-2032
- 10.1. Market Analysis, Insights and Forecast - by Product Type
- 10.1.1. Defoamers
- 10.1.2. Dispersants
- 10.1.3. Wetting Agents
- 10.1.4. Rheology Modifiers
- 10.1.5. Others
- 10.2. Market Analysis, Insights and Forecast - by End-user Industry
- 10.2.1. Building and Construction
- 10.2.2. Automotive
- 10.2.3. Aerospace
- 10.2.4. Furniture
- 10.2.5. Others
- 10.1. Market Analysis, Insights and Forecast - by Product Type
- 11. Middle East and Africa Low Volatile Organic Compounds Coating Additives Market Analysis, Insights and Forecast, 2020-2032
- 11.1. Market Analysis, Insights and Forecast - by Product Type
- 11.1.1. Defoamers
- 11.1.2. Dispersants
- 11.1.3. Wetting Agents
- 11.1.4. Rheology Modifiers
- 11.1.5. Others
- 11.2. Market Analysis, Insights and Forecast - by End-user Industry
- 11.2.1. Building and Construction
- 11.2.2. Automotive
- 11.2.3. Aerospace
- 11.2.4. Furniture
- 11.2.5. Others
- 11.1. Market Analysis, Insights and Forecast - by Product Type
- 12. Competitive Analysis
- 12.1. Company Profiles
- 12.1.1 Synthomer plc
- 12.1.1.1. Company Overview
- 12.1.1.2. Products
- 12.1.1.3. Company Financials
- 12.1.1.4. SWOT Analysis
- 12.1.2 Chemoxy International Ltd
- 12.1.2.1. Company Overview
- 12.1.2.2. Products
- 12.1.2.3. Company Financials
- 12.1.2.4. SWOT Analysis
- 12.1.3 Solvay
- 12.1.3.1. Company Overview
- 12.1.3.2. Products
- 12.1.3.3. Company Financials
- 12.1.3.4. SWOT Analysis
- 12.1.4 Ethox Chemicals LLC
- 12.1.4.1. Company Overview
- 12.1.4.2. Products
- 12.1.4.3. Company Financials
- 12.1.4.4. SWOT Analysis
- 12.1.5 DAIKIN INDUSTRIES Ltd
- 12.1.5.1. Company Overview
- 12.1.5.2. Products
- 12.1.5.3. Company Financials
- 12.1.5.4. SWOT Analysis
- 12.1.6 Croda International Plc
- 12.1.6.1. Company Overview
- 12.1.6.2. Products
- 12.1.6.3. Company Financials
- 12.1.6.4. SWOT Analysis
- 12.1.7 BASF SE
- 12.1.7.1. Company Overview
- 12.1.7.2. Products
- 12.1.7.3. Company Financials
- 12.1.7.4. SWOT Analysis
- 12.1.8 SEQENS
- 12.1.8.1. Company Overview
- 12.1.8.2. Products
- 12.1.8.3. Company Financials
- 12.1.8.4. SWOT Analysis
- 12.1.9 Dow
- 12.1.9.1. Company Overview
- 12.1.9.2. Products
- 12.1.9.3. Company Financials
- 12.1.9.4. SWOT Analysis
- 12.1.10 Eastman Chemical Company
- 12.1.10.1. Company Overview
- 12.1.10.2. Products
- 12.1.10.3. Company Financials
- 12.1.10.4. SWOT Analysis
- 12.1.11 The Lubrizol Corporation
- 12.1.11.1. Company Overview
- 12.1.11.2. Products
- 12.1.11.3. Company Financials
- 12.1.11.4. SWOT Analysis
- 12.1.12 Axalta Coating Systems LLC
- 12.1.12.1. Company Overview
- 12.1.12.2. Products
- 12.1.12.3. Company Financials
- 12.1.12.4. SWOT Analysis
- 12.1.13 Evonik AG
- 12.1.13.1. Company Overview
- 12.1.13.2. Products
- 12.1.13.3. Company Financials
- 12.1.13.4. SWOT Analysis
- 12.1.14 Emerald Kalama Chemical
- 12.1.14.1. Company Overview
- 12.1.14.2. Products
- 12.1.14.3. Company Financials
- 12.1.14.4. SWOT Analysis
- 12.1.15 Borchers Inc
- 12.1.15.1. Company Overview
- 12.1.15.2. Products
- 12.1.15.3. Company Financials
- 12.1.15.4. SWOT Analysis
- 12.1.16 Matthews Paint
- 12.1.16.1. Company Overview
- 12.1.16.2. Products
- 12.1.16.3. Company Financials
- 12.1.16.4. SWOT Analysis
- 12.1.1 Synthomer plc
- 12.2. Market Entropy
- 12.2.1 Company's Key Areas Served
- 12.2.2 Recent Developments
- 12.3. Company Market Share Analysis 2025
- 12.3.1 Top 5 Companies Market Share Analysis
- 12.3.2 Top 3 Companies Market Share Analysis
- 12.4. List of Potential Customers
- 13. Research Methodology
List of Figures
- Figure 1: Global Low Volatile Organic Compounds Coating Additives Market Revenue Breakdown (billion, %) by Region 2025 & 2033
- Figure 2: Global Low Volatile Organic Compounds Coating Additives Market Volume Breakdown (K Tons, %) by Region 2025 & 2033
- Figure 3: Asia Pacific Low Volatile Organic Compounds Coating Additives Market Revenue (billion), by Product Type 2025 & 2033
- Figure 4: Asia Pacific Low Volatile Organic Compounds Coating Additives Market Volume (K Tons), by Product Type 2025 & 2033
- Figure 5: Asia Pacific Low Volatile Organic Compounds Coating Additives Market Revenue Share (%), by Product Type 2025 & 2033
- Figure 6: Asia Pacific Low Volatile Organic Compounds Coating Additives Market Volume Share (%), by Product Type 2025 & 2033
- Figure 7: Asia Pacific Low Volatile Organic Compounds Coating Additives Market Revenue (billion), by End-user Industry 2025 & 2033
- Figure 8: Asia Pacific Low Volatile Organic Compounds Coating Additives Market Volume (K Tons), by End-user Industry 2025 & 2033
- Figure 9: Asia Pacific Low Volatile Organic Compounds Coating Additives Market Revenue Share (%), by End-user Industry 2025 & 2033
- Figure 10: Asia Pacific Low Volatile Organic Compounds Coating Additives Market Volume Share (%), by End-user Industry 2025 & 2033
- Figure 11: Asia Pacific Low Volatile Organic Compounds Coating Additives Market Revenue (billion), by Country 2025 & 2033
- Figure 12: Asia Pacific Low Volatile Organic Compounds Coating Additives Market Volume (K Tons), by Country 2025 & 2033
- Figure 13: Asia Pacific Low Volatile Organic Compounds Coating Additives Market Revenue Share (%), by Country 2025 & 2033
- Figure 14: Asia Pacific Low Volatile Organic Compounds Coating Additives Market Volume Share (%), by Country 2025 & 2033
- Figure 15: North America Low Volatile Organic Compounds Coating Additives Market Revenue (billion), by Product Type 2025 & 2033
- Figure 16: North America Low Volatile Organic Compounds Coating Additives Market Volume (K Tons), by Product Type 2025 & 2033
- Figure 17: North America Low Volatile Organic Compounds Coating Additives Market Revenue Share (%), by Product Type 2025 & 2033
- Figure 18: North America Low Volatile Organic Compounds Coating Additives Market Volume Share (%), by Product Type 2025 & 2033
- Figure 19: North America Low Volatile Organic Compounds Coating Additives Market Revenue (billion), by End-user Industry 2025 & 2033
- Figure 20: North America Low Volatile Organic Compounds Coating Additives Market Volume (K Tons), by End-user Industry 2025 & 2033
- Figure 21: North America Low Volatile Organic Compounds Coating Additives Market Revenue Share (%), by End-user Industry 2025 & 2033
- Figure 22: North America Low Volatile Organic Compounds Coating Additives Market Volume Share (%), by End-user Industry 2025 & 2033
- Figure 23: North America Low Volatile Organic Compounds Coating Additives Market Revenue (billion), by Country 2025 & 2033
- Figure 24: North America Low Volatile Organic Compounds Coating Additives Market Volume (K Tons), by Country 2025 & 2033
- Figure 25: North America Low Volatile Organic Compounds Coating Additives Market Revenue Share (%), by Country 2025 & 2033
- Figure 26: North America Low Volatile Organic Compounds Coating Additives Market Volume Share (%), by Country 2025 & 2033
- Figure 27: Europe Low Volatile Organic Compounds Coating Additives Market Revenue (billion), by Product Type 2025 & 2033
- Figure 28: Europe Low Volatile Organic Compounds Coating Additives Market Volume (K Tons), by Product Type 2025 & 2033
- Figure 29: Europe Low Volatile Organic Compounds Coating Additives Market Revenue Share (%), by Product Type 2025 & 2033
- Figure 30: Europe Low Volatile Organic Compounds Coating Additives Market Volume Share (%), by Product Type 2025 & 2033
- Figure 31: Europe Low Volatile Organic Compounds Coating Additives Market Revenue (billion), by End-user Industry 2025 & 2033
- Figure 32: Europe Low Volatile Organic Compounds Coating Additives Market Volume (K Tons), by End-user Industry 2025 & 2033
- Figure 33: Europe Low Volatile Organic Compounds Coating Additives Market Revenue Share (%), by End-user Industry 2025 & 2033
- Figure 34: Europe Low Volatile Organic Compounds Coating Additives Market Volume Share (%), by End-user Industry 2025 & 2033
- Figure 35: Europe Low Volatile Organic Compounds Coating Additives Market Revenue (billion), by Country 2025 & 2033
- Figure 36: Europe Low Volatile Organic Compounds Coating Additives Market Volume (K Tons), by Country 2025 & 2033
- Figure 37: Europe Low Volatile Organic Compounds Coating Additives Market Revenue Share (%), by Country 2025 & 2033
- Figure 38: Europe Low Volatile Organic Compounds Coating Additives Market Volume Share (%), by Country 2025 & 2033
- Figure 39: South America Low Volatile Organic Compounds Coating Additives Market Revenue (billion), by Product Type 2025 & 2033
- Figure 40: South America Low Volatile Organic Compounds Coating Additives Market Volume (K Tons), by Product Type 2025 & 2033
- Figure 41: South America Low Volatile Organic Compounds Coating Additives Market Revenue Share (%), by Product Type 2025 & 2033
- Figure 42: South America Low Volatile Organic Compounds Coating Additives Market Volume Share (%), by Product Type 2025 & 2033
- Figure 43: South America Low Volatile Organic Compounds Coating Additives Market Revenue (billion), by End-user Industry 2025 & 2033
- Figure 44: South America Low Volatile Organic Compounds Coating Additives Market Volume (K Tons), by End-user Industry 2025 & 2033
- Figure 45: South America Low Volatile Organic Compounds Coating Additives Market Revenue Share (%), by End-user Industry 2025 & 2033
- Figure 46: South America Low Volatile Organic Compounds Coating Additives Market Volume Share (%), by End-user Industry 2025 & 2033
- Figure 47: South America Low Volatile Organic Compounds Coating Additives Market Revenue (billion), by Country 2025 & 2033
- Figure 48: South America Low Volatile Organic Compounds Coating Additives Market Volume (K Tons), by Country 2025 & 2033
- Figure 49: South America Low Volatile Organic Compounds Coating Additives Market Revenue Share (%), by Country 2025 & 2033
- Figure 50: South America Low Volatile Organic Compounds Coating Additives Market Volume Share (%), by Country 2025 & 2033
- Figure 51: Middle East and Africa Low Volatile Organic Compounds Coating Additives Market Revenue (billion), by Product Type 2025 & 2033
- Figure 52: Middle East and Africa Low Volatile Organic Compounds Coating Additives Market Volume (K Tons), by Product Type 2025 & 2033
- Figure 53: Middle East and Africa Low Volatile Organic Compounds Coating Additives Market Revenue Share (%), by Product Type 2025 & 2033
- Figure 54: Middle East and Africa Low Volatile Organic Compounds Coating Additives Market Volume Share (%), by Product Type 2025 & 2033
- Figure 55: Middle East and Africa Low Volatile Organic Compounds Coating Additives Market Revenue (billion), by End-user Industry 2025 & 2033
- Figure 56: Middle East and Africa Low Volatile Organic Compounds Coating Additives Market Volume (K Tons), by End-user Industry 2025 & 2033
- Figure 57: Middle East and Africa Low Volatile Organic Compounds Coating Additives Market Revenue Share (%), by End-user Industry 2025 & 2033
- Figure 58: Middle East and Africa Low Volatile Organic Compounds Coating Additives Market Volume Share (%), by End-user Industry 2025 & 2033
- Figure 59: Middle East and Africa Low Volatile Organic Compounds Coating Additives Market Revenue (billion), by Country 2025 & 2033
- Figure 60: Middle East and Africa Low Volatile Organic Compounds Coating Additives Market Volume (K Tons), by Country 2025 & 2033
- Figure 61: Middle East and Africa Low Volatile Organic Compounds Coating Additives Market Revenue Share (%), by Country 2025 & 2033
- Figure 62: Middle East and Africa Low Volatile Organic Compounds Coating Additives Market Volume Share (%), by Country 2025 & 2033
List of Tables
- Table 1: Global Low Volatile Organic Compounds Coating Additives Market Revenue billion Forecast, by Product Type 2020 & 2033
- Table 2: Global Low Volatile Organic Compounds Coating Additives Market Volume K Tons Forecast, by Product Type 2020 & 2033
- Table 3: Global Low Volatile Organic Compounds Coating Additives Market Revenue billion Forecast, by End-user Industry 2020 & 2033
- Table 4: Global Low Volatile Organic Compounds Coating Additives Market Volume K Tons Forecast, by End-user Industry 2020 & 2033
- Table 5: Global Low Volatile Organic Compounds Coating Additives Market Revenue billion Forecast, by Region 2020 & 2033
- Table 6: Global Low Volatile Organic Compounds Coating Additives Market Volume K Tons Forecast, by Region 2020 & 2033
- Table 7: Global Low Volatile Organic Compounds Coating Additives Market Revenue billion Forecast, by Product Type 2020 & 2033
- Table 8: Global Low Volatile Organic Compounds Coating Additives Market Volume K Tons Forecast, by Product Type 2020 & 2033
- Table 9: Global Low Volatile Organic Compounds Coating Additives Market Revenue billion Forecast, by End-user Industry 2020 & 2033
- Table 10: Global Low Volatile Organic Compounds Coating Additives Market Volume K Tons Forecast, by End-user Industry 2020 & 2033
- Table 11: Global Low Volatile Organic Compounds Coating Additives Market Revenue billion Forecast, by Country 2020 & 2033
- Table 12: Global Low Volatile Organic Compounds Coating Additives Market Volume K Tons Forecast, by Country 2020 & 2033
- Table 13: China Low Volatile Organic Compounds Coating Additives Market Revenue (billion) Forecast, by Application 2020 & 2033
- Table 14: China Low Volatile Organic Compounds Coating Additives Market Volume (K Tons) Forecast, by Application 2020 & 2033
- Table 15: India Low Volatile Organic Compounds Coating Additives Market Revenue (billion) Forecast, by Application 2020 & 2033
- Table 16: India Low Volatile Organic Compounds Coating Additives Market Volume (K Tons) Forecast, by Application 2020 & 2033
- Table 17: Japan Low Volatile Organic Compounds Coating Additives Market Revenue (billion) Forecast, by Application 2020 & 2033
- Table 18: Japan Low Volatile Organic Compounds Coating Additives Market Volume (K Tons) Forecast, by Application 2020 & 2033
- Table 19: South Korea Low Volatile Organic Compounds Coating Additives Market Revenue (billion) Forecast, by Application 2020 & 2033
- Table 20: South Korea Low Volatile Organic Compounds Coating Additives Market Volume (K Tons) Forecast, by Application 2020 & 2033
- Table 21: Rest of Asia Pacific Low Volatile Organic Compounds Coating Additives Market Revenue (billion) Forecast, by Application 2020 & 2033
- Table 22: Rest of Asia Pacific Low Volatile Organic Compounds Coating Additives Market Volume (K Tons) Forecast, by Application 2020 & 2033
- Table 23: Global Low Volatile Organic Compounds Coating Additives Market Revenue billion Forecast, by Product Type 2020 & 2033
- Table 24: Global Low Volatile Organic Compounds Coating Additives Market Volume K Tons Forecast, by Product Type 2020 & 2033
- Table 25: Global Low Volatile Organic Compounds Coating Additives Market Revenue billion Forecast, by End-user Industry 2020 & 2033
- Table 26: Global Low Volatile Organic Compounds Coating Additives Market Volume K Tons Forecast, by End-user Industry 2020 & 2033
- Table 27: Global Low Volatile Organic Compounds Coating Additives Market Revenue billion Forecast, by Country 2020 & 2033
- Table 28: Global Low Volatile Organic Compounds Coating Additives Market Volume K Tons Forecast, by Country 2020 & 2033
- Table 29: United States Low Volatile Organic Compounds Coating Additives Market Revenue (billion) Forecast, by Application 2020 & 2033
- Table 30: United States Low Volatile Organic Compounds Coating Additives Market Volume (K Tons) Forecast, by Application 2020 & 2033
- Table 31: Canada Low Volatile Organic Compounds Coating Additives Market Revenue (billion) Forecast, by Application 2020 & 2033
- Table 32: Canada Low Volatile Organic Compounds Coating Additives Market Volume (K Tons) Forecast, by Application 2020 & 2033
- Table 33: Mexico Low Volatile Organic Compounds Coating Additives Market Revenue (billion) Forecast, by Application 2020 & 2033
- Table 34: Mexico Low Volatile Organic Compounds Coating Additives Market Volume (K Tons) Forecast, by Application 2020 & 2033
- Table 35: Global Low Volatile Organic Compounds Coating Additives Market Revenue billion Forecast, by Product Type 2020 & 2033
- Table 36: Global Low Volatile Organic Compounds Coating Additives Market Volume K Tons Forecast, by Product Type 2020 & 2033
- Table 37: Global Low Volatile Organic Compounds Coating Additives Market Revenue billion Forecast, by End-user Industry 2020 & 2033
- Table 38: Global Low Volatile Organic Compounds Coating Additives Market Volume K Tons Forecast, by End-user Industry 2020 & 2033
- Table 39: Global Low Volatile Organic Compounds Coating Additives Market Revenue billion Forecast, by Country 2020 & 2033
- Table 40: Global Low Volatile Organic Compounds Coating Additives Market Volume K Tons Forecast, by Country 2020 & 2033
- Table 41: Germany Low Volatile Organic Compounds Coating Additives Market Revenue (billion) Forecast, by Application 2020 & 2033
- Table 42: Germany Low Volatile Organic Compounds Coating Additives Market Volume (K Tons) Forecast, by Application 2020 & 2033
- Table 43: United Kingdom Low Volatile Organic Compounds Coating Additives Market Revenue (billion) Forecast, by Application 2020 & 2033
- Table 44: United Kingdom Low Volatile Organic Compounds Coating Additives Market Volume (K Tons) Forecast, by Application 2020 & 2033
- Table 45: France Low Volatile Organic Compounds Coating Additives Market Revenue (billion) Forecast, by Application 2020 & 2033
- Table 46: France Low Volatile Organic Compounds Coating Additives Market Volume (K Tons) Forecast, by Application 2020 & 2033
- Table 47: Italy Low Volatile Organic Compounds Coating Additives Market Revenue (billion) Forecast, by Application 2020 & 2033
- Table 48: Italy Low Volatile Organic Compounds Coating Additives Market Volume (K Tons) Forecast, by Application 2020 & 2033
- Table 49: Rest of Europe Low Volatile Organic Compounds Coating Additives Market Revenue (billion) Forecast, by Application 2020 & 2033
- Table 50: Rest of Europe Low Volatile Organic Compounds Coating Additives Market Volume (K Tons) Forecast, by Application 2020 & 2033
- Table 51: Global Low Volatile Organic Compounds Coating Additives Market Revenue billion Forecast, by Product Type 2020 & 2033
- Table 52: Global Low Volatile Organic Compounds Coating Additives Market Volume K Tons Forecast, by Product Type 2020 & 2033
- Table 53: Global Low Volatile Organic Compounds Coating Additives Market Revenue billion Forecast, by End-user Industry 2020 & 2033
- Table 54: Global Low Volatile Organic Compounds Coating Additives Market Volume K Tons Forecast, by End-user Industry 2020 & 2033
- Table 55: Global Low Volatile Organic Compounds Coating Additives Market Revenue billion Forecast, by Country 2020 & 2033
- Table 56: Global Low Volatile Organic Compounds Coating Additives Market Volume K Tons Forecast, by Country 2020 & 2033
- Table 57: Brazil Low Volatile Organic Compounds Coating Additives Market Revenue (billion) Forecast, by Application 2020 & 2033
- Table 58: Brazil Low Volatile Organic Compounds Coating Additives Market Volume (K Tons) Forecast, by Application 2020 & 2033
- Table 59: Argentina Low Volatile Organic Compounds Coating Additives Market Revenue (billion) Forecast, by Application 2020 & 2033
- Table 60: Argentina Low Volatile Organic Compounds Coating Additives Market Volume (K Tons) Forecast, by Application 2020 & 2033
- Table 61: Rest of South America Low Volatile Organic Compounds Coating Additives Market Revenue (billion) Forecast, by Application 2020 & 2033
- Table 62: Rest of South America Low Volatile Organic Compounds Coating Additives Market Volume (K Tons) Forecast, by Application 2020 & 2033
- Table 63: Global Low Volatile Organic Compounds Coating Additives Market Revenue billion Forecast, by Product Type 2020 & 2033
- Table 64: Global Low Volatile Organic Compounds Coating Additives Market Volume K Tons Forecast, by Product Type 2020 & 2033
- Table 65: Global Low Volatile Organic Compounds Coating Additives Market Revenue billion Forecast, by End-user Industry 2020 & 2033
- Table 66: Global Low Volatile Organic Compounds Coating Additives Market Volume K Tons Forecast, by End-user Industry 2020 & 2033
- Table 67: Global Low Volatile Organic Compounds Coating Additives Market Revenue billion Forecast, by Country 2020 & 2033
- Table 68: Global Low Volatile Organic Compounds Coating Additives Market Volume K Tons Forecast, by Country 2020 & 2033
- Table 69: Saudi Arabia Low Volatile Organic Compounds Coating Additives Market Revenue (billion) Forecast, by Application 2020 & 2033
- Table 70: Saudi Arabia Low Volatile Organic Compounds Coating Additives Market Volume (K Tons) Forecast, by Application 2020 & 2033
- Table 71: South Africa Low Volatile Organic Compounds Coating Additives Market Revenue (billion) Forecast, by Application 2020 & 2033
- Table 72: South Africa Low Volatile Organic Compounds Coating Additives Market Volume (K Tons) Forecast, by Application 2020 & 2033
- Table 73: Rest of Middle East and Africa Low Volatile Organic Compounds Coating Additives Market Revenue (billion) Forecast, by Application 2020 & 2033
- Table 74: Rest of Middle East and Africa Low Volatile Organic Compounds Coating Additives Market Volume (K Tons) Forecast, by Application 2020 & 2033
Frequently Asked Questions
1. What is the projected Compound Annual Growth Rate (CAGR) of the Low Volatile Organic Compounds Coating Additives Market?
The projected CAGR is approximately 13.16%.
2. Which companies are prominent players in the Low Volatile Organic Compounds Coating Additives Market?
Key companies in the market include Synthomer plc, Chemoxy International Ltd, Solvay, Ethox Chemicals LLC, DAIKIN INDUSTRIES Ltd, Croda International Plc, BASF SE, SEQENS, Dow, Eastman Chemical Company, The Lubrizol Corporation, Axalta Coating Systems LLC, Evonik AG, Emerald Kalama Chemical, Borchers Inc, Matthews Paint.
3. What are the main segments of the Low Volatile Organic Compounds Coating Additives Market?
The market segments include Product Type, End-user Industry.
4. Can you provide details about the market size?
The market size is estimated to be USD 9.45 billion as of 2022.
5. What are some drivers contributing to market growth?
; Growing Demand from Building and Construction Industry; Other Drivers.
6. What are the notable trends driving market growth?
Building and Construction Industry to Dominate the Market.
7. Are there any restraints impacting market growth?
; Unfavorable Conditions Arising Due to COVID-19 Outbreak; Other Restraints.
8. Can you provide examples of recent developments in the market?
N/A
9. What pricing options are available for accessing the report?
Pricing options include single-user, multi-user, and enterprise licenses priced at USD 4750, USD 5250, and USD 8750 respectively.
10. Is the market size provided in terms of value or volume?
The market size is provided in terms of value, measured in billion and volume, measured in K Tons.
11. Are there any specific market keywords associated with the report?
Yes, the market keyword associated with the report is "Low Volatile Organic Compounds Coating Additives Market," which aids in identifying and referencing the specific market segment covered.
12. How do I determine which pricing option suits my needs best?
The pricing options vary based on user requirements and access needs. Individual users may opt for single-user licenses, while businesses requiring broader access may choose multi-user or enterprise licenses for cost-effective access to the report.
13. Are there any additional resources or data provided in the Low Volatile Organic Compounds Coating Additives Market report?
While the report offers comprehensive insights, it's advisable to review the specific contents or supplementary materials provided to ascertain if additional resources or data are available.
14. How can I stay updated on further developments or reports in the Low Volatile Organic Compounds Coating Additives Market?
To stay informed about further developments, trends, and reports in the Low Volatile Organic Compounds Coating Additives Market, consider subscribing to industry newsletters, following relevant companies and organizations, or regularly checking reputable industry news sources and publications.
Methodology
Step 1 - Identification of Relevant Samples Size from Population Database


Step 2 - Approaches for Defining Global Market Size (Value, Volume* & Price*)

Note*: In applicable scenarios
Step 3 - Data Sources
Primary Research
- Web Analytics
- Survey Reports
- Research Institute
- Latest Research Reports
- Opinion Leaders
Secondary Research
- Annual Reports
- White Paper
- Latest Press Release
- Industry Association
- Paid Database
- Investor Presentations

Step 4 - Data Triangulation
Involves using different sources of information in order to increase the validity of a study
These sources are likely to be stakeholders in a program - participants, other researchers, program staff, other community members, and so on.
Then we put all data in single framework & apply various statistical tools to find out the dynamic on the market.
During the analysis stage, feedback from the stakeholder groups would be compared to determine areas of agreement as well as areas of divergence

