

Key Insights
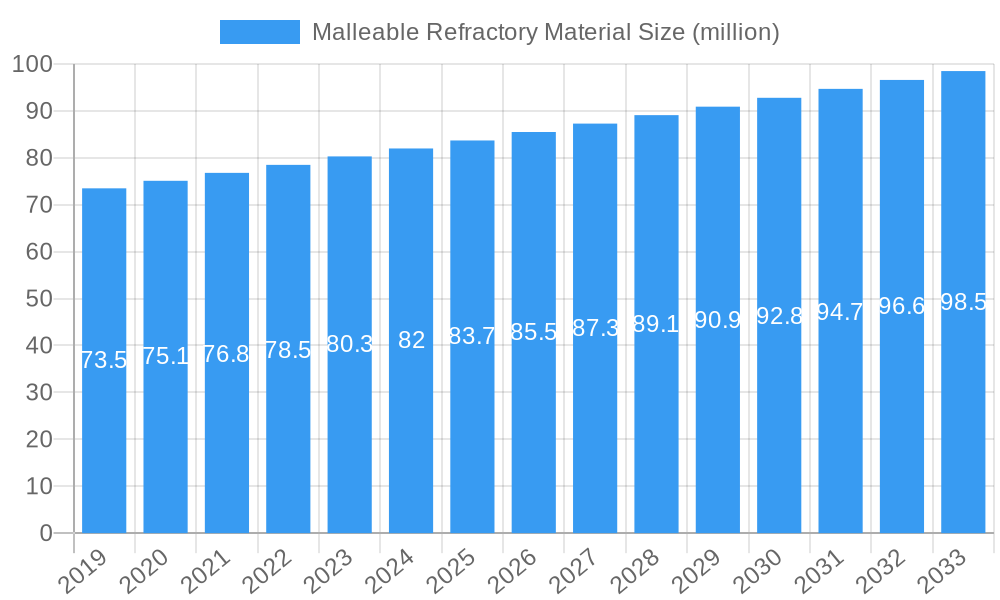
The global Malleable Refractory Material market is poised for robust growth, projected to reach an estimated USD 80.7 million in 2025 and expand at a Compound Annual Growth Rate (CAGR) of 4.7% through 2033. This sustained expansion is primarily fueled by the insatiable demand from core industrial sectors such as steel production, the chemical industry, and glass manufacturing. These industries rely heavily on malleable refractory materials for their high-temperature processing applications, where exceptional thermal resistance, chemical inertness, and mechanical strength are paramount. The increasing pace of industrialization, particularly in emerging economies, coupled with ongoing technological advancements in refractory material composition and production, are key drivers underpinning this positive market trajectory. Furthermore, a growing emphasis on energy efficiency and reduced emissions within these heavy industries is also stimulating the adoption of advanced refractory solutions that offer superior performance and longevity.
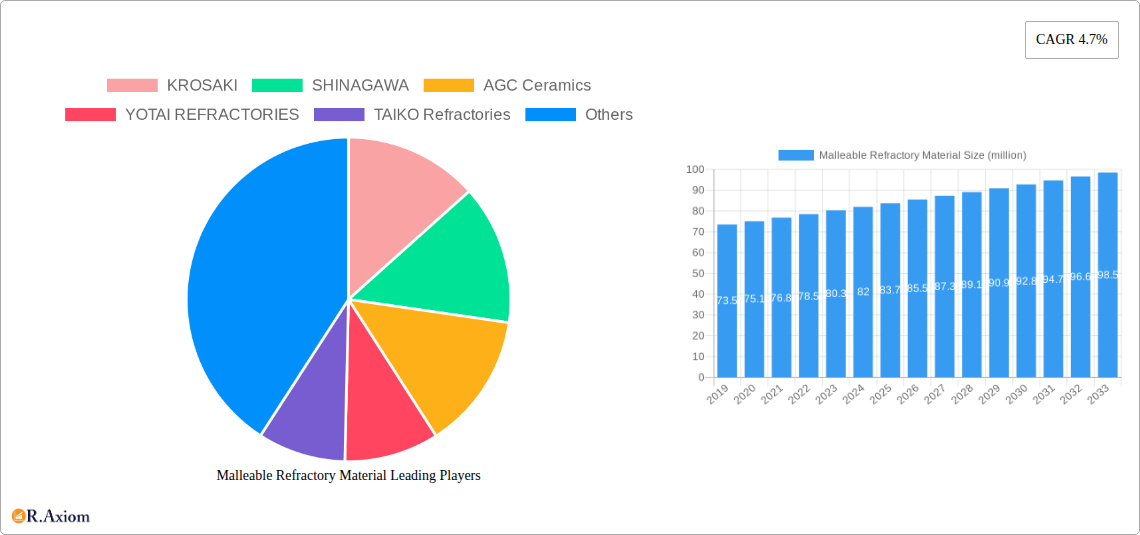
Malleable Refractory Material Market Size (In Million)
The market landscape is characterized by a diverse range of applications and product types, offering significant opportunities for innovation and specialization. Acid, basic, and neutral refractory materials each cater to specific operational requirements, allowing manufacturers to address a broad spectrum of industrial needs. While the steel industry represents a dominant application segment due to the sheer volume of high-temperature processes involved, the chemical and glass sectors are also demonstrating consistent demand. Key players like KROSAKI, SHINAGAWA, AGC Ceramics, and SAINT-GOBAIN are actively engaged in research and development to introduce next-generation malleable refractory materials that offer enhanced performance characteristics, improved sustainability, and cost-effectiveness. Challenges, such as fluctuating raw material prices and stringent environmental regulations, are present, but the overarching demand from essential industries and ongoing technological advancements are expected to propel the market forward throughout the forecast period. The Asia Pacific region is anticipated to be a major growth engine, driven by its expansive industrial base and rapid economic development.
Malleable Refractory Material Company Market Share
This comprehensive report provides an in-depth analysis of the global Malleable Refractory Material market, covering its current landscape, future projections, and key influencing factors. With a meticulous study period spanning from 2019 to 2033, and a base year of 2025, this report offers invaluable insights for industry stakeholders, investors, and decision-makers. The analysis delves into market concentration, innovation trends, dominant segments, product developments, growth drivers, challenges, and emerging opportunities, equipping readers with actionable intelligence. The report meticulously segments the market by Application (Steel, Chemical Industry, Glass, Others) and Type (Acid Refractory, Basic Refractory, Neutral Refractory), offering a granular understanding of market dynamics.
Malleable Refractory Material Market Concentration & Innovation
The global Malleable Refractory Material market exhibits a XX% market concentration, with key players like KROSAKI, SHINAGAWA, AGC Ceramics, YOTAI REFRACTORIES, TAIKO Refractories, ROZAI KOGYO KAISHA, ITOCHU CERATECH CORPORATION, Nippon Crucible, Resonac, SAINT-GOBAIN, TYK Corporation, and KOA REFRACTRIES dominating the landscape. Innovation is a significant driver, propelled by advancements in material science leading to enhanced thermal stability, chemical resistance, and mechanical strength. Regulatory frameworks, particularly concerning environmental sustainability and safety standards, are increasingly influencing product development and market entry. While direct product substitutes are limited due to the specialized nature of refractory materials, advancements in alternative heating technologies and process efficiencies in end-use industries could indirectly impact demand. End-user trends point towards a growing demand for high-performance refractories in extreme temperature applications within the steel, chemical, and glass industries. Mergers and acquisitions (M&A) activity is moderate, with recent deals valued at approximately $XX million aimed at consolidating market share and expanding technological capabilities. The market share of leading players ranges from XX% to XX%.
Malleable Refractory Material Industry Trends & Insights
The Malleable Refractory Material industry is poised for robust growth, driven by escalating demand from burgeoning industrial sectors and ongoing technological advancements. The global market is projected to experience a Compound Annual Growth Rate (CAGR) of XX% from 2025 to 2033. Key growth drivers include the expansion of the steel industry in emerging economies, necessitating the use of high-quality refractories for furnace linings and processing equipment. The chemical industry's demand for corrosion-resistant and high-temperature materials for reactors and cracking units further fuels market expansion. Technological disruptions are primarily centered around the development of advanced refractory formulations with improved lifespan, energy efficiency, and reduced environmental impact. Consumer preferences are shifting towards sustainable and eco-friendly refractory solutions, prompting manufacturers to invest in research and development of green alternatives. Competitive dynamics are characterized by a blend of established global players and regional specialists, vying for market share through product differentiation, technological innovation, and strategic partnerships. Market penetration is estimated to be XX% of the total addressable market by 2025.
Dominant Markets & Segments in Malleable Refractory Material
The Steel application segment holds a dominant position in the Malleable Refractory Material market, accounting for approximately XX% of the total market share in 2025. This dominance is driven by the continuous global demand for steel production, requiring extensive use of refractory materials in blast furnaces, converters, and ladles. Key drivers include economic policies supporting infrastructure development and automotive manufacturing, which directly correlate with steel consumption. The Acid Refractory type segment is another significant contributor, particularly in applications involving acidic environments within industrial processes.
- Steel Industry: This sector's dominance is underscored by massive infrastructure projects and growing automotive production worldwide. The need for high-temperature resistance and resistance to molten metal erosion makes malleable refractories indispensable. Market size for this segment is estimated at $XX million in 2025.
- Chemical Industry: Driven by the need for chemical resistance and high-temperature stability in reactors and furnaces, this segment is witnessing steady growth. Advancements in petrochemical processing and the production of specialized chemicals are key contributors. Market size for this segment is estimated at $XX million in 2025.
- Glass Industry: The production of various types of glass, from container glass to specialty glass, relies heavily on refractories for furnace construction and maintenance. Innovations in glass formulations and the demand for energy-efficient glass manufacturing processes are shaping this segment. Market size for this segment is estimated at $XX million in 2025.
- Others: This broad category encompasses applications in cement, non-ferrous metals, and waste incineration, all of which contribute to the overall market demand. Emerging applications in renewable energy sectors could further bolster this segment. Market size for this segment is estimated at $XX million in 2025.
The dominance of Basic Refractory materials is attributed to their superior performance in high-temperature, alkaline environments prevalent in steelmaking. This segment alone is projected to reach $XX million by 2025.
Malleable Refractory Material Product Developments
Recent product developments in Malleable Refractory Materials focus on enhanced thermal shock resistance, improved slagging resistance, and extended service life. Innovations include the development of advanced composite refractories and novel binding systems. These advancements aim to reduce maintenance downtime and operational costs for end-users. The competitive advantage lies in offering tailored solutions for specific industrial applications, such as specialized refractories for ultra-high temperature furnaces or those resistant to highly corrosive chemical environments. Technological trends emphasize sustainability, leading to the development of refractories with lower embodied energy and improved recyclability.
Report Scope & Segmentation Analysis
This report offers a comprehensive segmentation of the Malleable Refractory Material market.
Steel: This segment, projected to reach $XX million by 2033, is driven by continuous global demand for steel in construction and manufacturing.
Chemical Industry: Expected to grow to $XX million by 2033, this segment benefits from advancements in petrochemical and specialty chemical production.
Glass: This segment is forecast to reach $XX million by 2033, influenced by the demand for energy-efficient glass manufacturing and new glass formulations.
Others: This segment, encompassing diverse applications, is projected to expand to $XX million by 2033, with potential growth in emerging industrial sectors.
Acid Refractory: This type is anticipated to grow to $XX million by 2033, driven by its use in acidic process environments.
Basic Refractory: Forecasted to reach $XX million by 2033, this segment's growth is primarily linked to the steel industry's demands.
Neutral Refractory: Projected to grow to $XX million by 2033, this segment finds applications across various industries requiring balanced refractory properties.
Key Drivers of Malleable Refractory Material Growth
The Malleable Refractory Material market is propelled by several key drivers:
- Industrial Expansion: The growth of heavy industries like steel, chemical, and glass manufacturing, particularly in emerging economies, directly translates to increased demand for refractory materials.
- Technological Advancements: Continuous innovation in material science leads to the development of refractories with superior performance characteristics, such as enhanced thermal stability and chemical resistance.
- Infrastructure Development: Global investments in infrastructure projects, including power plants and manufacturing facilities, are significant catalysts for refractory consumption.
- Stringent Environmental Regulations: The need for energy-efficient and environmentally friendly industrial processes is driving the demand for advanced refractory solutions that minimize heat loss and emissions.
Challenges in the Malleable Refractory Material Sector
Despite the positive outlook, the Malleable Refractory Material sector faces several challenges:
- Raw Material Price Volatility: Fluctuations in the prices of key raw materials, such as alumina, magnesia, and silica, can impact production costs and profitability.
- Supply Chain Disruptions: Global events and geopolitical factors can lead to disruptions in the supply chain, affecting the availability and delivery of raw materials and finished products.
- Intense Competition: The market is characterized by a significant number of players, leading to intense price competition and pressure on profit margins.
- Environmental Concerns: While drivers, evolving environmental regulations can also pose challenges in terms of compliance costs and the need for significant investment in sustainable manufacturing processes.
Emerging Opportunities in Malleable Refractory Material
The Malleable Refractory Material market presents several emerging opportunities:
- Growth in Renewable Energy Sectors: The increasing adoption of renewable energy technologies, such as solar thermal power plants and waste-to-energy facilities, offers new avenues for refractory applications.
- Development of Advanced Refractories: Research and development into novel refractory compositions with superior performance characteristics, such as ultra-high temperature resistance and advanced wear resistance, will open new market niches.
- Focus on Sustainability and Circular Economy: The growing emphasis on sustainability and the circular economy is creating opportunities for manufacturers offering recycled or recyclable refractory materials and solutions.
- Emerging Markets: The rapid industrialization of developing economies in Asia-Pacific, Africa, and Latin America presents substantial untapped market potential for malleable refractory materials.
Leading Players in the Malleable Refractory Material Market
- KROSAKI
- SHINAGAWA
- AGC Ceramics
- YOTAI REFRACTORIES
- TAIKO Refractories
- ROZAI KOGYO KAISHA
- ITOCHU CERATECH CORPORATION
- Nippon Crucible
- Resonac
- SAINT-GOBAIN
- TYK Corporation
- KOA REFRACTRIES
Key Developments in Malleable Refractory Material Industry
- 2023: Introduction of next-generation spinel-based refractories offering enhanced thermal shock resistance for steel ladle applications.
- 2022: Strategic partnership formed between AGC Ceramics and a leading chemical manufacturer to develop specialized refractories for high-pressure reactors.
- 2021: TAIKO Refractories launched a new line of high-alumina castables with improved abrasion resistance for glass furnace applications.
- 2020: SAINT-GOBAIN acquired a niche refractory manufacturer, expanding its portfolio of advanced ceramic materials.
- 2019: KROSAKI invested significantly in R&D for developing sustainable and recyclable refractory solutions.
Strategic Outlook for Malleable Refractory Material Market
The strategic outlook for the Malleable Refractory Material market is characterized by a strong emphasis on innovation, sustainability, and market expansion. Companies that focus on developing high-performance, eco-friendly refractory solutions tailored to specific industry needs will likely gain a competitive edge. Strategic collaborations and targeted acquisitions will remain crucial for consolidating market share and accessing new technologies. The growing demand from emerging economies and the increasing adoption of advanced manufacturing processes present significant growth catalysts, ensuring a positive trajectory for the market in the forecast period.
Malleable Refractory Material Segmentation
-
1. Application
- 1.1. Steel
- 1.2. Chemical Industry
- 1.3. Glass
- 1.4. Others
-
2. Type
- 2.1. Acid Refractory
- 2.2. Basic Refractory
- 2.3. Neutral Refractory
Malleable Refractory Material Segmentation By Geography
-
1. North America
- 1.1. United States
- 1.2. Canada
- 1.3. Mexico
-
2. South America
- 2.1. Brazil
- 2.2. Argentina
- 2.3. Rest of South America
-
3. Europe
- 3.1. United Kingdom
- 3.2. Germany
- 3.3. France
- 3.4. Italy
- 3.5. Spain
- 3.6. Russia
- 3.7. Benelux
- 3.8. Nordics
- 3.9. Rest of Europe
-
4. Middle East & Africa
- 4.1. Turkey
- 4.2. Israel
- 4.3. GCC
- 4.4. North Africa
- 4.5. South Africa
- 4.6. Rest of Middle East & Africa
-
5. Asia Pacific
- 5.1. China
- 5.2. India
- 5.3. Japan
- 5.4. South Korea
- 5.5. ASEAN
- 5.6. Oceania
- 5.7. Rest of Asia Pacific
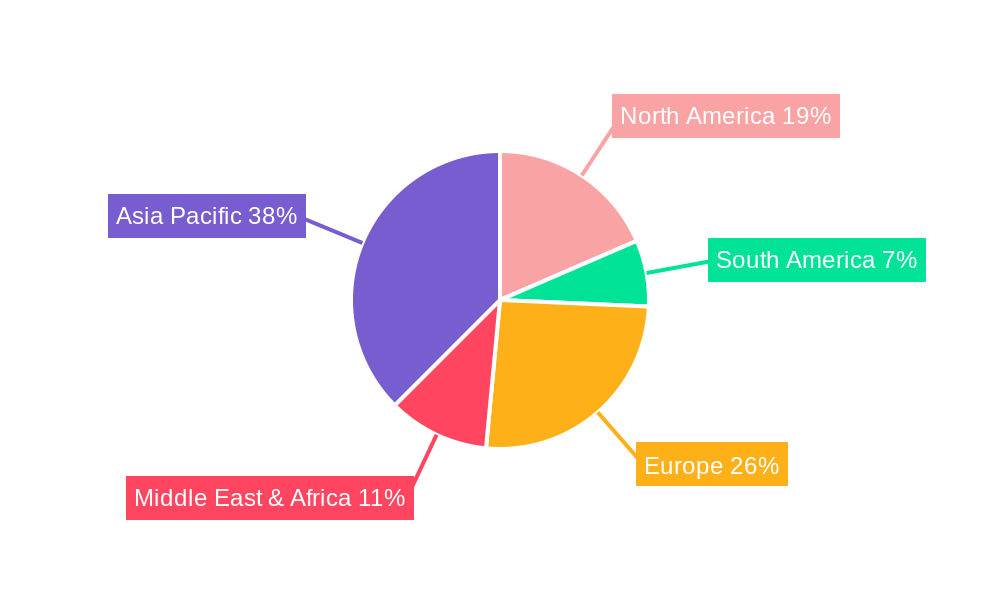
Malleable Refractory Material Regional Market Share
Geographic Coverage of Malleable Refractory Material
Malleable Refractory Material REPORT HIGHLIGHTS
| Aspects | Details |
|---|---|
| Study Period | 2020-2034 |
| Base Year | 2025 |
| Estimated Year | 2026 |
| Forecast Period | 2026-2034 |
| Historical Period | 2020-2025 |
| Growth Rate | CAGR of 4.7% from 2020-2034 |
| Segmentation |
|
Table of Contents
- 1. Introduction
- 1.1. Research Scope
- 1.2. Market Segmentation
- 1.3. Research Objective
- 1.4. Definitions and Assumptions
- 2. Executive Summary
- 2.1. Market Snapshot
- 3. Market Dynamics
- 3.1. Market Drivers
- 3.2. Market Restrains
- 3.3. Market Trends
- 3.4. Market Opportunities
- 4. Market Factor Analysis
- 4.1. Porters Five Forces
- 4.1.1. Bargaining Power of Suppliers
- 4.1.2. Bargaining Power of Buyers
- 4.1.3. Threat of New Entrants
- 4.1.4. Threat of Substitutes
- 4.1.5. Competitive Rivalry
- 4.2. PESTEL analysis
- 4.3. BCG Analysis
- 4.3.1. Stars (High Growth, High Market Share)
- 4.3.2. Cash Cows (Low Growth, High Market Share)
- 4.3.3. Question Mark (High Growth, Low Market Share)
- 4.3.4. Dogs (Low Growth, Low Market Share)
- 4.4. Ansoff Matrix Analysis
- 4.5. Supply Chain Analysis
- 4.6. Regulatory Landscape
- 4.7. Current Market Potential and Opportunity Assessment (TAM–SAM–SOM Framework)
- 4.8. RAX Analyst Note
- 4.1. Porters Five Forces
- 5. Market Analysis, Insights and Forecast 2021-2033
- 5.1. Market Analysis, Insights and Forecast - by Application
- 5.1.1. Steel
- 5.1.2. Chemical Industry
- 5.1.3. Glass
- 5.1.4. Others
- 5.2. Market Analysis, Insights and Forecast - by Type
- 5.2.1. Acid Refractory
- 5.2.2. Basic Refractory
- 5.2.3. Neutral Refractory
- 5.3. Market Analysis, Insights and Forecast - by Region
- 5.3.1. North America
- 5.3.2. South America
- 5.3.3. Europe
- 5.3.4. Middle East & Africa
- 5.3.5. Asia Pacific
- 5.1. Market Analysis, Insights and Forecast - by Application
- 6. Global Malleable Refractory Material Analysis, Insights and Forecast, 2021-2033
- 6.1. Market Analysis, Insights and Forecast - by Application
- 6.1.1. Steel
- 6.1.2. Chemical Industry
- 6.1.3. Glass
- 6.1.4. Others
- 6.2. Market Analysis, Insights and Forecast - by Type
- 6.2.1. Acid Refractory
- 6.2.2. Basic Refractory
- 6.2.3. Neutral Refractory
- 6.1. Market Analysis, Insights and Forecast - by Application
- 7. North America Malleable Refractory Material Analysis, Insights and Forecast, 2020-2032
- 7.1. Market Analysis, Insights and Forecast - by Application
- 7.1.1. Steel
- 7.1.2. Chemical Industry
- 7.1.3. Glass
- 7.1.4. Others
- 7.2. Market Analysis, Insights and Forecast - by Type
- 7.2.1. Acid Refractory
- 7.2.2. Basic Refractory
- 7.2.3. Neutral Refractory
- 7.1. Market Analysis, Insights and Forecast - by Application
- 8. South America Malleable Refractory Material Analysis, Insights and Forecast, 2020-2032
- 8.1. Market Analysis, Insights and Forecast - by Application
- 8.1.1. Steel
- 8.1.2. Chemical Industry
- 8.1.3. Glass
- 8.1.4. Others
- 8.2. Market Analysis, Insights and Forecast - by Type
- 8.2.1. Acid Refractory
- 8.2.2. Basic Refractory
- 8.2.3. Neutral Refractory
- 8.1. Market Analysis, Insights and Forecast - by Application
- 9. Europe Malleable Refractory Material Analysis, Insights and Forecast, 2020-2032
- 9.1. Market Analysis, Insights and Forecast - by Application
- 9.1.1. Steel
- 9.1.2. Chemical Industry
- 9.1.3. Glass
- 9.1.4. Others
- 9.2. Market Analysis, Insights and Forecast - by Type
- 9.2.1. Acid Refractory
- 9.2.2. Basic Refractory
- 9.2.3. Neutral Refractory
- 9.1. Market Analysis, Insights and Forecast - by Application
- 10. Middle East & Africa Malleable Refractory Material Analysis, Insights and Forecast, 2020-2032
- 10.1. Market Analysis, Insights and Forecast - by Application
- 10.1.1. Steel
- 10.1.2. Chemical Industry
- 10.1.3. Glass
- 10.1.4. Others
- 10.2. Market Analysis, Insights and Forecast - by Type
- 10.2.1. Acid Refractory
- 10.2.2. Basic Refractory
- 10.2.3. Neutral Refractory
- 10.1. Market Analysis, Insights and Forecast - by Application
- 11. Asia Pacific Malleable Refractory Material Analysis, Insights and Forecast, 2020-2032
- 11.1. Market Analysis, Insights and Forecast - by Application
- 11.1.1. Steel
- 11.1.2. Chemical Industry
- 11.1.3. Glass
- 11.1.4. Others
- 11.2. Market Analysis, Insights and Forecast - by Type
- 11.2.1. Acid Refractory
- 11.2.2. Basic Refractory
- 11.2.3. Neutral Refractory
- 11.1. Market Analysis, Insights and Forecast - by Application
- 12. Competitive Analysis
- 12.1. Company Profiles
- 12.1.1 KROSAKI
- 12.1.1.1. Company Overview
- 12.1.1.2. Products
- 12.1.1.3. Company Financials
- 12.1.1.4. SWOT Analysis
- 12.1.2 SHINAGAWA
- 12.1.2.1. Company Overview
- 12.1.2.2. Products
- 12.1.2.3. Company Financials
- 12.1.2.4. SWOT Analysis
- 12.1.3 AGC Ceramics
- 12.1.3.1. Company Overview
- 12.1.3.2. Products
- 12.1.3.3. Company Financials
- 12.1.3.4. SWOT Analysis
- 12.1.4 YOTAI REFRACTORIES
- 12.1.4.1. Company Overview
- 12.1.4.2. Products
- 12.1.4.3. Company Financials
- 12.1.4.4. SWOT Analysis
- 12.1.5 TAIKO Refractories
- 12.1.5.1. Company Overview
- 12.1.5.2. Products
- 12.1.5.3. Company Financials
- 12.1.5.4. SWOT Analysis
- 12.1.6 ROZAI KOGYO KAISHA
- 12.1.6.1. Company Overview
- 12.1.6.2. Products
- 12.1.6.3. Company Financials
- 12.1.6.4. SWOT Analysis
- 12.1.7 ITOCHU CERATECH CORPORATION
- 12.1.7.1. Company Overview
- 12.1.7.2. Products
- 12.1.7.3. Company Financials
- 12.1.7.4. SWOT Analysis
- 12.1.8 Nippon Crucible
- 12.1.8.1. Company Overview
- 12.1.8.2. Products
- 12.1.8.3. Company Financials
- 12.1.8.4. SWOT Analysis
- 12.1.9 Resonac
- 12.1.9.1. Company Overview
- 12.1.9.2. Products
- 12.1.9.3. Company Financials
- 12.1.9.4. SWOT Analysis
- 12.1.10 SAINT-GOBAIN
- 12.1.10.1. Company Overview
- 12.1.10.2. Products
- 12.1.10.3. Company Financials
- 12.1.10.4. SWOT Analysis
- 12.1.11 TYK Corporation
- 12.1.11.1. Company Overview
- 12.1.11.2. Products
- 12.1.11.3. Company Financials
- 12.1.11.4. SWOT Analysis
- 12.1.12 KOA REFRACTRIES
- 12.1.12.1. Company Overview
- 12.1.12.2. Products
- 12.1.12.3. Company Financials
- 12.1.12.4. SWOT Analysis
- 12.1.1 KROSAKI
- 12.2. Market Entropy
- 12.2.1 Company's Key Areas Served
- 12.2.2 Recent Developments
- 12.3. Company Market Share Analysis 2025
- 12.3.1 Top 5 Companies Market Share Analysis
- 12.3.2 Top 3 Companies Market Share Analysis
- 12.4. List of Potential Customers
- 13. Research Methodology
List of Figures
- Figure 1: Global Malleable Refractory Material Revenue Breakdown (million, %) by Region 2025 & 2033
- Figure 2: North America Malleable Refractory Material Revenue (million), by Application 2025 & 2033
- Figure 3: North America Malleable Refractory Material Revenue Share (%), by Application 2025 & 2033
- Figure 4: North America Malleable Refractory Material Revenue (million), by Type 2025 & 2033
- Figure 5: North America Malleable Refractory Material Revenue Share (%), by Type 2025 & 2033
- Figure 6: North America Malleable Refractory Material Revenue (million), by Country 2025 & 2033
- Figure 7: North America Malleable Refractory Material Revenue Share (%), by Country 2025 & 2033
- Figure 8: South America Malleable Refractory Material Revenue (million), by Application 2025 & 2033
- Figure 9: South America Malleable Refractory Material Revenue Share (%), by Application 2025 & 2033
- Figure 10: South America Malleable Refractory Material Revenue (million), by Type 2025 & 2033
- Figure 11: South America Malleable Refractory Material Revenue Share (%), by Type 2025 & 2033
- Figure 12: South America Malleable Refractory Material Revenue (million), by Country 2025 & 2033
- Figure 13: South America Malleable Refractory Material Revenue Share (%), by Country 2025 & 2033
- Figure 14: Europe Malleable Refractory Material Revenue (million), by Application 2025 & 2033
- Figure 15: Europe Malleable Refractory Material Revenue Share (%), by Application 2025 & 2033
- Figure 16: Europe Malleable Refractory Material Revenue (million), by Type 2025 & 2033
- Figure 17: Europe Malleable Refractory Material Revenue Share (%), by Type 2025 & 2033
- Figure 18: Europe Malleable Refractory Material Revenue (million), by Country 2025 & 2033
- Figure 19: Europe Malleable Refractory Material Revenue Share (%), by Country 2025 & 2033
- Figure 20: Middle East & Africa Malleable Refractory Material Revenue (million), by Application 2025 & 2033
- Figure 21: Middle East & Africa Malleable Refractory Material Revenue Share (%), by Application 2025 & 2033
- Figure 22: Middle East & Africa Malleable Refractory Material Revenue (million), by Type 2025 & 2033
- Figure 23: Middle East & Africa Malleable Refractory Material Revenue Share (%), by Type 2025 & 2033
- Figure 24: Middle East & Africa Malleable Refractory Material Revenue (million), by Country 2025 & 2033
- Figure 25: Middle East & Africa Malleable Refractory Material Revenue Share (%), by Country 2025 & 2033
- Figure 26: Asia Pacific Malleable Refractory Material Revenue (million), by Application 2025 & 2033
- Figure 27: Asia Pacific Malleable Refractory Material Revenue Share (%), by Application 2025 & 2033
- Figure 28: Asia Pacific Malleable Refractory Material Revenue (million), by Type 2025 & 2033
- Figure 29: Asia Pacific Malleable Refractory Material Revenue Share (%), by Type 2025 & 2033
- Figure 30: Asia Pacific Malleable Refractory Material Revenue (million), by Country 2025 & 2033
- Figure 31: Asia Pacific Malleable Refractory Material Revenue Share (%), by Country 2025 & 2033
List of Tables
- Table 1: Global Malleable Refractory Material Revenue million Forecast, by Application 2020 & 2033
- Table 2: Global Malleable Refractory Material Revenue million Forecast, by Type 2020 & 2033
- Table 3: Global Malleable Refractory Material Revenue million Forecast, by Region 2020 & 2033
- Table 4: Global Malleable Refractory Material Revenue million Forecast, by Application 2020 & 2033
- Table 5: Global Malleable Refractory Material Revenue million Forecast, by Type 2020 & 2033
- Table 6: Global Malleable Refractory Material Revenue million Forecast, by Country 2020 & 2033
- Table 7: United States Malleable Refractory Material Revenue (million) Forecast, by Application 2020 & 2033
- Table 8: Canada Malleable Refractory Material Revenue (million) Forecast, by Application 2020 & 2033
- Table 9: Mexico Malleable Refractory Material Revenue (million) Forecast, by Application 2020 & 2033
- Table 10: Global Malleable Refractory Material Revenue million Forecast, by Application 2020 & 2033
- Table 11: Global Malleable Refractory Material Revenue million Forecast, by Type 2020 & 2033
- Table 12: Global Malleable Refractory Material Revenue million Forecast, by Country 2020 & 2033
- Table 13: Brazil Malleable Refractory Material Revenue (million) Forecast, by Application 2020 & 2033
- Table 14: Argentina Malleable Refractory Material Revenue (million) Forecast, by Application 2020 & 2033
- Table 15: Rest of South America Malleable Refractory Material Revenue (million) Forecast, by Application 2020 & 2033
- Table 16: Global Malleable Refractory Material Revenue million Forecast, by Application 2020 & 2033
- Table 17: Global Malleable Refractory Material Revenue million Forecast, by Type 2020 & 2033
- Table 18: Global Malleable Refractory Material Revenue million Forecast, by Country 2020 & 2033
- Table 19: United Kingdom Malleable Refractory Material Revenue (million) Forecast, by Application 2020 & 2033
- Table 20: Germany Malleable Refractory Material Revenue (million) Forecast, by Application 2020 & 2033
- Table 21: France Malleable Refractory Material Revenue (million) Forecast, by Application 2020 & 2033
- Table 22: Italy Malleable Refractory Material Revenue (million) Forecast, by Application 2020 & 2033
- Table 23: Spain Malleable Refractory Material Revenue (million) Forecast, by Application 2020 & 2033
- Table 24: Russia Malleable Refractory Material Revenue (million) Forecast, by Application 2020 & 2033
- Table 25: Benelux Malleable Refractory Material Revenue (million) Forecast, by Application 2020 & 2033
- Table 26: Nordics Malleable Refractory Material Revenue (million) Forecast, by Application 2020 & 2033
- Table 27: Rest of Europe Malleable Refractory Material Revenue (million) Forecast, by Application 2020 & 2033
- Table 28: Global Malleable Refractory Material Revenue million Forecast, by Application 2020 & 2033
- Table 29: Global Malleable Refractory Material Revenue million Forecast, by Type 2020 & 2033
- Table 30: Global Malleable Refractory Material Revenue million Forecast, by Country 2020 & 2033
- Table 31: Turkey Malleable Refractory Material Revenue (million) Forecast, by Application 2020 & 2033
- Table 32: Israel Malleable Refractory Material Revenue (million) Forecast, by Application 2020 & 2033
- Table 33: GCC Malleable Refractory Material Revenue (million) Forecast, by Application 2020 & 2033
- Table 34: North Africa Malleable Refractory Material Revenue (million) Forecast, by Application 2020 & 2033
- Table 35: South Africa Malleable Refractory Material Revenue (million) Forecast, by Application 2020 & 2033
- Table 36: Rest of Middle East & Africa Malleable Refractory Material Revenue (million) Forecast, by Application 2020 & 2033
- Table 37: Global Malleable Refractory Material Revenue million Forecast, by Application 2020 & 2033
- Table 38: Global Malleable Refractory Material Revenue million Forecast, by Type 2020 & 2033
- Table 39: Global Malleable Refractory Material Revenue million Forecast, by Country 2020 & 2033
- Table 40: China Malleable Refractory Material Revenue (million) Forecast, by Application 2020 & 2033
- Table 41: India Malleable Refractory Material Revenue (million) Forecast, by Application 2020 & 2033
- Table 42: Japan Malleable Refractory Material Revenue (million) Forecast, by Application 2020 & 2033
- Table 43: South Korea Malleable Refractory Material Revenue (million) Forecast, by Application 2020 & 2033
- Table 44: ASEAN Malleable Refractory Material Revenue (million) Forecast, by Application 2020 & 2033
- Table 45: Oceania Malleable Refractory Material Revenue (million) Forecast, by Application 2020 & 2033
- Table 46: Rest of Asia Pacific Malleable Refractory Material Revenue (million) Forecast, by Application 2020 & 2033
Frequently Asked Questions
1. What is the projected Compound Annual Growth Rate (CAGR) of the Malleable Refractory Material?
The projected CAGR is approximately 4.7%.
2. Which companies are prominent players in the Malleable Refractory Material?
Key companies in the market include KROSAKI, SHINAGAWA, AGC Ceramics, YOTAI REFRACTORIES, TAIKO Refractories, ROZAI KOGYO KAISHA, ITOCHU CERATECH CORPORATION, Nippon Crucible, Resonac, SAINT-GOBAIN, TYK Corporation, KOA REFRACTRIES.
3. What are the main segments of the Malleable Refractory Material?
The market segments include Application, Type.
4. Can you provide details about the market size?
The market size is estimated to be USD 80.7 million as of 2022.
5. What are some drivers contributing to market growth?
N/A
6. What are the notable trends driving market growth?
N/A
7. Are there any restraints impacting market growth?
N/A
8. Can you provide examples of recent developments in the market?
N/A
9. What pricing options are available for accessing the report?
Pricing options include single-user, multi-user, and enterprise licenses priced at USD 2900.00, USD 4350.00, and USD 5800.00 respectively.
10. Is the market size provided in terms of value or volume?
The market size is provided in terms of value, measured in million.
11. Are there any specific market keywords associated with the report?
Yes, the market keyword associated with the report is "Malleable Refractory Material," which aids in identifying and referencing the specific market segment covered.
12. How do I determine which pricing option suits my needs best?
The pricing options vary based on user requirements and access needs. Individual users may opt for single-user licenses, while businesses requiring broader access may choose multi-user or enterprise licenses for cost-effective access to the report.
13. Are there any additional resources or data provided in the Malleable Refractory Material report?
While the report offers comprehensive insights, it's advisable to review the specific contents or supplementary materials provided to ascertain if additional resources or data are available.
14. How can I stay updated on further developments or reports in the Malleable Refractory Material?
To stay informed about further developments, trends, and reports in the Malleable Refractory Material, consider subscribing to industry newsletters, following relevant companies and organizations, or regularly checking reputable industry news sources and publications.
Methodology
Step 1 - Identification of Relevant Samples Size from Population Database


Step 2 - Approaches for Defining Global Market Size (Value, Volume* & Price*)

Note*: In applicable scenarios
Step 3 - Data Sources
Primary Research
- Web Analytics
- Survey Reports
- Research Institute
- Latest Research Reports
- Opinion Leaders
Secondary Research
- Annual Reports
- White Paper
- Latest Press Release
- Industry Association
- Paid Database
- Investor Presentations

Step 4 - Data Triangulation
Involves using different sources of information in order to increase the validity of a study
These sources are likely to be stakeholders in a program - participants, other researchers, program staff, other community members, and so on.
Then we put all data in single framework & apply various statistical tools to find out the dynamic on the market.
During the analysis stage, feedback from the stakeholder groups would be compared to determine areas of agreement as well as areas of divergence