
Key Insights
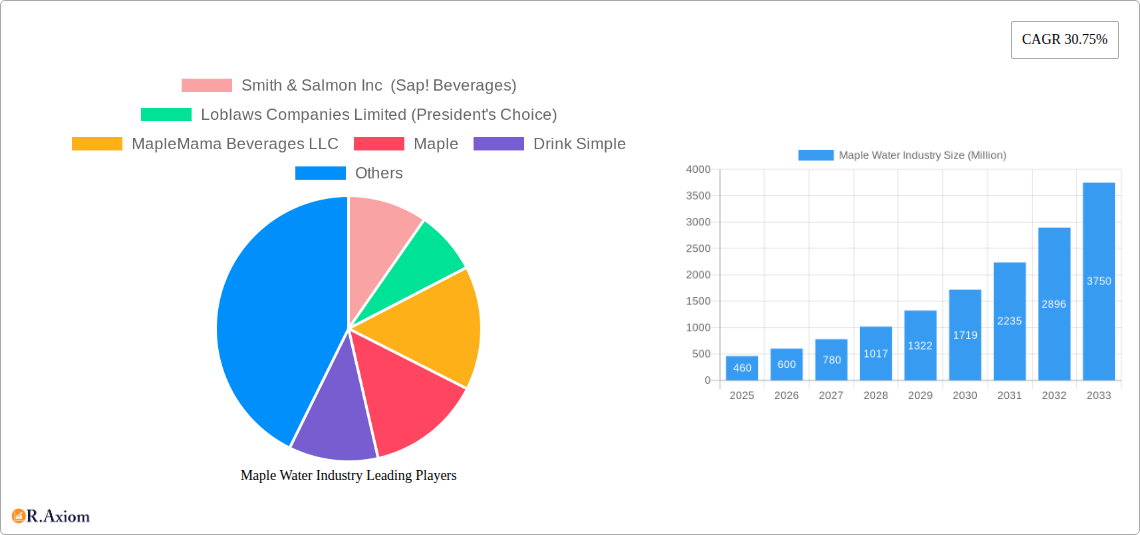
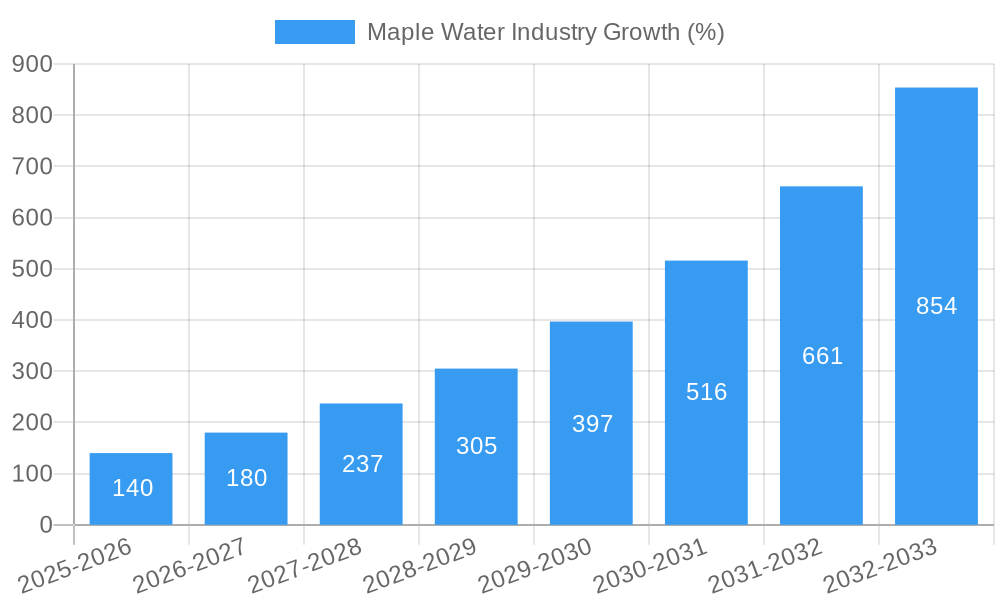
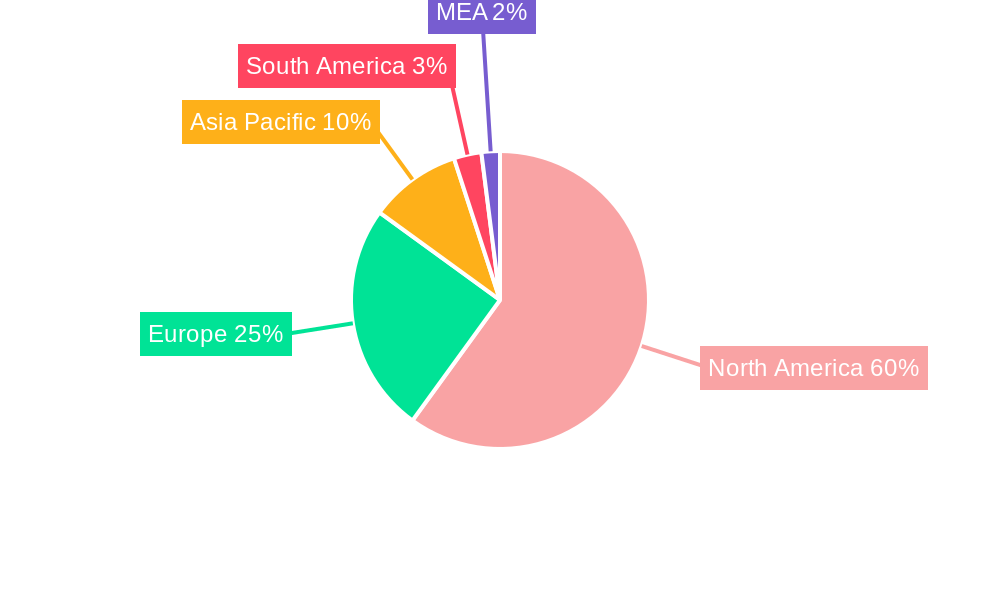
The global maple water market, currently valued at $0.46 billion in 2025, is experiencing robust growth, projected to expand at a compound annual growth rate (CAGR) of 30.75% from 2025 to 2033. This significant expansion is driven by several key factors. Increasing consumer awareness of health and wellness, coupled with the rising popularity of functional beverages, fuels demand for naturally sweet and nutritious alternatives to sugary drinks. Maple water's unique profile, offering electrolytes, antioxidants, and natural sweetness, resonates strongly with health-conscious consumers seeking low-calorie, refreshing options. The growing adoption of plant-based diets and the increasing preference for minimally processed foods further bolster market growth. The market segmentation reveals strong performance across various product types (flavored and unflavored), packaging (bottles, cartons, etc.), and distribution channels (supermarkets, online retail, etc.). North America, particularly the US and Canada, currently dominates the market due to high maple syrup production and strong consumer preference for natural beverages, though significant growth opportunities are projected for the Asia-Pacific region as consumer awareness increases.
The competitive landscape includes both established beverage companies and smaller, niche players. Established brands leverage their distribution networks to enhance market penetration, while smaller companies often focus on innovative product offerings and branding strategies to carve out a niche. Challenges include maintaining consistent supply of high-quality maple sap, managing production costs to remain competitive, and educating consumers on the unique benefits of maple water. Future market growth will depend on ongoing innovation in product development, effective marketing campaigns emphasizing health benefits, and expansion into new geographical markets. Successful strategies will likely involve building strong brand loyalty, forging strategic partnerships, and effectively addressing potential supply chain vulnerabilities. The increasing focus on sustainable sourcing and eco-friendly packaging will also be crucial for long-term market success.
This detailed report provides a comprehensive analysis of the global maple water industry, encompassing market size, growth projections, competitive landscape, and future trends. The study period covers 2019-2033, with 2025 as the base and estimated year. The forecast period spans 2025-2033, and the historical period encompasses 2019-2024. This report is crucial for industry stakeholders, investors, and businesses seeking to understand and capitalize on opportunities within this rapidly evolving market. The report projects a total market value exceeding $XX Million by 2033.
Maple Water Industry Market Concentration & Innovation
This section analyzes the level of market concentration, key innovation drivers, prevailing regulatory frameworks, the presence of substitute products, significant end-user trends, and recent merger and acquisition (M&A) activities within the maple water industry. The highly fragmented nature of the market is examined, with a focus on the market share held by key players such as Smith & Salmon Inc (Sap! Beverages), Loblaws Companies Limited (President's Choice), and MapleMama Beverages LLC. The report quantifies market concentration using metrics like the Herfindahl-Hirschman Index (HHI) and assesses the impact of M&A activities on market dynamics. Analysis reveals that M&A deal values during the period 2019-2024 totaled approximately $XX Million, with several deals aimed at expanding distribution networks and product portfolios.
- Market Concentration: Moderate to low concentration, with no single dominant player.
- Innovation Drivers: Focus on new flavors, sustainable packaging, and health benefits.
- Regulatory Landscape: Analysis of relevant food and beverage regulations across key markets.
- Product Substitutes: Examination of competing beverages like coconut water and other plant-based drinks.
- End-User Trends: Shifting consumer preferences towards healthier and functional beverages.
- M&A Activity: Detailed overview of significant acquisitions and mergers, including deal values and strategic implications.
Maple Water Industry Industry Trends & Insights
This section delves into the key trends shaping the maple water industry. We analyze market growth drivers, the impact of technological disruptions, evolving consumer preferences, and the competitive dynamics amongst key players. The report projects a Compound Annual Growth Rate (CAGR) of XX% during the forecast period (2025-2033), driven by increasing consumer awareness of the health benefits of maple water and expanding distribution channels. Market penetration is expected to reach XX% by 2033. Detailed analysis of consumer preferences reveals a growing demand for flavored maple water and sustainable packaging solutions. Competitive dynamics are characterized by both intense rivalry among established players and the emergence of new entrants. The report includes a detailed competitive analysis, including Porter’s Five Forces analysis.
Dominant Markets & Segments in Maple Water Industry
This section identifies the leading geographical regions, countries, and market segments within the maple water industry. The analysis focuses on product type (flavored vs. unflavored), packaging type (bottles, cartons/Tetra Pak, other), and distribution channel (supermarkets/hypermarkets, convenience stores, specialty stores, online retail stores, other). The North American market is projected to remain dominant throughout the forecast period, driven by high consumer adoption and established production capabilities.
Key Drivers of Segment Dominance:
- Product Type: Growing preference for flavored maple water due to its enhanced taste appeal.
- Packaging Type: Bottles hold significant market share, with a gradual shift towards sustainable cartons/Tetra Pak.
- Distribution Channel: Supermarkets/hypermarkets represent the largest distribution channel, with growing online retail presence.
Dominant Regions and Countries: Detailed analysis of market size and growth potential in key regions and countries, including factors such as economic policies and infrastructure development.
Maple Water Industry Product Developments
Recent innovations in maple water products have focused on expanding flavor profiles, improving shelf life, and enhancing functional benefits. Companies are exploring new packaging formats, such as single-serve pouches, to improve convenience and reduce waste. This technological focus on improved sustainability and product diversification caters to growing consumer preferences for healthier and more convenient beverage options, leading to a stronger market fit.
Report Scope & Segmentation Analysis
This report segments the maple water market based on product type (flavored, unflavored), packaging type (bottles, cartons/Tetra Pak, other), and distribution channel (supermarkets/hypermarkets, convenience stores, specialty stores, online retail stores, other). Each segment is analyzed in detail, including market size, growth projections, and competitive dynamics. The report provides forecasts for each segment throughout the forecast period, detailing expected market share and growth trajectories.
- Product Type Segmentation: Includes market size, growth projections, and competitive analysis for both flavored and unflavored maple water.
- Packaging Type Segmentation: Detailed analysis of market shares for bottles, cartons/Tetra Pak, and other packaging types.
- Distribution Channel Segmentation: Examination of sales and growth projections for each distribution channel, including online sales growth.
Key Drivers of Maple Water Industry Growth
The growth of the maple water industry is driven by several key factors: rising consumer awareness of the health benefits associated with maple water, growing demand for natural and functional beverages, increasing disposable incomes in developing countries, and the development of innovative product formats and packaging solutions that enhance consumer experience. Furthermore, favorable government regulations and support for the maple syrup industry promote the overall growth of the maple water sector.
Challenges in the Maple Water Industry Sector
The maple water industry faces challenges such as seasonal production limitations, relatively high production costs compared to other beverages, and intense competition from established beverage brands. Supply chain disruptions and regulatory hurdles in certain regions also pose significant obstacles to industry expansion. These factors can collectively lead to price fluctuations and limit market growth potential.
Emerging Opportunities in Maple Water Industry
Emerging opportunities include expanding into new geographical markets, developing functional and fortified maple water products (e.g., added vitamins and minerals), leveraging online retail channels, and partnerships with food and beverage companies to integrate maple water into existing product lines. Exploration of new innovative packaging solutions and utilizing sustainable sourcing practices present further opportunities for market expansion.
Leading Players in the Maple Water Industry Market
- Smith & Salmon Inc (Sap! Beverages)
- Loblaws Companies Limited (President's Choice)
- MapleMama Beverages LLC
- Maple
- Drink Simple
- Lower Valley Beverage Co (sapsucker)
- Kiki Maple Water
- Feronia Forests LLC (Vertical Water)
- Pure Maple Water Company Ltd
- Asarasi
Key Developments in Maple Water Industry Industry
- 2022-Q4: Smith & Salmon Inc launched a new line of flavored maple water.
- 2023-Q1: MapleMama Beverages LLC secured a major distribution deal with a national supermarket chain.
- 2023-Q2: A new study highlighting the health benefits of maple water was published. (Further details on other significant developments, including specific dates and impacts, would be included in the full report.)
Strategic Outlook for Maple Water Industry Market
The maple water industry is poised for significant growth over the next decade, driven by increasing consumer demand for healthier beverages and ongoing product innovation. The market's future potential is substantial, particularly in emerging markets and through further development of value-added products. Continued investment in research and development and sustainable production practices will be critical for long-term success.
Maple Water Industry Segmentation
-
1. Product Type
- 1.1. Flavored
- 1.2. Unflavored
-
2. Packaging Type
- 2.1. Bottles
- 2.2. Cartons/Tetra Pak
- 2.3. Other Packaging Types
-
3. Distribution Channel
- 3.1. Supermarkets/Hypermarkets
- 3.2. Convenience Stores
- 3.3. Specialty Stores
- 3.4. Online Retail Stores
- 3.5. Other Distribution Channels
Maple Water Industry Segmentation By Geography
-
1. North America
- 1.1. United States
- 1.2. Canada
- 1.3. Mexico
- 1.4. Rest of North America
-
2. Europe
- 2.1. Germany
- 2.2. United Kingdom
- 2.3. France
- 2.4. Italy
- 2.5. Spain
- 2.6. Rest of Europe
-
3. Asia Pacific
- 3.1. China
- 3.2. India
- 3.3. Australia
- 3.4. Japan
-
4. Rest of the World
- 4.1. South America
- 4.2. Middle East and Africa
Maple Water Industry REPORT HIGHLIGHTS
| Aspects | Details |
|---|---|
| Study Period | 2019-2033 |
| Base Year | 2024 |
| Estimated Year | 2025 |
| Forecast Period | 2025-2033 |
| Historical Period | 2019-2024 |
| Growth Rate | CAGR of 30.75% from 2019-2033 |
| Segmentation |
|
Table of Contents
- 1. Introduction
- 1.1. Research Scope
- 1.2. Market Segmentation
- 1.3. Research Methodology
- 1.4. Definitions and Assumptions
- 2. Executive Summary
- 2.1. Introduction
- 3. Market Dynamics
- 3.1. Introduction
- 3.2. Market Drivers
- 3.2.1. Popularization of Adventure Sports and Expedition; Suitability of the Freeze-Dried Technique for Heat Sensitive Food Products
- 3.3. Market Restrains
- 3.3.1. High Cost Associated with the Freeze-Drying Technology
- 3.4. Market Trends
- 3.4.1. Value-added Hydration is Evolving Consumer Preferences in the Maple Water Market
- 4. Market Factor Analysis
- 4.1. Porters Five Forces
- 4.2. Supply/Value Chain
- 4.3. PESTEL analysis
- 4.4. Market Entropy
- 4.5. Patent/Trademark Analysis
- 5. Global Maple Water Industry Analysis, Insights and Forecast, 2019-2031
- 5.1. Market Analysis, Insights and Forecast - by Product Type
- 5.1.1. Flavored
- 5.1.2. Unflavored
- 5.2. Market Analysis, Insights and Forecast - by Packaging Type
- 5.2.1. Bottles
- 5.2.2. Cartons/Tetra Pak
- 5.2.3. Other Packaging Types
- 5.3. Market Analysis, Insights and Forecast - by Distribution Channel
- 5.3.1. Supermarkets/Hypermarkets
- 5.3.2. Convenience Stores
- 5.3.3. Specialty Stores
- 5.3.4. Online Retail Stores
- 5.3.5. Other Distribution Channels
- 5.4. Market Analysis, Insights and Forecast - by Region
- 5.4.1. North America
- 5.4.2. Europe
- 5.4.3. Asia Pacific
- 5.4.4. Rest of the World
- 5.1. Market Analysis, Insights and Forecast - by Product Type
- 6. North America Maple Water Industry Analysis, Insights and Forecast, 2019-2031
- 6.1. Market Analysis, Insights and Forecast - by Product Type
- 6.1.1. Flavored
- 6.1.2. Unflavored
- 6.2. Market Analysis, Insights and Forecast - by Packaging Type
- 6.2.1. Bottles
- 6.2.2. Cartons/Tetra Pak
- 6.2.3. Other Packaging Types
- 6.3. Market Analysis, Insights and Forecast - by Distribution Channel
- 6.3.1. Supermarkets/Hypermarkets
- 6.3.2. Convenience Stores
- 6.3.3. Specialty Stores
- 6.3.4. Online Retail Stores
- 6.3.5. Other Distribution Channels
- 6.1. Market Analysis, Insights and Forecast - by Product Type
- 7. Europe Maple Water Industry Analysis, Insights and Forecast, 2019-2031
- 7.1. Market Analysis, Insights and Forecast - by Product Type
- 7.1.1. Flavored
- 7.1.2. Unflavored
- 7.2. Market Analysis, Insights and Forecast - by Packaging Type
- 7.2.1. Bottles
- 7.2.2. Cartons/Tetra Pak
- 7.2.3. Other Packaging Types
- 7.3. Market Analysis, Insights and Forecast - by Distribution Channel
- 7.3.1. Supermarkets/Hypermarkets
- 7.3.2. Convenience Stores
- 7.3.3. Specialty Stores
- 7.3.4. Online Retail Stores
- 7.3.5. Other Distribution Channels
- 7.1. Market Analysis, Insights and Forecast - by Product Type
- 8. Asia Pacific Maple Water Industry Analysis, Insights and Forecast, 2019-2031
- 8.1. Market Analysis, Insights and Forecast - by Product Type
- 8.1.1. Flavored
- 8.1.2. Unflavored
- 8.2. Market Analysis, Insights and Forecast - by Packaging Type
- 8.2.1. Bottles
- 8.2.2. Cartons/Tetra Pak
- 8.2.3. Other Packaging Types
- 8.3. Market Analysis, Insights and Forecast - by Distribution Channel
- 8.3.1. Supermarkets/Hypermarkets
- 8.3.2. Convenience Stores
- 8.3.3. Specialty Stores
- 8.3.4. Online Retail Stores
- 8.3.5. Other Distribution Channels
- 8.1. Market Analysis, Insights and Forecast - by Product Type
- 9. Rest of the World Maple Water Industry Analysis, Insights and Forecast, 2019-2031
- 9.1. Market Analysis, Insights and Forecast - by Product Type
- 9.1.1. Flavored
- 9.1.2. Unflavored
- 9.2. Market Analysis, Insights and Forecast - by Packaging Type
- 9.2.1. Bottles
- 9.2.2. Cartons/Tetra Pak
- 9.2.3. Other Packaging Types
- 9.3. Market Analysis, Insights and Forecast - by Distribution Channel
- 9.3.1. Supermarkets/Hypermarkets
- 9.3.2. Convenience Stores
- 9.3.3. Specialty Stores
- 9.3.4. Online Retail Stores
- 9.3.5. Other Distribution Channels
- 9.1. Market Analysis, Insights and Forecast - by Product Type
- 10. North America Maple Water Industry Analysis, Insights and Forecast, 2019-2031
- 10.1. Market Analysis, Insights and Forecast - By Country/Sub-region
- 10.1.1 United States
- 10.1.2 Canada
- 10.1.3 Mexico
- 11. Europe Maple Water Industry Analysis, Insights and Forecast, 2019-2031
- 11.1. Market Analysis, Insights and Forecast - By Country/Sub-region
- 11.1.1 Germany
- 11.1.2 United Kingdom
- 11.1.3 France
- 11.1.4 Spain
- 11.1.5 Italy
- 11.1.6 Spain
- 11.1.7 Belgium
- 11.1.8 Netherland
- 11.1.9 Nordics
- 11.1.10 Rest of Europe
- 12. Asia Pacific Maple Water Industry Analysis, Insights and Forecast, 2019-2031
- 12.1. Market Analysis, Insights and Forecast - By Country/Sub-region
- 12.1.1 China
- 12.1.2 Japan
- 12.1.3 India
- 12.1.4 South Korea
- 12.1.5 Southeast Asia
- 12.1.6 Australia
- 12.1.7 Indonesia
- 12.1.8 Phillipes
- 12.1.9 Singapore
- 12.1.10 Thailandc
- 12.1.11 Rest of Asia Pacific
- 13. South America Maple Water Industry Analysis, Insights and Forecast, 2019-2031
- 13.1. Market Analysis, Insights and Forecast - By Country/Sub-region
- 13.1.1 Brazil
- 13.1.2 Argentina
- 13.1.3 Peru
- 13.1.4 Chile
- 13.1.5 Colombia
- 13.1.6 Ecuador
- 13.1.7 Venezuela
- 13.1.8 Rest of South America
- 14. North America Maple Water Industry Analysis, Insights and Forecast, 2019-2031
- 14.1. Market Analysis, Insights and Forecast - By Country/Sub-region
- 14.1.1 United States
- 14.1.2 Canada
- 14.1.3 Mexico
- 15. MEA Maple Water Industry Analysis, Insights and Forecast, 2019-2031
- 15.1. Market Analysis, Insights and Forecast - By Country/Sub-region
- 15.1.1 United Arab Emirates
- 15.1.2 Saudi Arabia
- 15.1.3 South Africa
- 15.1.4 Rest of Middle East and Africa
- 16. Competitive Analysis
- 16.1. Global Market Share Analysis 2024
- 16.2. Company Profiles
- 16.2.1 Smith & Salmon Inc (Sap! Beverages)
- 16.2.1.1. Overview
- 16.2.1.2. Products
- 16.2.1.3. SWOT Analysis
- 16.2.1.4. Recent Developments
- 16.2.1.5. Financials (Based on Availability)
- 16.2.2 Loblaws Companies Limited (President's Choice)
- 16.2.2.1. Overview
- 16.2.2.2. Products
- 16.2.2.3. SWOT Analysis
- 16.2.2.4. Recent Developments
- 16.2.2.5. Financials (Based on Availability)
- 16.2.3 MapleMama Beverages LLC
- 16.2.3.1. Overview
- 16.2.3.2. Products
- 16.2.3.3. SWOT Analysis
- 16.2.3.4. Recent Developments
- 16.2.3.5. Financials (Based on Availability)
- 16.2.4 Maple
- 16.2.4.1. Overview
- 16.2.4.2. Products
- 16.2.4.3. SWOT Analysis
- 16.2.4.4. Recent Developments
- 16.2.4.5. Financials (Based on Availability)
- 16.2.5 Drink Simple
- 16.2.5.1. Overview
- 16.2.5.2. Products
- 16.2.5.3. SWOT Analysis
- 16.2.5.4. Recent Developments
- 16.2.5.5. Financials (Based on Availability)
- 16.2.6 Lower Valley Beverage Co(sapsucker)*List Not Exhaustive
- 16.2.6.1. Overview
- 16.2.6.2. Products
- 16.2.6.3. SWOT Analysis
- 16.2.6.4. Recent Developments
- 16.2.6.5. Financials (Based on Availability)
- 16.2.7 Kiki Maple Water
- 16.2.7.1. Overview
- 16.2.7.2. Products
- 16.2.7.3. SWOT Analysis
- 16.2.7.4. Recent Developments
- 16.2.7.5. Financials (Based on Availability)
- 16.2.8 Feronia Forests LLC (Vertical Water)
- 16.2.8.1. Overview
- 16.2.8.2. Products
- 16.2.8.3. SWOT Analysis
- 16.2.8.4. Recent Developments
- 16.2.8.5. Financials (Based on Availability)
- 16.2.9 Pure Maple Water Company Ltd
- 16.2.9.1. Overview
- 16.2.9.2. Products
- 16.2.9.3. SWOT Analysis
- 16.2.9.4. Recent Developments
- 16.2.9.5. Financials (Based on Availability)
- 16.2.10 Asarasi
- 16.2.10.1. Overview
- 16.2.10.2. Products
- 16.2.10.3. SWOT Analysis
- 16.2.10.4. Recent Developments
- 16.2.10.5. Financials (Based on Availability)
- 16.2.1 Smith & Salmon Inc (Sap! Beverages)
List of Figures
- Figure 1: Global Maple Water Industry Revenue Breakdown (Million, %) by Region 2024 & 2032
- Figure 2: North America Maple Water Industry Revenue (Million), by Country 2024 & 2032
- Figure 3: North America Maple Water Industry Revenue Share (%), by Country 2024 & 2032
- Figure 4: Europe Maple Water Industry Revenue (Million), by Country 2024 & 2032
- Figure 5: Europe Maple Water Industry Revenue Share (%), by Country 2024 & 2032
- Figure 6: Asia Pacific Maple Water Industry Revenue (Million), by Country 2024 & 2032
- Figure 7: Asia Pacific Maple Water Industry Revenue Share (%), by Country 2024 & 2032
- Figure 8: South America Maple Water Industry Revenue (Million), by Country 2024 & 2032
- Figure 9: South America Maple Water Industry Revenue Share (%), by Country 2024 & 2032
- Figure 10: North America Maple Water Industry Revenue (Million), by Country 2024 & 2032
- Figure 11: North America Maple Water Industry Revenue Share (%), by Country 2024 & 2032
- Figure 12: MEA Maple Water Industry Revenue (Million), by Country 2024 & 2032
- Figure 13: MEA Maple Water Industry Revenue Share (%), by Country 2024 & 2032
- Figure 14: North America Maple Water Industry Revenue (Million), by Product Type 2024 & 2032
- Figure 15: North America Maple Water Industry Revenue Share (%), by Product Type 2024 & 2032
- Figure 16: North America Maple Water Industry Revenue (Million), by Packaging Type 2024 & 2032
- Figure 17: North America Maple Water Industry Revenue Share (%), by Packaging Type 2024 & 2032
- Figure 18: North America Maple Water Industry Revenue (Million), by Distribution Channel 2024 & 2032
- Figure 19: North America Maple Water Industry Revenue Share (%), by Distribution Channel 2024 & 2032
- Figure 20: North America Maple Water Industry Revenue (Million), by Country 2024 & 2032
- Figure 21: North America Maple Water Industry Revenue Share (%), by Country 2024 & 2032
- Figure 22: Europe Maple Water Industry Revenue (Million), by Product Type 2024 & 2032
- Figure 23: Europe Maple Water Industry Revenue Share (%), by Product Type 2024 & 2032
- Figure 24: Europe Maple Water Industry Revenue (Million), by Packaging Type 2024 & 2032
- Figure 25: Europe Maple Water Industry Revenue Share (%), by Packaging Type 2024 & 2032
- Figure 26: Europe Maple Water Industry Revenue (Million), by Distribution Channel 2024 & 2032
- Figure 27: Europe Maple Water Industry Revenue Share (%), by Distribution Channel 2024 & 2032
- Figure 28: Europe Maple Water Industry Revenue (Million), by Country 2024 & 2032
- Figure 29: Europe Maple Water Industry Revenue Share (%), by Country 2024 & 2032
- Figure 30: Asia Pacific Maple Water Industry Revenue (Million), by Product Type 2024 & 2032
- Figure 31: Asia Pacific Maple Water Industry Revenue Share (%), by Product Type 2024 & 2032
- Figure 32: Asia Pacific Maple Water Industry Revenue (Million), by Packaging Type 2024 & 2032
- Figure 33: Asia Pacific Maple Water Industry Revenue Share (%), by Packaging Type 2024 & 2032
- Figure 34: Asia Pacific Maple Water Industry Revenue (Million), by Distribution Channel 2024 & 2032
- Figure 35: Asia Pacific Maple Water Industry Revenue Share (%), by Distribution Channel 2024 & 2032
- Figure 36: Asia Pacific Maple Water Industry Revenue (Million), by Country 2024 & 2032
- Figure 37: Asia Pacific Maple Water Industry Revenue Share (%), by Country 2024 & 2032
- Figure 38: Rest of the World Maple Water Industry Revenue (Million), by Product Type 2024 & 2032
- Figure 39: Rest of the World Maple Water Industry Revenue Share (%), by Product Type 2024 & 2032
- Figure 40: Rest of the World Maple Water Industry Revenue (Million), by Packaging Type 2024 & 2032
- Figure 41: Rest of the World Maple Water Industry Revenue Share (%), by Packaging Type 2024 & 2032
- Figure 42: Rest of the World Maple Water Industry Revenue (Million), by Distribution Channel 2024 & 2032
- Figure 43: Rest of the World Maple Water Industry Revenue Share (%), by Distribution Channel 2024 & 2032
- Figure 44: Rest of the World Maple Water Industry Revenue (Million), by Country 2024 & 2032
- Figure 45: Rest of the World Maple Water Industry Revenue Share (%), by Country 2024 & 2032
List of Tables
- Table 1: Global Maple Water Industry Revenue Million Forecast, by Region 2019 & 2032
- Table 2: Global Maple Water Industry Revenue Million Forecast, by Product Type 2019 & 2032
- Table 3: Global Maple Water Industry Revenue Million Forecast, by Packaging Type 2019 & 2032
- Table 4: Global Maple Water Industry Revenue Million Forecast, by Distribution Channel 2019 & 2032
- Table 5: Global Maple Water Industry Revenue Million Forecast, by Region 2019 & 2032
- Table 6: Global Maple Water Industry Revenue Million Forecast, by Country 2019 & 2032
- Table 7: United States Maple Water Industry Revenue (Million) Forecast, by Application 2019 & 2032
- Table 8: Canada Maple Water Industry Revenue (Million) Forecast, by Application 2019 & 2032
- Table 9: Mexico Maple Water Industry Revenue (Million) Forecast, by Application 2019 & 2032
- Table 10: Global Maple Water Industry Revenue Million Forecast, by Country 2019 & 2032
- Table 11: Germany Maple Water Industry Revenue (Million) Forecast, by Application 2019 & 2032
- Table 12: United Kingdom Maple Water Industry Revenue (Million) Forecast, by Application 2019 & 2032
- Table 13: France Maple Water Industry Revenue (Million) Forecast, by Application 2019 & 2032
- Table 14: Spain Maple Water Industry Revenue (Million) Forecast, by Application 2019 & 2032
- Table 15: Italy Maple Water Industry Revenue (Million) Forecast, by Application 2019 & 2032
- Table 16: Spain Maple Water Industry Revenue (Million) Forecast, by Application 2019 & 2032
- Table 17: Belgium Maple Water Industry Revenue (Million) Forecast, by Application 2019 & 2032
- Table 18: Netherland Maple Water Industry Revenue (Million) Forecast, by Application 2019 & 2032
- Table 19: Nordics Maple Water Industry Revenue (Million) Forecast, by Application 2019 & 2032
- Table 20: Rest of Europe Maple Water Industry Revenue (Million) Forecast, by Application 2019 & 2032
- Table 21: Global Maple Water Industry Revenue Million Forecast, by Country 2019 & 2032
- Table 22: China Maple Water Industry Revenue (Million) Forecast, by Application 2019 & 2032
- Table 23: Japan Maple Water Industry Revenue (Million) Forecast, by Application 2019 & 2032
- Table 24: India Maple Water Industry Revenue (Million) Forecast, by Application 2019 & 2032
- Table 25: South Korea Maple Water Industry Revenue (Million) Forecast, by Application 2019 & 2032
- Table 26: Southeast Asia Maple Water Industry Revenue (Million) Forecast, by Application 2019 & 2032
- Table 27: Australia Maple Water Industry Revenue (Million) Forecast, by Application 2019 & 2032
- Table 28: Indonesia Maple Water Industry Revenue (Million) Forecast, by Application 2019 & 2032
- Table 29: Phillipes Maple Water Industry Revenue (Million) Forecast, by Application 2019 & 2032
- Table 30: Singapore Maple Water Industry Revenue (Million) Forecast, by Application 2019 & 2032
- Table 31: Thailandc Maple Water Industry Revenue (Million) Forecast, by Application 2019 & 2032
- Table 32: Rest of Asia Pacific Maple Water Industry Revenue (Million) Forecast, by Application 2019 & 2032
- Table 33: Global Maple Water Industry Revenue Million Forecast, by Country 2019 & 2032
- Table 34: Brazil Maple Water Industry Revenue (Million) Forecast, by Application 2019 & 2032
- Table 35: Argentina Maple Water Industry Revenue (Million) Forecast, by Application 2019 & 2032
- Table 36: Peru Maple Water Industry Revenue (Million) Forecast, by Application 2019 & 2032
- Table 37: Chile Maple Water Industry Revenue (Million) Forecast, by Application 2019 & 2032
- Table 38: Colombia Maple Water Industry Revenue (Million) Forecast, by Application 2019 & 2032
- Table 39: Ecuador Maple Water Industry Revenue (Million) Forecast, by Application 2019 & 2032
- Table 40: Venezuela Maple Water Industry Revenue (Million) Forecast, by Application 2019 & 2032
- Table 41: Rest of South America Maple Water Industry Revenue (Million) Forecast, by Application 2019 & 2032
- Table 42: Global Maple Water Industry Revenue Million Forecast, by Country 2019 & 2032
- Table 43: United States Maple Water Industry Revenue (Million) Forecast, by Application 2019 & 2032
- Table 44: Canada Maple Water Industry Revenue (Million) Forecast, by Application 2019 & 2032
- Table 45: Mexico Maple Water Industry Revenue (Million) Forecast, by Application 2019 & 2032
- Table 46: Global Maple Water Industry Revenue Million Forecast, by Country 2019 & 2032
- Table 47: United Arab Emirates Maple Water Industry Revenue (Million) Forecast, by Application 2019 & 2032
- Table 48: Saudi Arabia Maple Water Industry Revenue (Million) Forecast, by Application 2019 & 2032
- Table 49: South Africa Maple Water Industry Revenue (Million) Forecast, by Application 2019 & 2032
- Table 50: Rest of Middle East and Africa Maple Water Industry Revenue (Million) Forecast, by Application 2019 & 2032
- Table 51: Global Maple Water Industry Revenue Million Forecast, by Product Type 2019 & 2032
- Table 52: Global Maple Water Industry Revenue Million Forecast, by Packaging Type 2019 & 2032
- Table 53: Global Maple Water Industry Revenue Million Forecast, by Distribution Channel 2019 & 2032
- Table 54: Global Maple Water Industry Revenue Million Forecast, by Country 2019 & 2032
- Table 55: United States Maple Water Industry Revenue (Million) Forecast, by Application 2019 & 2032
- Table 56: Canada Maple Water Industry Revenue (Million) Forecast, by Application 2019 & 2032
- Table 57: Mexico Maple Water Industry Revenue (Million) Forecast, by Application 2019 & 2032
- Table 58: Rest of North America Maple Water Industry Revenue (Million) Forecast, by Application 2019 & 2032
- Table 59: Global Maple Water Industry Revenue Million Forecast, by Product Type 2019 & 2032
- Table 60: Global Maple Water Industry Revenue Million Forecast, by Packaging Type 2019 & 2032
- Table 61: Global Maple Water Industry Revenue Million Forecast, by Distribution Channel 2019 & 2032
- Table 62: Global Maple Water Industry Revenue Million Forecast, by Country 2019 & 2032
- Table 63: Germany Maple Water Industry Revenue (Million) Forecast, by Application 2019 & 2032
- Table 64: United Kingdom Maple Water Industry Revenue (Million) Forecast, by Application 2019 & 2032
- Table 65: France Maple Water Industry Revenue (Million) Forecast, by Application 2019 & 2032
- Table 66: Italy Maple Water Industry Revenue (Million) Forecast, by Application 2019 & 2032
- Table 67: Spain Maple Water Industry Revenue (Million) Forecast, by Application 2019 & 2032
- Table 68: Rest of Europe Maple Water Industry Revenue (Million) Forecast, by Application 2019 & 2032
- Table 69: Global Maple Water Industry Revenue Million Forecast, by Product Type 2019 & 2032
- Table 70: Global Maple Water Industry Revenue Million Forecast, by Packaging Type 2019 & 2032
- Table 71: Global Maple Water Industry Revenue Million Forecast, by Distribution Channel 2019 & 2032
- Table 72: Global Maple Water Industry Revenue Million Forecast, by Country 2019 & 2032
- Table 73: China Maple Water Industry Revenue (Million) Forecast, by Application 2019 & 2032
- Table 74: India Maple Water Industry Revenue (Million) Forecast, by Application 2019 & 2032
- Table 75: Australia Maple Water Industry Revenue (Million) Forecast, by Application 2019 & 2032
- Table 76: Japan Maple Water Industry Revenue (Million) Forecast, by Application 2019 & 2032
- Table 77: Global Maple Water Industry Revenue Million Forecast, by Product Type 2019 & 2032
- Table 78: Global Maple Water Industry Revenue Million Forecast, by Packaging Type 2019 & 2032
- Table 79: Global Maple Water Industry Revenue Million Forecast, by Distribution Channel 2019 & 2032
- Table 80: Global Maple Water Industry Revenue Million Forecast, by Country 2019 & 2032
- Table 81: South America Maple Water Industry Revenue (Million) Forecast, by Application 2019 & 2032
- Table 82: Middle East and Africa Maple Water Industry Revenue (Million) Forecast, by Application 2019 & 2032
Frequently Asked Questions
1. What is the projected Compound Annual Growth Rate (CAGR) of the Maple Water Industry?
The projected CAGR is approximately 30.75%.
2. Which companies are prominent players in the Maple Water Industry?
Key companies in the market include Smith & Salmon Inc (Sap! Beverages), Loblaws Companies Limited (President's Choice), MapleMama Beverages LLC, Maple, Drink Simple, Lower Valley Beverage Co(sapsucker)*List Not Exhaustive, Kiki Maple Water, Feronia Forests LLC (Vertical Water), Pure Maple Water Company Ltd, Asarasi.
3. What are the main segments of the Maple Water Industry?
The market segments include Product Type, Packaging Type, Distribution Channel.
4. Can you provide details about the market size?
The market size is estimated to be USD 0.46 Million as of 2022.
5. What are some drivers contributing to market growth?
Popularization of Adventure Sports and Expedition; Suitability of the Freeze-Dried Technique for Heat Sensitive Food Products.
6. What are the notable trends driving market growth?
Value-added Hydration is Evolving Consumer Preferences in the Maple Water Market.
7. Are there any restraints impacting market growth?
High Cost Associated with the Freeze-Drying Technology.
8. Can you provide examples of recent developments in the market?
N/A
9. What pricing options are available for accessing the report?
Pricing options include single-user, multi-user, and enterprise licenses priced at USD 4750, USD 5250, and USD 8750 respectively.
10. Is the market size provided in terms of value or volume?
The market size is provided in terms of value, measured in Million.
11. Are there any specific market keywords associated with the report?
Yes, the market keyword associated with the report is "Maple Water Industry," which aids in identifying and referencing the specific market segment covered.
12. How do I determine which pricing option suits my needs best?
The pricing options vary based on user requirements and access needs. Individual users may opt for single-user licenses, while businesses requiring broader access may choose multi-user or enterprise licenses for cost-effective access to the report.
13. Are there any additional resources or data provided in the Maple Water Industry report?
While the report offers comprehensive insights, it's advisable to review the specific contents or supplementary materials provided to ascertain if additional resources or data are available.
14. How can I stay updated on further developments or reports in the Maple Water Industry?
To stay informed about further developments, trends, and reports in the Maple Water Industry, consider subscribing to industry newsletters, following relevant companies and organizations, or regularly checking reputable industry news sources and publications.
Methodology
Step 1 - Identification of Relevant Samples Size from Population Database


Step 2 - Approaches for Defining Global Market Size (Value, Volume* & Price*)

Note*: In applicable scenarios
Step 3 - Data Sources
Primary Research
- Web Analytics
- Survey Reports
- Research Institute
- Latest Research Reports
- Opinion Leaders
Secondary Research
- Annual Reports
- White Paper
- Latest Press Release
- Industry Association
- Paid Database
- Investor Presentations

Step 4 - Data Triangulation
Involves using different sources of information in order to increase the validity of a study
These sources are likely to be stakeholders in a program - participants, other researchers, program staff, other community members, and so on.
Then we put all data in single framework & apply various statistical tools to find out the dynamic on the market.
During the analysis stage, feedback from the stakeholder groups would be compared to determine areas of agreement as well as areas of divergence


