
Key Insights
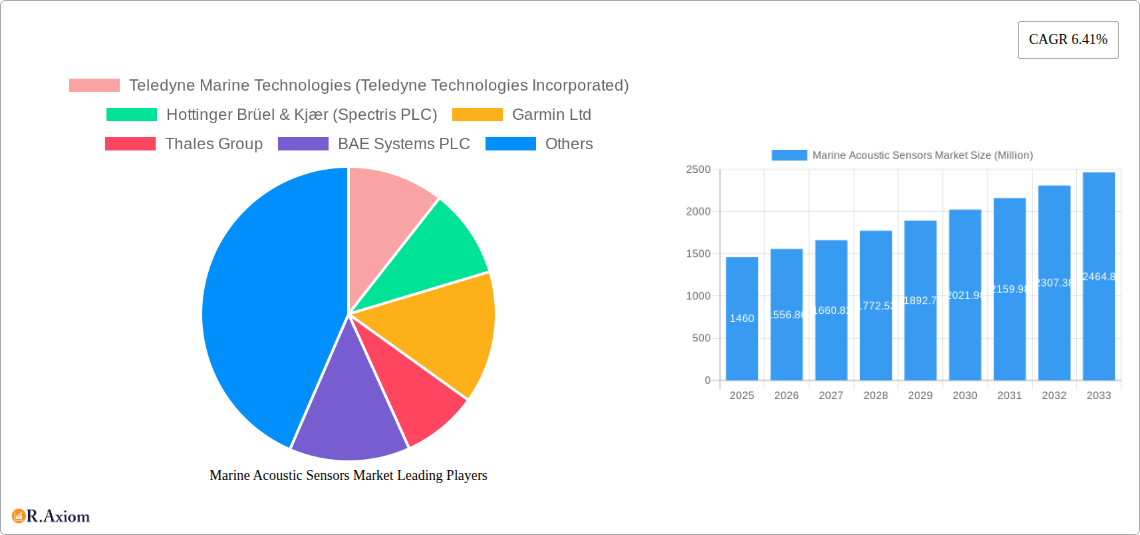
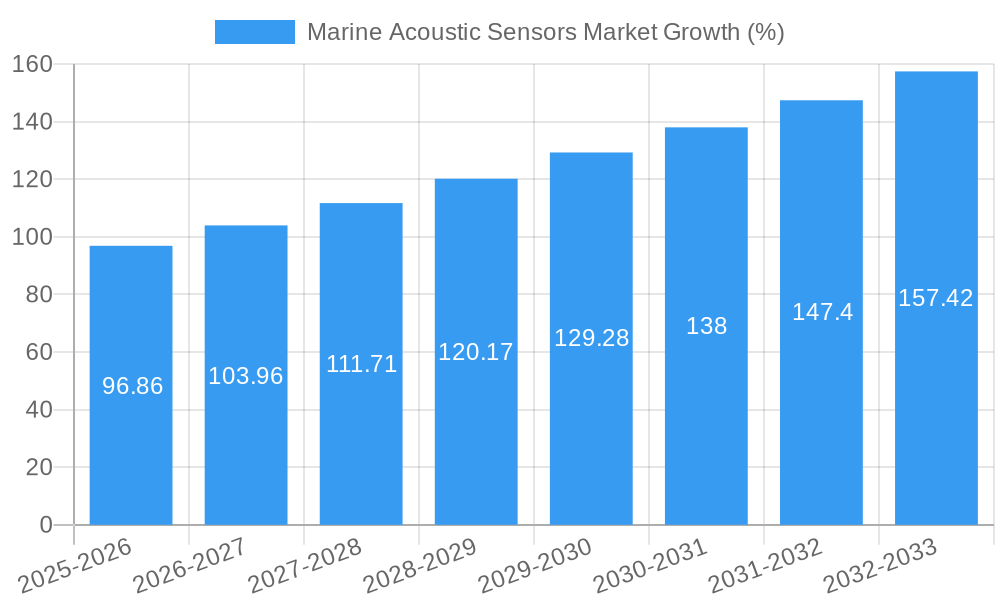
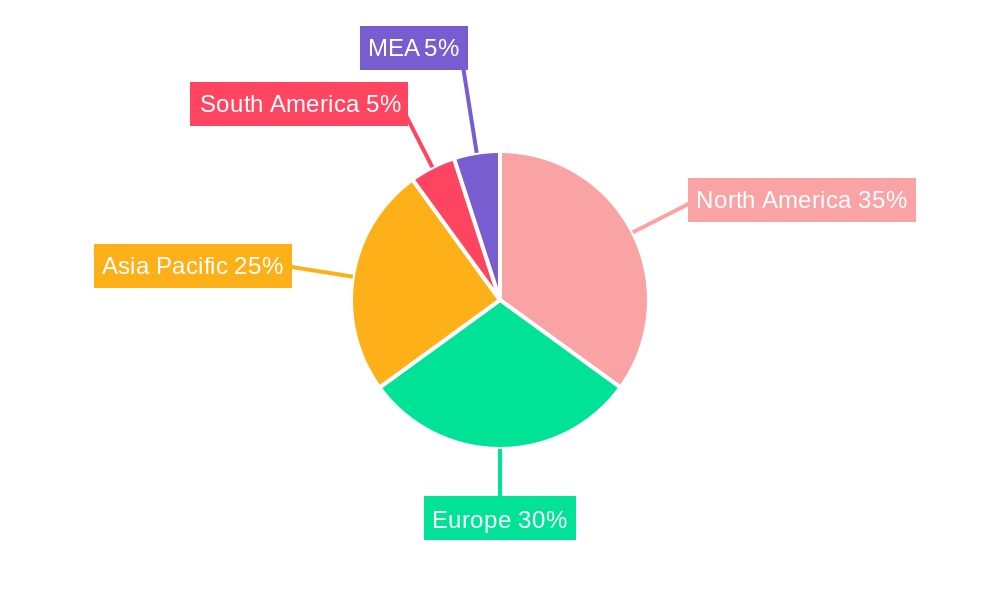
The global marine acoustic sensors market, valued at $1.46 billion in 2025, is projected to experience robust growth, driven by increasing demand for advanced underwater surveillance and exploration technologies. This growth is further fueled by rising investments in offshore oil and gas exploration, expanding maritime security concerns, and the growing adoption of autonomous underwater vehicles (AUVs) and remotely operated vehicles (ROVs). Key segments driving market expansion include hydrophones, crucial for passive acoustic monitoring; underwater transducers, essential for active sonar systems; acoustic towed arrays, enabling long-range detection; and side-scan sonar, vital for seabed mapping and object detection. The market's growth is also influenced by technological advancements in sensor miniaturization, improved signal processing capabilities, and the development of more energy-efficient sensor designs. Geographic expansion is also a significant driver, with North America and Europe currently holding substantial market share, yet considerable potential exists in rapidly developing regions like Asia-Pacific, owing to increased investment in marine infrastructure and research.
Despite the positive outlook, the market faces certain challenges. High initial investment costs associated with sophisticated sensor systems and their integration can act as a restraint for smaller companies and research institutions. Furthermore, the complex deployment and maintenance requirements of underwater sensors, along with the need for specialized expertise, pose potential barriers. However, ongoing technological innovation, particularly in the area of wireless sensor networks and data analytics, is expected to mitigate these challenges and continue to support market growth. Competition among established players, such as Teledyne Marine Technologies, Hottinger Brüel & Kjær, and Garmin Ltd., remains intense, fostering innovation and driving down prices, thus making marine acoustic sensors accessible to a wider range of users. The forecast period of 2025-2033 anticipates continued expansion, with a CAGR of 6.41%, indicating a promising future for this critical technology in the marine sector.
This detailed report provides a comprehensive analysis of the Marine Acoustic Sensors Market, offering valuable insights for industry stakeholders, investors, and researchers. Covering the period 2019-2033, with a focus on 2025, this study dissects market trends, competitive landscapes, and future growth potential. The report's meticulous analysis leverages extensive data and expert insights to offer actionable intelligence for strategic decision-making.
Marine Acoustic Sensors Market Concentration & Innovation
The Marine Acoustic Sensors market exhibits a moderately concentrated landscape, with key players holding significant market share. While precise market share figures for each company are proprietary data within the full report, Teledyne Marine Technologies, Hottinger Brüel & Kjær, and Garmin Ltd are identified as major players. Market concentration is influenced by factors such as R&D investments, technological advancements, and M&A activities. The estimated market value for 2025 is xx Million, projected to reach xx Million by 2033, exhibiting a CAGR of xx%.
- Innovation Drivers: Continuous advancements in sensor technology, including improved sensitivity, wider frequency ranges, and miniaturization, drive market growth. The development of AI-powered data analysis tools for acoustic data processing is also a significant innovation driver.
- Regulatory Frameworks: Stringent environmental regulations concerning marine mammal protection and underwater noise pollution impact market dynamics. Compliance requirements for acoustic sensor deployment and operation influence product design and adoption.
- Product Substitutes: Limited direct substitutes exist for marine acoustic sensors in many applications, reinforcing market stability. However, alternative technologies for underwater sensing, such as optical sensors, may present some level of indirect competition.
- End-User Trends: Growing demand for oceanographic research, offshore energy exploration (oil & gas, wind), and defense applications are key end-user trends boosting market expansion. Increasing focus on underwater infrastructure monitoring also contributes to market growth.
- M&A Activities: The market has witnessed several mergers and acquisitions in recent years, primarily aimed at expanding technological capabilities, geographical reach, and market share. The total value of M&A deals in the past five years is estimated to be around xx Million.
Marine Acoustic Sensors Market Industry Trends & Insights
The Marine Acoustic Sensors Market is experiencing robust growth, propelled by several factors. Increased investments in marine research, the expansion of offshore energy exploration, and advancements in autonomous underwater vehicles (AUVs) are primary growth drivers. The market is projected to witness significant expansion, driven by a rising demand for high-precision underwater acoustic monitoring systems across diverse sectors. The adoption of sophisticated data analytics capabilities is significantly enhancing the insights generated by these sensors. Consumer preferences are shifting towards more robust, reliable, and energy-efficient systems that offer advanced data processing capabilities. Competitive dynamics are characterized by innovation, strategic partnerships, and a focus on providing comprehensive solutions tailored to specific application needs. The increasing demand for marine acoustic sensors is expected to continue through 2033, driven by the expansion of the offshore energy sector, the rising use of AUVs, and increased scientific research activities in the marine environment. The global market is estimated at xx Million in 2025 and is projected to grow at a CAGR of xx% during the forecast period (2025-2033). Market penetration is particularly strong in developed nations but is steadily increasing in emerging markets.
Dominant Markets & Segments in Marine Acoustic Sensors Market
The North American region currently dominates the Marine Acoustic Sensors market, driven by significant investments in offshore energy exploration and defense applications. However, the Asia-Pacific region is expected to experience rapid growth due to increasing maritime activities and infrastructure development.
By Product:
- Hydrophones: This segment holds a substantial market share, driven by widespread applications in underwater acoustic monitoring, oceanographic research, and defense. Key drivers include continuous technological advancements in hydrophone design, resulting in improved sensitivity and noise reduction.
- Underwater Transducer: This segment is experiencing steady growth, fueled by the increasing demand for efficient acoustic communication and positioning systems in underwater applications. Advanced designs, offering improved signal processing and power efficiency, are driving this segment's expansion.
- Acoustic Towed Array: Growth in this segment is primarily driven by its use in military and naval applications for underwater surveillance. The demand for long-range underwater surveillance systems is contributing significantly to this growth.
- Side-scan Sonar: This segment benefits from increasing demand for high-resolution seabed mapping and underwater object detection. This segment is influenced by advancements in imaging technology and autonomous survey methods.
Key Drivers for Dominant Regions:
- North America: Robust government investments in defense, strong research funding for oceanographic studies, and a well-established offshore energy sector fuel market dominance.
- Europe: Significant investments in renewable energy sources, especially offshore wind, and a focus on marine environmental monitoring contribute to market growth.
- Asia-Pacific: Rapid industrialization, infrastructure development, and rising investments in maritime security drive market expansion.
Marine Acoustic Sensors Market Product Developments
Recent innovations in marine acoustic sensors include the development of more compact, energy-efficient devices with enhanced signal processing capabilities. The integration of artificial intelligence and machine learning algorithms for real-time data analysis is transforming the field, enabling more accurate and insightful interpretation of underwater acoustic data. These advancements are improving the overall market fit, addressing the growing demand for sophisticated underwater monitoring solutions in various sectors.
Report Scope & Segmentation Analysis
This report comprehensively analyzes the Marine Acoustic Sensors market, segmented by product type: Hydrophones, Underwater Transducer, Acoustic Towed Array, and Side-scan Sonar. Each segment's growth projections, market size, and competitive dynamics are thoroughly evaluated, providing a granular understanding of market opportunities. Detailed forecasts for each segment's market size and growth rates for the forecast period (2025-2033) are available in the full report. The competitive landscape within each segment is analyzed based on factors like technological capabilities, market share, and strategic initiatives.
Key Drivers of Marine Acoustic Sensors Market Growth
Several factors fuel the growth of the Marine Acoustic Sensors market:
- Technological Advancements: Developments in sensor technology, signal processing, and data analytics enable more accurate and reliable underwater monitoring.
- Offshore Energy Expansion: The growing exploration and development of offshore oil & gas resources and renewable energy sources (offshore wind) drive the need for efficient acoustic monitoring.
- Environmental Regulations: Stringent regulations regarding marine mammal protection and underwater noise pollution necessitate advanced acoustic monitoring solutions.
- Defense and Security: The need for enhanced underwater surveillance capabilities in naval and military operations fuels demand for sophisticated acoustic sensor systems.
Challenges in the Marine Acoustic Sensors Market Sector
Several challenges hinder the Marine Acoustic Sensors market's growth:
- High Initial Investment Costs: The cost of purchasing and deploying sophisticated acoustic sensor systems can be significant, posing a barrier for smaller companies and research institutions.
- Data Processing Complexity: Analyzing the large volumes of data generated by these sensors can be computationally intensive and requires specialized expertise.
- Environmental Considerations: The impact of underwater noise pollution from acoustic sensors on marine life needs careful consideration and mitigation strategies.
- Supply Chain Disruptions: Global supply chain issues can impact the availability of components and manufacturing capacity.
Emerging Opportunities in Marine Acoustic Sensors Market
The Marine Acoustic Sensors market presents significant opportunities:
- Integration with Autonomous Systems: Integrating acoustic sensors with AUVs and other autonomous systems allows for wider-scale and more efficient underwater monitoring.
- Development of Novel Sensor Technologies: Innovations in sensor design and materials could lead to more sensitive, robust, and energy-efficient sensors.
- Expansion into New Applications: Emerging applications in underwater archaeology, fisheries management, and climate change research open new market avenues.
- Advanced Data Analytics: Developing sophisticated AI-powered data analysis tools for acoustic data can enhance the insights derived from these sensors.
Leading Players in the Marine Acoustic Sensors Market Market
- Teledyne Marine Technologies (Teledyne Technologies Incorporated)
- Hottinger Brüel & Kjær (Spectris PLC)
- Garmin Ltd
- Thales Group
- BAE Systems PLC
- L3harris Technologies Inc
- Cobham Ultra Seniorco S à R l
- CTS Corporation
- Ocean Sonics Ltd
- Geospectrum Technologies Inc
Key Developments in Marine Acoustic Sensors Market Industry
- June 2023: RPS presented Neptune, a predictive algorithm for accurately and reliably detecting marine mammal vocalizations, addressing concerns about the impact of underwater noise pollution.
- January 2023: Launch of the 'Jaywun' marine research vessel by the Environment Agency – Abu Dhabi (EAD), enhancing marine research capabilities in the UAE and globally.
Strategic Outlook for Marine Acoustic Sensors Market Market
The Marine Acoustic Sensors market is poised for sustained growth, driven by technological innovations, expanding applications, and increased government and private sector investments. Focus on developing energy-efficient, AI-integrated sensors, and addressing environmental concerns will shape the market's future. Companies investing in R&D and strategic partnerships are well-positioned to capitalize on this significant market opportunity.
Marine Acoustic Sensors Market Segmentation
-
1. Product
- 1.1. Hydrophones
- 1.2. Underwater Transducer
- 1.3. Acoustic Towed Array
- 1.4. Side-scan Sonar
-
2. Application
- 2.1. Offshore Oil & Gas
- 2.2. Defense
- 2.3. Oceanography
- 2.4. Fisheries
-
3. Geography
- 3.1. North America
- 3.2. Europe
- 3.3. Asia-Pacific
- 3.4. Rest of the World
Marine Acoustic Sensors Market Segmentation By Geography
- 1. North America
- 2. Europe
- 3. Asia
- 4. Australia and New Zealand
- 5. Latin America
Marine Acoustic Sensors Market REPORT HIGHLIGHTS
| Aspects | Details |
|---|---|
| Study Period | 2019-2033 |
| Base Year | 2024 |
| Estimated Year | 2025 |
| Forecast Period | 2025-2033 |
| Historical Period | 2019-2024 |
| Growth Rate | CAGR of 6.41% from 2019-2033 |
| Segmentation |
|
Table of Contents
- 1. Introduction
- 1.1. Research Scope
- 1.2. Market Segmentation
- 1.3. Research Methodology
- 1.4. Definitions and Assumptions
- 2. Executive Summary
- 2.1. Introduction
- 3. Market Dynamics
- 3.1. Introduction
- 3.2. Market Drivers
- 3.2.1. Growing Deployment of Acoustic Navigation for Underwater Positioning; Rising Defense Spending in Several Countries
- 3.3. Market Restrains
- 3.3.1. High Initial Setup and Installation Cost; Limited Product variety and Capacity
- 3.4. Market Trends
- 3.4.1. Underwater Transducer to Hold Major Share in the Product Segment
- 4. Market Factor Analysis
- 4.1. Porters Five Forces
- 4.2. Supply/Value Chain
- 4.3. PESTEL analysis
- 4.4. Market Entropy
- 4.5. Patent/Trademark Analysis
- 5. Global Marine Acoustic Sensors Market Analysis, Insights and Forecast, 2019-2031
- 5.1. Market Analysis, Insights and Forecast - by Product
- 5.1.1. Hydrophones
- 5.1.2. Underwater Transducer
- 5.1.3. Acoustic Towed Array
- 5.1.4. Side-scan Sonar
- 5.2. Market Analysis, Insights and Forecast - by Application
- 5.2.1. Offshore Oil & Gas
- 5.2.2. Defense
- 5.2.3. Oceanography
- 5.2.4. Fisheries
- 5.3. Market Analysis, Insights and Forecast - by Geography
- 5.3.1. North America
- 5.3.2. Europe
- 5.3.3. Asia-Pacific
- 5.3.4. Rest of the World
- 5.4. Market Analysis, Insights and Forecast - by Region
- 5.4.1. North America
- 5.4.2. Europe
- 5.4.3. Asia
- 5.4.4. Australia and New Zealand
- 5.4.5. Latin America
- 5.1. Market Analysis, Insights and Forecast - by Product
- 6. North America Marine Acoustic Sensors Market Analysis, Insights and Forecast, 2019-2031
- 6.1. Market Analysis, Insights and Forecast - by Product
- 6.1.1. Hydrophones
- 6.1.2. Underwater Transducer
- 6.1.3. Acoustic Towed Array
- 6.1.4. Side-scan Sonar
- 6.2. Market Analysis, Insights and Forecast - by Application
- 6.2.1. Offshore Oil & Gas
- 6.2.2. Defense
- 6.2.3. Oceanography
- 6.2.4. Fisheries
- 6.3. Market Analysis, Insights and Forecast - by Geography
- 6.3.1. North America
- 6.3.2. Europe
- 6.3.3. Asia-Pacific
- 6.3.4. Rest of the World
- 6.1. Market Analysis, Insights and Forecast - by Product
- 7. Europe Marine Acoustic Sensors Market Analysis, Insights and Forecast, 2019-2031
- 7.1. Market Analysis, Insights and Forecast - by Product
- 7.1.1. Hydrophones
- 7.1.2. Underwater Transducer
- 7.1.3. Acoustic Towed Array
- 7.1.4. Side-scan Sonar
- 7.2. Market Analysis, Insights and Forecast - by Application
- 7.2.1. Offshore Oil & Gas
- 7.2.2. Defense
- 7.2.3. Oceanography
- 7.2.4. Fisheries
- 7.3. Market Analysis, Insights and Forecast - by Geography
- 7.3.1. North America
- 7.3.2. Europe
- 7.3.3. Asia-Pacific
- 7.3.4. Rest of the World
- 7.1. Market Analysis, Insights and Forecast - by Product
- 8. Asia Marine Acoustic Sensors Market Analysis, Insights and Forecast, 2019-2031
- 8.1. Market Analysis, Insights and Forecast - by Product
- 8.1.1. Hydrophones
- 8.1.2. Underwater Transducer
- 8.1.3. Acoustic Towed Array
- 8.1.4. Side-scan Sonar
- 8.2. Market Analysis, Insights and Forecast - by Application
- 8.2.1. Offshore Oil & Gas
- 8.2.2. Defense
- 8.2.3. Oceanography
- 8.2.4. Fisheries
- 8.3. Market Analysis, Insights and Forecast - by Geography
- 8.3.1. North America
- 8.3.2. Europe
- 8.3.3. Asia-Pacific
- 8.3.4. Rest of the World
- 8.1. Market Analysis, Insights and Forecast - by Product
- 9. Australia and New Zealand Marine Acoustic Sensors Market Analysis, Insights and Forecast, 2019-2031
- 9.1. Market Analysis, Insights and Forecast - by Product
- 9.1.1. Hydrophones
- 9.1.2. Underwater Transducer
- 9.1.3. Acoustic Towed Array
- 9.1.4. Side-scan Sonar
- 9.2. Market Analysis, Insights and Forecast - by Application
- 9.2.1. Offshore Oil & Gas
- 9.2.2. Defense
- 9.2.3. Oceanography
- 9.2.4. Fisheries
- 9.3. Market Analysis, Insights and Forecast - by Geography
- 9.3.1. North America
- 9.3.2. Europe
- 9.3.3. Asia-Pacific
- 9.3.4. Rest of the World
- 9.1. Market Analysis, Insights and Forecast - by Product
- 10. Latin America Marine Acoustic Sensors Market Analysis, Insights and Forecast, 2019-2031
- 10.1. Market Analysis, Insights and Forecast - by Product
- 10.1.1. Hydrophones
- 10.1.2. Underwater Transducer
- 10.1.3. Acoustic Towed Array
- 10.1.4. Side-scan Sonar
- 10.2. Market Analysis, Insights and Forecast - by Application
- 10.2.1. Offshore Oil & Gas
- 10.2.2. Defense
- 10.2.3. Oceanography
- 10.2.4. Fisheries
- 10.3. Market Analysis, Insights and Forecast - by Geography
- 10.3.1. North America
- 10.3.2. Europe
- 10.3.3. Asia-Pacific
- 10.3.4. Rest of the World
- 10.1. Market Analysis, Insights and Forecast - by Product
- 11. North America Marine Acoustic Sensors Market Analysis, Insights and Forecast, 2019-2031
- 11.1. Market Analysis, Insights and Forecast - By Country/Sub-region
- 11.1.1 United States
- 11.1.2 Canada
- 11.1.3 Mexico
- 12. Europe Marine Acoustic Sensors Market Analysis, Insights and Forecast, 2019-2031
- 12.1. Market Analysis, Insights and Forecast - By Country/Sub-region
- 12.1.1 Germany
- 12.1.2 United Kingdom
- 12.1.3 France
- 12.1.4 Spain
- 12.1.5 Italy
- 12.1.6 Spain
- 12.1.7 Belgium
- 12.1.8 Netherland
- 12.1.9 Nordics
- 12.1.10 Rest of Europe
- 13. Asia Pacific Marine Acoustic Sensors Market Analysis, Insights and Forecast, 2019-2031
- 13.1. Market Analysis, Insights and Forecast - By Country/Sub-region
- 13.1.1 China
- 13.1.2 Japan
- 13.1.3 India
- 13.1.4 South Korea
- 13.1.5 Southeast Asia
- 13.1.6 Australia
- 13.1.7 Indonesia
- 13.1.8 Phillipes
- 13.1.9 Singapore
- 13.1.10 Thailandc
- 13.1.11 Rest of Asia Pacific
- 14. South America Marine Acoustic Sensors Market Analysis, Insights and Forecast, 2019-2031
- 14.1. Market Analysis, Insights and Forecast - By Country/Sub-region
- 14.1.1 Brazil
- 14.1.2 Argentina
- 14.1.3 Peru
- 14.1.4 Chile
- 14.1.5 Colombia
- 14.1.6 Ecuador
- 14.1.7 Venezuela
- 14.1.8 Rest of South America
- 15. North America Marine Acoustic Sensors Market Analysis, Insights and Forecast, 2019-2031
- 15.1. Market Analysis, Insights and Forecast - By Country/Sub-region
- 15.1.1 United States
- 15.1.2 Canada
- 15.1.3 Mexico
- 16. MEA Marine Acoustic Sensors Market Analysis, Insights and Forecast, 2019-2031
- 16.1. Market Analysis, Insights and Forecast - By Country/Sub-region
- 16.1.1 United Arab Emirates
- 16.1.2 Saudi Arabia
- 16.1.3 South Africa
- 16.1.4 Rest of Middle East and Africa
- 17. Competitive Analysis
- 17.1. Global Market Share Analysis 2024
- 17.2. Company Profiles
- 17.2.1 Teledyne Marine Technologies (Teledyne Technologies Incorporated)
- 17.2.1.1. Overview
- 17.2.1.2. Products
- 17.2.1.3. SWOT Analysis
- 17.2.1.4. Recent Developments
- 17.2.1.5. Financials (Based on Availability)
- 17.2.2 Hottinger Brüel & Kjær (Spectris PLC)
- 17.2.2.1. Overview
- 17.2.2.2. Products
- 17.2.2.3. SWOT Analysis
- 17.2.2.4. Recent Developments
- 17.2.2.5. Financials (Based on Availability)
- 17.2.3 Garmin Ltd
- 17.2.3.1. Overview
- 17.2.3.2. Products
- 17.2.3.3. SWOT Analysis
- 17.2.3.4. Recent Developments
- 17.2.3.5. Financials (Based on Availability)
- 17.2.4 Thales Group
- 17.2.4.1. Overview
- 17.2.4.2. Products
- 17.2.4.3. SWOT Analysis
- 17.2.4.4. Recent Developments
- 17.2.4.5. Financials (Based on Availability)
- 17.2.5 BAE Systems PLC
- 17.2.5.1. Overview
- 17.2.5.2. Products
- 17.2.5.3. SWOT Analysis
- 17.2.5.4. Recent Developments
- 17.2.5.5. Financials (Based on Availability)
- 17.2.6 L3harris Technologies Inc
- 17.2.6.1. Overview
- 17.2.6.2. Products
- 17.2.6.3. SWOT Analysis
- 17.2.6.4. Recent Developments
- 17.2.6.5. Financials (Based on Availability)
- 17.2.7 Cobham Ultra Seniorco S à R l
- 17.2.7.1. Overview
- 17.2.7.2. Products
- 17.2.7.3. SWOT Analysis
- 17.2.7.4. Recent Developments
- 17.2.7.5. Financials (Based on Availability)
- 17.2.8 CTS Corporatio
- 17.2.8.1. Overview
- 17.2.8.2. Products
- 17.2.8.3. SWOT Analysis
- 17.2.8.4. Recent Developments
- 17.2.8.5. Financials (Based on Availability)
- 17.2.9 Ocean Sonics Ltd
- 17.2.9.1. Overview
- 17.2.9.2. Products
- 17.2.9.3. SWOT Analysis
- 17.2.9.4. Recent Developments
- 17.2.9.5. Financials (Based on Availability)
- 17.2.10 Geospectrum Technologies Inc
- 17.2.10.1. Overview
- 17.2.10.2. Products
- 17.2.10.3. SWOT Analysis
- 17.2.10.4. Recent Developments
- 17.2.10.5. Financials (Based on Availability)
- 17.2.1 Teledyne Marine Technologies (Teledyne Technologies Incorporated)
List of Figures
- Figure 1: Global Marine Acoustic Sensors Market Revenue Breakdown (Million, %) by Region 2024 & 2032
- Figure 2: Global Marine Acoustic Sensors Market Volume Breakdown (K Unit, %) by Region 2024 & 2032
- Figure 3: North America Marine Acoustic Sensors Market Revenue (Million), by Country 2024 & 2032
- Figure 4: North America Marine Acoustic Sensors Market Volume (K Unit), by Country 2024 & 2032
- Figure 5: North America Marine Acoustic Sensors Market Revenue Share (%), by Country 2024 & 2032
- Figure 6: North America Marine Acoustic Sensors Market Volume Share (%), by Country 2024 & 2032
- Figure 7: Europe Marine Acoustic Sensors Market Revenue (Million), by Country 2024 & 2032
- Figure 8: Europe Marine Acoustic Sensors Market Volume (K Unit), by Country 2024 & 2032
- Figure 9: Europe Marine Acoustic Sensors Market Revenue Share (%), by Country 2024 & 2032
- Figure 10: Europe Marine Acoustic Sensors Market Volume Share (%), by Country 2024 & 2032
- Figure 11: Asia Pacific Marine Acoustic Sensors Market Revenue (Million), by Country 2024 & 2032
- Figure 12: Asia Pacific Marine Acoustic Sensors Market Volume (K Unit), by Country 2024 & 2032
- Figure 13: Asia Pacific Marine Acoustic Sensors Market Revenue Share (%), by Country 2024 & 2032
- Figure 14: Asia Pacific Marine Acoustic Sensors Market Volume Share (%), by Country 2024 & 2032
- Figure 15: South America Marine Acoustic Sensors Market Revenue (Million), by Country 2024 & 2032
- Figure 16: South America Marine Acoustic Sensors Market Volume (K Unit), by Country 2024 & 2032
- Figure 17: South America Marine Acoustic Sensors Market Revenue Share (%), by Country 2024 & 2032
- Figure 18: South America Marine Acoustic Sensors Market Volume Share (%), by Country 2024 & 2032
- Figure 19: North America Marine Acoustic Sensors Market Revenue (Million), by Country 2024 & 2032
- Figure 20: North America Marine Acoustic Sensors Market Volume (K Unit), by Country 2024 & 2032
- Figure 21: North America Marine Acoustic Sensors Market Revenue Share (%), by Country 2024 & 2032
- Figure 22: North America Marine Acoustic Sensors Market Volume Share (%), by Country 2024 & 2032
- Figure 23: MEA Marine Acoustic Sensors Market Revenue (Million), by Country 2024 & 2032
- Figure 24: MEA Marine Acoustic Sensors Market Volume (K Unit), by Country 2024 & 2032
- Figure 25: MEA Marine Acoustic Sensors Market Revenue Share (%), by Country 2024 & 2032
- Figure 26: MEA Marine Acoustic Sensors Market Volume Share (%), by Country 2024 & 2032
- Figure 27: North America Marine Acoustic Sensors Market Revenue (Million), by Product 2024 & 2032
- Figure 28: North America Marine Acoustic Sensors Market Volume (K Unit), by Product 2024 & 2032
- Figure 29: North America Marine Acoustic Sensors Market Revenue Share (%), by Product 2024 & 2032
- Figure 30: North America Marine Acoustic Sensors Market Volume Share (%), by Product 2024 & 2032
- Figure 31: North America Marine Acoustic Sensors Market Revenue (Million), by Application 2024 & 2032
- Figure 32: North America Marine Acoustic Sensors Market Volume (K Unit), by Application 2024 & 2032
- Figure 33: North America Marine Acoustic Sensors Market Revenue Share (%), by Application 2024 & 2032
- Figure 34: North America Marine Acoustic Sensors Market Volume Share (%), by Application 2024 & 2032
- Figure 35: North America Marine Acoustic Sensors Market Revenue (Million), by Geography 2024 & 2032
- Figure 36: North America Marine Acoustic Sensors Market Volume (K Unit), by Geography 2024 & 2032
- Figure 37: North America Marine Acoustic Sensors Market Revenue Share (%), by Geography 2024 & 2032
- Figure 38: North America Marine Acoustic Sensors Market Volume Share (%), by Geography 2024 & 2032
- Figure 39: North America Marine Acoustic Sensors Market Revenue (Million), by Country 2024 & 2032
- Figure 40: North America Marine Acoustic Sensors Market Volume (K Unit), by Country 2024 & 2032
- Figure 41: North America Marine Acoustic Sensors Market Revenue Share (%), by Country 2024 & 2032
- Figure 42: North America Marine Acoustic Sensors Market Volume Share (%), by Country 2024 & 2032
- Figure 43: Europe Marine Acoustic Sensors Market Revenue (Million), by Product 2024 & 2032
- Figure 44: Europe Marine Acoustic Sensors Market Volume (K Unit), by Product 2024 & 2032
- Figure 45: Europe Marine Acoustic Sensors Market Revenue Share (%), by Product 2024 & 2032
- Figure 46: Europe Marine Acoustic Sensors Market Volume Share (%), by Product 2024 & 2032
- Figure 47: Europe Marine Acoustic Sensors Market Revenue (Million), by Application 2024 & 2032
- Figure 48: Europe Marine Acoustic Sensors Market Volume (K Unit), by Application 2024 & 2032
- Figure 49: Europe Marine Acoustic Sensors Market Revenue Share (%), by Application 2024 & 2032
- Figure 50: Europe Marine Acoustic Sensors Market Volume Share (%), by Application 2024 & 2032
- Figure 51: Europe Marine Acoustic Sensors Market Revenue (Million), by Geography 2024 & 2032
- Figure 52: Europe Marine Acoustic Sensors Market Volume (K Unit), by Geography 2024 & 2032
- Figure 53: Europe Marine Acoustic Sensors Market Revenue Share (%), by Geography 2024 & 2032
- Figure 54: Europe Marine Acoustic Sensors Market Volume Share (%), by Geography 2024 & 2032
- Figure 55: Europe Marine Acoustic Sensors Market Revenue (Million), by Country 2024 & 2032
- Figure 56: Europe Marine Acoustic Sensors Market Volume (K Unit), by Country 2024 & 2032
- Figure 57: Europe Marine Acoustic Sensors Market Revenue Share (%), by Country 2024 & 2032
- Figure 58: Europe Marine Acoustic Sensors Market Volume Share (%), by Country 2024 & 2032
- Figure 59: Asia Marine Acoustic Sensors Market Revenue (Million), by Product 2024 & 2032
- Figure 60: Asia Marine Acoustic Sensors Market Volume (K Unit), by Product 2024 & 2032
- Figure 61: Asia Marine Acoustic Sensors Market Revenue Share (%), by Product 2024 & 2032
- Figure 62: Asia Marine Acoustic Sensors Market Volume Share (%), by Product 2024 & 2032
- Figure 63: Asia Marine Acoustic Sensors Market Revenue (Million), by Application 2024 & 2032
- Figure 64: Asia Marine Acoustic Sensors Market Volume (K Unit), by Application 2024 & 2032
- Figure 65: Asia Marine Acoustic Sensors Market Revenue Share (%), by Application 2024 & 2032
- Figure 66: Asia Marine Acoustic Sensors Market Volume Share (%), by Application 2024 & 2032
- Figure 67: Asia Marine Acoustic Sensors Market Revenue (Million), by Geography 2024 & 2032
- Figure 68: Asia Marine Acoustic Sensors Market Volume (K Unit), by Geography 2024 & 2032
- Figure 69: Asia Marine Acoustic Sensors Market Revenue Share (%), by Geography 2024 & 2032
- Figure 70: Asia Marine Acoustic Sensors Market Volume Share (%), by Geography 2024 & 2032
- Figure 71: Asia Marine Acoustic Sensors Market Revenue (Million), by Country 2024 & 2032
- Figure 72: Asia Marine Acoustic Sensors Market Volume (K Unit), by Country 2024 & 2032
- Figure 73: Asia Marine Acoustic Sensors Market Revenue Share (%), by Country 2024 & 2032
- Figure 74: Asia Marine Acoustic Sensors Market Volume Share (%), by Country 2024 & 2032
- Figure 75: Australia and New Zealand Marine Acoustic Sensors Market Revenue (Million), by Product 2024 & 2032
- Figure 76: Australia and New Zealand Marine Acoustic Sensors Market Volume (K Unit), by Product 2024 & 2032
- Figure 77: Australia and New Zealand Marine Acoustic Sensors Market Revenue Share (%), by Product 2024 & 2032
- Figure 78: Australia and New Zealand Marine Acoustic Sensors Market Volume Share (%), by Product 2024 & 2032
- Figure 79: Australia and New Zealand Marine Acoustic Sensors Market Revenue (Million), by Application 2024 & 2032
- Figure 80: Australia and New Zealand Marine Acoustic Sensors Market Volume (K Unit), by Application 2024 & 2032
- Figure 81: Australia and New Zealand Marine Acoustic Sensors Market Revenue Share (%), by Application 2024 & 2032
- Figure 82: Australia and New Zealand Marine Acoustic Sensors Market Volume Share (%), by Application 2024 & 2032
- Figure 83: Australia and New Zealand Marine Acoustic Sensors Market Revenue (Million), by Geography 2024 & 2032
- Figure 84: Australia and New Zealand Marine Acoustic Sensors Market Volume (K Unit), by Geography 2024 & 2032
- Figure 85: Australia and New Zealand Marine Acoustic Sensors Market Revenue Share (%), by Geography 2024 & 2032
- Figure 86: Australia and New Zealand Marine Acoustic Sensors Market Volume Share (%), by Geography 2024 & 2032
- Figure 87: Australia and New Zealand Marine Acoustic Sensors Market Revenue (Million), by Country 2024 & 2032
- Figure 88: Australia and New Zealand Marine Acoustic Sensors Market Volume (K Unit), by Country 2024 & 2032
- Figure 89: Australia and New Zealand Marine Acoustic Sensors Market Revenue Share (%), by Country 2024 & 2032
- Figure 90: Australia and New Zealand Marine Acoustic Sensors Market Volume Share (%), by Country 2024 & 2032
- Figure 91: Latin America Marine Acoustic Sensors Market Revenue (Million), by Product 2024 & 2032
- Figure 92: Latin America Marine Acoustic Sensors Market Volume (K Unit), by Product 2024 & 2032
- Figure 93: Latin America Marine Acoustic Sensors Market Revenue Share (%), by Product 2024 & 2032
- Figure 94: Latin America Marine Acoustic Sensors Market Volume Share (%), by Product 2024 & 2032
- Figure 95: Latin America Marine Acoustic Sensors Market Revenue (Million), by Application 2024 & 2032
- Figure 96: Latin America Marine Acoustic Sensors Market Volume (K Unit), by Application 2024 & 2032
- Figure 97: Latin America Marine Acoustic Sensors Market Revenue Share (%), by Application 2024 & 2032
- Figure 98: Latin America Marine Acoustic Sensors Market Volume Share (%), by Application 2024 & 2032
- Figure 99: Latin America Marine Acoustic Sensors Market Revenue (Million), by Geography 2024 & 2032
- Figure 100: Latin America Marine Acoustic Sensors Market Volume (K Unit), by Geography 2024 & 2032
- Figure 101: Latin America Marine Acoustic Sensors Market Revenue Share (%), by Geography 2024 & 2032
- Figure 102: Latin America Marine Acoustic Sensors Market Volume Share (%), by Geography 2024 & 2032
- Figure 103: Latin America Marine Acoustic Sensors Market Revenue (Million), by Country 2024 & 2032
- Figure 104: Latin America Marine Acoustic Sensors Market Volume (K Unit), by Country 2024 & 2032
- Figure 105: Latin America Marine Acoustic Sensors Market Revenue Share (%), by Country 2024 & 2032
- Figure 106: Latin America Marine Acoustic Sensors Market Volume Share (%), by Country 2024 & 2032
List of Tables
- Table 1: Global Marine Acoustic Sensors Market Revenue Million Forecast, by Region 2019 & 2032
- Table 2: Global Marine Acoustic Sensors Market Volume K Unit Forecast, by Region 2019 & 2032
- Table 3: Global Marine Acoustic Sensors Market Revenue Million Forecast, by Product 2019 & 2032
- Table 4: Global Marine Acoustic Sensors Market Volume K Unit Forecast, by Product 2019 & 2032
- Table 5: Global Marine Acoustic Sensors Market Revenue Million Forecast, by Application 2019 & 2032
- Table 6: Global Marine Acoustic Sensors Market Volume K Unit Forecast, by Application 2019 & 2032
- Table 7: Global Marine Acoustic Sensors Market Revenue Million Forecast, by Geography 2019 & 2032
- Table 8: Global Marine Acoustic Sensors Market Volume K Unit Forecast, by Geography 2019 & 2032
- Table 9: Global Marine Acoustic Sensors Market Revenue Million Forecast, by Region 2019 & 2032
- Table 10: Global Marine Acoustic Sensors Market Volume K Unit Forecast, by Region 2019 & 2032
- Table 11: Global Marine Acoustic Sensors Market Revenue Million Forecast, by Country 2019 & 2032
- Table 12: Global Marine Acoustic Sensors Market Volume K Unit Forecast, by Country 2019 & 2032
- Table 13: United States Marine Acoustic Sensors Market Revenue (Million) Forecast, by Application 2019 & 2032
- Table 14: United States Marine Acoustic Sensors Market Volume (K Unit) Forecast, by Application 2019 & 2032
- Table 15: Canada Marine Acoustic Sensors Market Revenue (Million) Forecast, by Application 2019 & 2032
- Table 16: Canada Marine Acoustic Sensors Market Volume (K Unit) Forecast, by Application 2019 & 2032
- Table 17: Mexico Marine Acoustic Sensors Market Revenue (Million) Forecast, by Application 2019 & 2032
- Table 18: Mexico Marine Acoustic Sensors Market Volume (K Unit) Forecast, by Application 2019 & 2032
- Table 19: Global Marine Acoustic Sensors Market Revenue Million Forecast, by Country 2019 & 2032
- Table 20: Global Marine Acoustic Sensors Market Volume K Unit Forecast, by Country 2019 & 2032
- Table 21: Germany Marine Acoustic Sensors Market Revenue (Million) Forecast, by Application 2019 & 2032
- Table 22: Germany Marine Acoustic Sensors Market Volume (K Unit) Forecast, by Application 2019 & 2032
- Table 23: United Kingdom Marine Acoustic Sensors Market Revenue (Million) Forecast, by Application 2019 & 2032
- Table 24: United Kingdom Marine Acoustic Sensors Market Volume (K Unit) Forecast, by Application 2019 & 2032
- Table 25: France Marine Acoustic Sensors Market Revenue (Million) Forecast, by Application 2019 & 2032
- Table 26: France Marine Acoustic Sensors Market Volume (K Unit) Forecast, by Application 2019 & 2032
- Table 27: Spain Marine Acoustic Sensors Market Revenue (Million) Forecast, by Application 2019 & 2032
- Table 28: Spain Marine Acoustic Sensors Market Volume (K Unit) Forecast, by Application 2019 & 2032
- Table 29: Italy Marine Acoustic Sensors Market Revenue (Million) Forecast, by Application 2019 & 2032
- Table 30: Italy Marine Acoustic Sensors Market Volume (K Unit) Forecast, by Application 2019 & 2032
- Table 31: Spain Marine Acoustic Sensors Market Revenue (Million) Forecast, by Application 2019 & 2032
- Table 32: Spain Marine Acoustic Sensors Market Volume (K Unit) Forecast, by Application 2019 & 2032
- Table 33: Belgium Marine Acoustic Sensors Market Revenue (Million) Forecast, by Application 2019 & 2032
- Table 34: Belgium Marine Acoustic Sensors Market Volume (K Unit) Forecast, by Application 2019 & 2032
- Table 35: Netherland Marine Acoustic Sensors Market Revenue (Million) Forecast, by Application 2019 & 2032
- Table 36: Netherland Marine Acoustic Sensors Market Volume (K Unit) Forecast, by Application 2019 & 2032
- Table 37: Nordics Marine Acoustic Sensors Market Revenue (Million) Forecast, by Application 2019 & 2032
- Table 38: Nordics Marine Acoustic Sensors Market Volume (K Unit) Forecast, by Application 2019 & 2032
- Table 39: Rest of Europe Marine Acoustic Sensors Market Revenue (Million) Forecast, by Application 2019 & 2032
- Table 40: Rest of Europe Marine Acoustic Sensors Market Volume (K Unit) Forecast, by Application 2019 & 2032
- Table 41: Global Marine Acoustic Sensors Market Revenue Million Forecast, by Country 2019 & 2032
- Table 42: Global Marine Acoustic Sensors Market Volume K Unit Forecast, by Country 2019 & 2032
- Table 43: China Marine Acoustic Sensors Market Revenue (Million) Forecast, by Application 2019 & 2032
- Table 44: China Marine Acoustic Sensors Market Volume (K Unit) Forecast, by Application 2019 & 2032
- Table 45: Japan Marine Acoustic Sensors Market Revenue (Million) Forecast, by Application 2019 & 2032
- Table 46: Japan Marine Acoustic Sensors Market Volume (K Unit) Forecast, by Application 2019 & 2032
- Table 47: India Marine Acoustic Sensors Market Revenue (Million) Forecast, by Application 2019 & 2032
- Table 48: India Marine Acoustic Sensors Market Volume (K Unit) Forecast, by Application 2019 & 2032
- Table 49: South Korea Marine Acoustic Sensors Market Revenue (Million) Forecast, by Application 2019 & 2032
- Table 50: South Korea Marine Acoustic Sensors Market Volume (K Unit) Forecast, by Application 2019 & 2032
- Table 51: Southeast Asia Marine Acoustic Sensors Market Revenue (Million) Forecast, by Application 2019 & 2032
- Table 52: Southeast Asia Marine Acoustic Sensors Market Volume (K Unit) Forecast, by Application 2019 & 2032
- Table 53: Australia Marine Acoustic Sensors Market Revenue (Million) Forecast, by Application 2019 & 2032
- Table 54: Australia Marine Acoustic Sensors Market Volume (K Unit) Forecast, by Application 2019 & 2032
- Table 55: Indonesia Marine Acoustic Sensors Market Revenue (Million) Forecast, by Application 2019 & 2032
- Table 56: Indonesia Marine Acoustic Sensors Market Volume (K Unit) Forecast, by Application 2019 & 2032
- Table 57: Phillipes Marine Acoustic Sensors Market Revenue (Million) Forecast, by Application 2019 & 2032
- Table 58: Phillipes Marine Acoustic Sensors Market Volume (K Unit) Forecast, by Application 2019 & 2032
- Table 59: Singapore Marine Acoustic Sensors Market Revenue (Million) Forecast, by Application 2019 & 2032
- Table 60: Singapore Marine Acoustic Sensors Market Volume (K Unit) Forecast, by Application 2019 & 2032
- Table 61: Thailandc Marine Acoustic Sensors Market Revenue (Million) Forecast, by Application 2019 & 2032
- Table 62: Thailandc Marine Acoustic Sensors Market Volume (K Unit) Forecast, by Application 2019 & 2032
- Table 63: Rest of Asia Pacific Marine Acoustic Sensors Market Revenue (Million) Forecast, by Application 2019 & 2032
- Table 64: Rest of Asia Pacific Marine Acoustic Sensors Market Volume (K Unit) Forecast, by Application 2019 & 2032
- Table 65: Global Marine Acoustic Sensors Market Revenue Million Forecast, by Country 2019 & 2032
- Table 66: Global Marine Acoustic Sensors Market Volume K Unit Forecast, by Country 2019 & 2032
- Table 67: Brazil Marine Acoustic Sensors Market Revenue (Million) Forecast, by Application 2019 & 2032
- Table 68: Brazil Marine Acoustic Sensors Market Volume (K Unit) Forecast, by Application 2019 & 2032
- Table 69: Argentina Marine Acoustic Sensors Market Revenue (Million) Forecast, by Application 2019 & 2032
- Table 70: Argentina Marine Acoustic Sensors Market Volume (K Unit) Forecast, by Application 2019 & 2032
- Table 71: Peru Marine Acoustic Sensors Market Revenue (Million) Forecast, by Application 2019 & 2032
- Table 72: Peru Marine Acoustic Sensors Market Volume (K Unit) Forecast, by Application 2019 & 2032
- Table 73: Chile Marine Acoustic Sensors Market Revenue (Million) Forecast, by Application 2019 & 2032
- Table 74: Chile Marine Acoustic Sensors Market Volume (K Unit) Forecast, by Application 2019 & 2032
- Table 75: Colombia Marine Acoustic Sensors Market Revenue (Million) Forecast, by Application 2019 & 2032
- Table 76: Colombia Marine Acoustic Sensors Market Volume (K Unit) Forecast, by Application 2019 & 2032
- Table 77: Ecuador Marine Acoustic Sensors Market Revenue (Million) Forecast, by Application 2019 & 2032
- Table 78: Ecuador Marine Acoustic Sensors Market Volume (K Unit) Forecast, by Application 2019 & 2032
- Table 79: Venezuela Marine Acoustic Sensors Market Revenue (Million) Forecast, by Application 2019 & 2032
- Table 80: Venezuela Marine Acoustic Sensors Market Volume (K Unit) Forecast, by Application 2019 & 2032
- Table 81: Rest of South America Marine Acoustic Sensors Market Revenue (Million) Forecast, by Application 2019 & 2032
- Table 82: Rest of South America Marine Acoustic Sensors Market Volume (K Unit) Forecast, by Application 2019 & 2032
- Table 83: Global Marine Acoustic Sensors Market Revenue Million Forecast, by Country 2019 & 2032
- Table 84: Global Marine Acoustic Sensors Market Volume K Unit Forecast, by Country 2019 & 2032
- Table 85: United States Marine Acoustic Sensors Market Revenue (Million) Forecast, by Application 2019 & 2032
- Table 86: United States Marine Acoustic Sensors Market Volume (K Unit) Forecast, by Application 2019 & 2032
- Table 87: Canada Marine Acoustic Sensors Market Revenue (Million) Forecast, by Application 2019 & 2032
- Table 88: Canada Marine Acoustic Sensors Market Volume (K Unit) Forecast, by Application 2019 & 2032
- Table 89: Mexico Marine Acoustic Sensors Market Revenue (Million) Forecast, by Application 2019 & 2032
- Table 90: Mexico Marine Acoustic Sensors Market Volume (K Unit) Forecast, by Application 2019 & 2032
- Table 91: Global Marine Acoustic Sensors Market Revenue Million Forecast, by Country 2019 & 2032
- Table 92: Global Marine Acoustic Sensors Market Volume K Unit Forecast, by Country 2019 & 2032
- Table 93: United Arab Emirates Marine Acoustic Sensors Market Revenue (Million) Forecast, by Application 2019 & 2032
- Table 94: United Arab Emirates Marine Acoustic Sensors Market Volume (K Unit) Forecast, by Application 2019 & 2032
- Table 95: Saudi Arabia Marine Acoustic Sensors Market Revenue (Million) Forecast, by Application 2019 & 2032
- Table 96: Saudi Arabia Marine Acoustic Sensors Market Volume (K Unit) Forecast, by Application 2019 & 2032
- Table 97: South Africa Marine Acoustic Sensors Market Revenue (Million) Forecast, by Application 2019 & 2032
- Table 98: South Africa Marine Acoustic Sensors Market Volume (K Unit) Forecast, by Application 2019 & 2032
- Table 99: Rest of Middle East and Africa Marine Acoustic Sensors Market Revenue (Million) Forecast, by Application 2019 & 2032
- Table 100: Rest of Middle East and Africa Marine Acoustic Sensors Market Volume (K Unit) Forecast, by Application 2019 & 2032
- Table 101: Global Marine Acoustic Sensors Market Revenue Million Forecast, by Product 2019 & 2032
- Table 102: Global Marine Acoustic Sensors Market Volume K Unit Forecast, by Product 2019 & 2032
- Table 103: Global Marine Acoustic Sensors Market Revenue Million Forecast, by Application 2019 & 2032
- Table 104: Global Marine Acoustic Sensors Market Volume K Unit Forecast, by Application 2019 & 2032
- Table 105: Global Marine Acoustic Sensors Market Revenue Million Forecast, by Geography 2019 & 2032
- Table 106: Global Marine Acoustic Sensors Market Volume K Unit Forecast, by Geography 2019 & 2032
- Table 107: Global Marine Acoustic Sensors Market Revenue Million Forecast, by Country 2019 & 2032
- Table 108: Global Marine Acoustic Sensors Market Volume K Unit Forecast, by Country 2019 & 2032
- Table 109: Global Marine Acoustic Sensors Market Revenue Million Forecast, by Product 2019 & 2032
- Table 110: Global Marine Acoustic Sensors Market Volume K Unit Forecast, by Product 2019 & 2032
- Table 111: Global Marine Acoustic Sensors Market Revenue Million Forecast, by Application 2019 & 2032
- Table 112: Global Marine Acoustic Sensors Market Volume K Unit Forecast, by Application 2019 & 2032
- Table 113: Global Marine Acoustic Sensors Market Revenue Million Forecast, by Geography 2019 & 2032
- Table 114: Global Marine Acoustic Sensors Market Volume K Unit Forecast, by Geography 2019 & 2032
- Table 115: Global Marine Acoustic Sensors Market Revenue Million Forecast, by Country 2019 & 2032
- Table 116: Global Marine Acoustic Sensors Market Volume K Unit Forecast, by Country 2019 & 2032
- Table 117: Global Marine Acoustic Sensors Market Revenue Million Forecast, by Product 2019 & 2032
- Table 118: Global Marine Acoustic Sensors Market Volume K Unit Forecast, by Product 2019 & 2032
- Table 119: Global Marine Acoustic Sensors Market Revenue Million Forecast, by Application 2019 & 2032
- Table 120: Global Marine Acoustic Sensors Market Volume K Unit Forecast, by Application 2019 & 2032
- Table 121: Global Marine Acoustic Sensors Market Revenue Million Forecast, by Geography 2019 & 2032
- Table 122: Global Marine Acoustic Sensors Market Volume K Unit Forecast, by Geography 2019 & 2032
- Table 123: Global Marine Acoustic Sensors Market Revenue Million Forecast, by Country 2019 & 2032
- Table 124: Global Marine Acoustic Sensors Market Volume K Unit Forecast, by Country 2019 & 2032
- Table 125: Global Marine Acoustic Sensors Market Revenue Million Forecast, by Product 2019 & 2032
- Table 126: Global Marine Acoustic Sensors Market Volume K Unit Forecast, by Product 2019 & 2032
- Table 127: Global Marine Acoustic Sensors Market Revenue Million Forecast, by Application 2019 & 2032
- Table 128: Global Marine Acoustic Sensors Market Volume K Unit Forecast, by Application 2019 & 2032
- Table 129: Global Marine Acoustic Sensors Market Revenue Million Forecast, by Geography 2019 & 2032
- Table 130: Global Marine Acoustic Sensors Market Volume K Unit Forecast, by Geography 2019 & 2032
- Table 131: Global Marine Acoustic Sensors Market Revenue Million Forecast, by Country 2019 & 2032
- Table 132: Global Marine Acoustic Sensors Market Volume K Unit Forecast, by Country 2019 & 2032
- Table 133: Global Marine Acoustic Sensors Market Revenue Million Forecast, by Product 2019 & 2032
- Table 134: Global Marine Acoustic Sensors Market Volume K Unit Forecast, by Product 2019 & 2032
- Table 135: Global Marine Acoustic Sensors Market Revenue Million Forecast, by Application 2019 & 2032
- Table 136: Global Marine Acoustic Sensors Market Volume K Unit Forecast, by Application 2019 & 2032
- Table 137: Global Marine Acoustic Sensors Market Revenue Million Forecast, by Geography 2019 & 2032
- Table 138: Global Marine Acoustic Sensors Market Volume K Unit Forecast, by Geography 2019 & 2032
- Table 139: Global Marine Acoustic Sensors Market Revenue Million Forecast, by Country 2019 & 2032
- Table 140: Global Marine Acoustic Sensors Market Volume K Unit Forecast, by Country 2019 & 2032
Frequently Asked Questions
1. What is the projected Compound Annual Growth Rate (CAGR) of the Marine Acoustic Sensors Market?
The projected CAGR is approximately 6.41%.
2. Which companies are prominent players in the Marine Acoustic Sensors Market?
Key companies in the market include Teledyne Marine Technologies (Teledyne Technologies Incorporated), Hottinger Brüel & Kjær (Spectris PLC), Garmin Ltd, Thales Group, BAE Systems PLC, L3harris Technologies Inc, Cobham Ultra Seniorco S à R l, CTS Corporatio, Ocean Sonics Ltd, Geospectrum Technologies Inc.
3. What are the main segments of the Marine Acoustic Sensors Market?
The market segments include Product, Application, Geography.
4. Can you provide details about the market size?
The market size is estimated to be USD 1.46 Million as of 2022.
5. What are some drivers contributing to market growth?
Growing Deployment of Acoustic Navigation for Underwater Positioning; Rising Defense Spending in Several Countries.
6. What are the notable trends driving market growth?
Underwater Transducer to Hold Major Share in the Product Segment.
7. Are there any restraints impacting market growth?
High Initial Setup and Installation Cost; Limited Product variety and Capacity.
8. Can you provide examples of recent developments in the market?
June 2023 - RPS presented Neptune, the predictive algorithm for accurately and reliably detecting marine mammal vocalizations. The sub-sea sound emitted during the in-field development of offshore wind and oil and gas exploration efforts can potentially negatively impact marine mammals, causing temporary and permanent hearing loss, disrupted feeding and breeding cycles, and even physical injury.
9. What pricing options are available for accessing the report?
Pricing options include single-user, multi-user, and enterprise licenses priced at USD 4750, USD 5250, and USD 8750 respectively.
10. Is the market size provided in terms of value or volume?
The market size is provided in terms of value, measured in Million and volume, measured in K Unit.
11. Are there any specific market keywords associated with the report?
Yes, the market keyword associated with the report is "Marine Acoustic Sensors Market," which aids in identifying and referencing the specific market segment covered.
12. How do I determine which pricing option suits my needs best?
The pricing options vary based on user requirements and access needs. Individual users may opt for single-user licenses, while businesses requiring broader access may choose multi-user or enterprise licenses for cost-effective access to the report.
13. Are there any additional resources or data provided in the Marine Acoustic Sensors Market report?
While the report offers comprehensive insights, it's advisable to review the specific contents or supplementary materials provided to ascertain if additional resources or data are available.
14. How can I stay updated on further developments or reports in the Marine Acoustic Sensors Market?
To stay informed about further developments, trends, and reports in the Marine Acoustic Sensors Market, consider subscribing to industry newsletters, following relevant companies and organizations, or regularly checking reputable industry news sources and publications.
Methodology
Step 1 - Identification of Relevant Samples Size from Population Database


Step 2 - Approaches for Defining Global Market Size (Value, Volume* & Price*)

Note*: In applicable scenarios
Step 3 - Data Sources
Primary Research
- Web Analytics
- Survey Reports
- Research Institute
- Latest Research Reports
- Opinion Leaders
Secondary Research
- Annual Reports
- White Paper
- Latest Press Release
- Industry Association
- Paid Database
- Investor Presentations

Step 4 - Data Triangulation
Involves using different sources of information in order to increase the validity of a study
These sources are likely to be stakeholders in a program - participants, other researchers, program staff, other community members, and so on.
Then we put all data in single framework & apply various statistical tools to find out the dynamic on the market.
During the analysis stage, feedback from the stakeholder groups would be compared to determine areas of agreement as well as areas of divergence


