

Key Insights
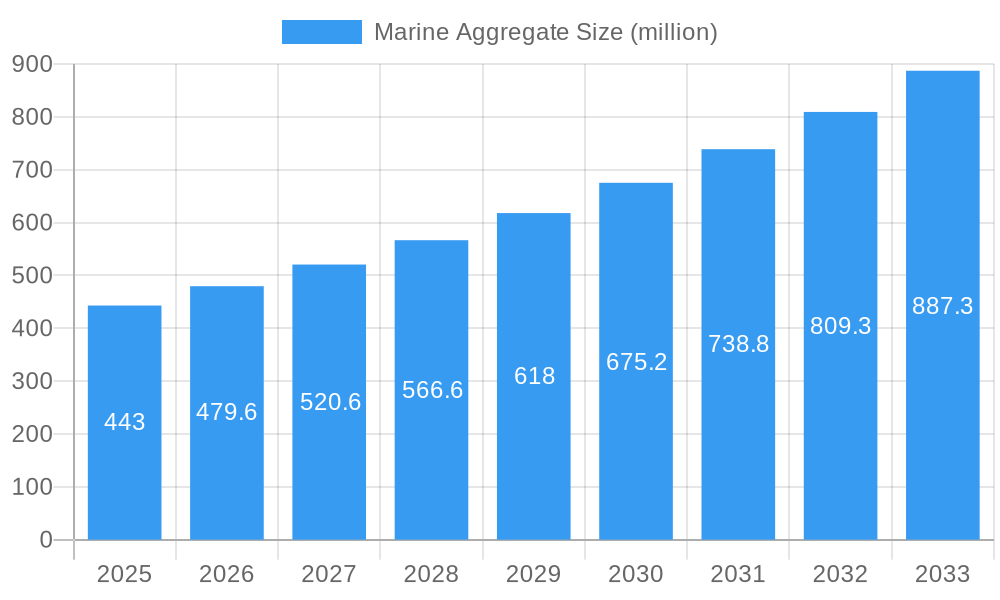
The marine aggregate market, currently valued at $443 million in 2025, is projected to experience robust growth, driven by a compound annual growth rate (CAGR) of 8.3% from 2025 to 2033. This expansion is fueled by several key factors. Increasing infrastructure development, particularly in coastal regions and port expansion projects globally, necessitates substantial quantities of marine aggregates for construction and land reclamation. Furthermore, the growing demand for sustainable construction materials is boosting the adoption of marine aggregates as a more environmentally friendly alternative to land-based aggregates, reducing the environmental impact of quarrying. The rising popularity of offshore wind energy projects also contributes significantly to market growth, as these projects require large volumes of aggregates for foundation construction and seabed stabilization. Key players like Boskalis, DEME Group, and CEMEX UK are actively shaping the market landscape through technological advancements and strategic partnerships, enhancing efficiency and sustainability within the industry.
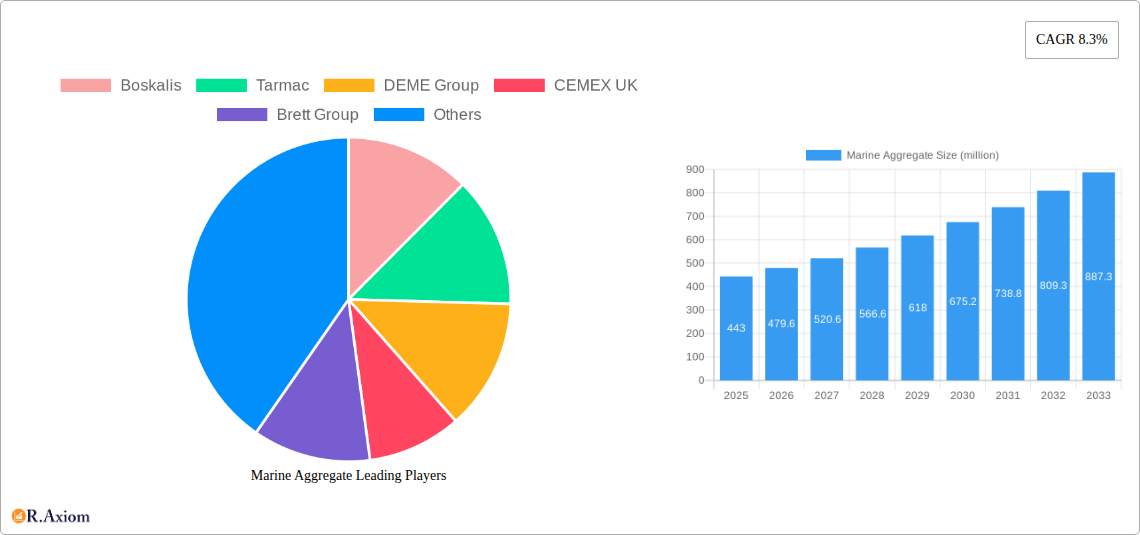
Marine Aggregate Market Size (In Million)
However, the market also faces challenges. Regulatory hurdles related to marine aggregate extraction and environmental concerns regarding potential habitat disruption and water quality impact can slow down expansion in certain regions. Fluctuations in global commodity prices and the availability of alternative construction materials can also pose uncertainties to the market's trajectory. Despite these constraints, the overall market outlook remains positive, with considerable potential for growth driven by ongoing infrastructure development and the increasing need for sustainable and economically viable construction solutions. The strategic diversification of key players into new geographic markets and the continuous innovation in dredging and extraction technologies are expected to further drive the sector's future progress.
Marine Aggregate Company Market Share
Marine Aggregate Market Report: 2019-2033 - A Comprehensive Analysis
This in-depth report provides a comprehensive analysis of the global marine aggregate market from 2019 to 2033, offering invaluable insights for industry stakeholders, investors, and strategic decision-makers. The report leverages rigorous research methodologies and incorporates real-world data to paint a vivid picture of the current market landscape and forecast future trends. With a focus on market concentration, innovation, dominant segments, and key players like Boskalis, Tarmac, and DEME Group, this report is your essential guide to navigating the complexities of the marine aggregate industry. The study period covers 2019-2033, with 2025 as the base and estimated year. The forecast period is 2025-2033 and the historical period is 2019-2024.
Marine Aggregate Market Concentration & Innovation
The marine aggregate market exhibits moderate concentration, with a few major players holding significant market share. While precise market share figures for each company are unavailable without specific data, we estimate that the top five players (Boskalis, Tarmac, DEME Group, CEMEX UK, and Brett Group) collectively hold approximately xx% of the global market share in 2025. This concentration is driven by significant capital investment requirements for dredging and processing infrastructure.
Innovation in marine aggregate extraction and processing is primarily focused on improving efficiency, reducing environmental impact, and enhancing product quality. Key drivers include:
- Technological advancements: Automated dredging systems, improved material sorting technologies, and the application of data analytics for optimized operations.
- Environmental regulations: Stricter environmental standards are pushing innovation towards sustainable extraction methods and reducing the carbon footprint of aggregate production.
- M&A activities: Consolidation within the industry through mergers and acquisitions (M&A) is leading to increased efficiency, expanded market reach, and technological integration. While precise M&A deal values are not publicly available for all transactions, we estimate that over the last five years, deal values have totaled approximately $xx million.
- Product substitution: The emergence of alternative construction materials presents a challenge, but also an opportunity for innovation in value-added products and specialized applications of marine aggregates.
- End-user trends: The growth in infrastructure development and construction projects globally is a significant driver.
Marine Aggregate Industry Trends & Insights
The marine aggregate market is projected to experience substantial growth during the forecast period (2025-2033), with a Compound Annual Growth Rate (CAGR) of approximately xx%. Several factors are fueling this expansion:
The increasing demand for construction materials in rapidly developing economies drives market growth. Technological disruptions such as automation and data analytics are optimizing extraction and processing. Consumer preferences for sustainable construction materials and stringent environmental regulations are pushing innovation towards eco-friendly practices. Competitive dynamics are intensifying, leading to price optimization and a focus on value-added services. Market penetration of marine aggregates in specialized applications like offshore wind farm construction and coastal protection is increasing significantly.
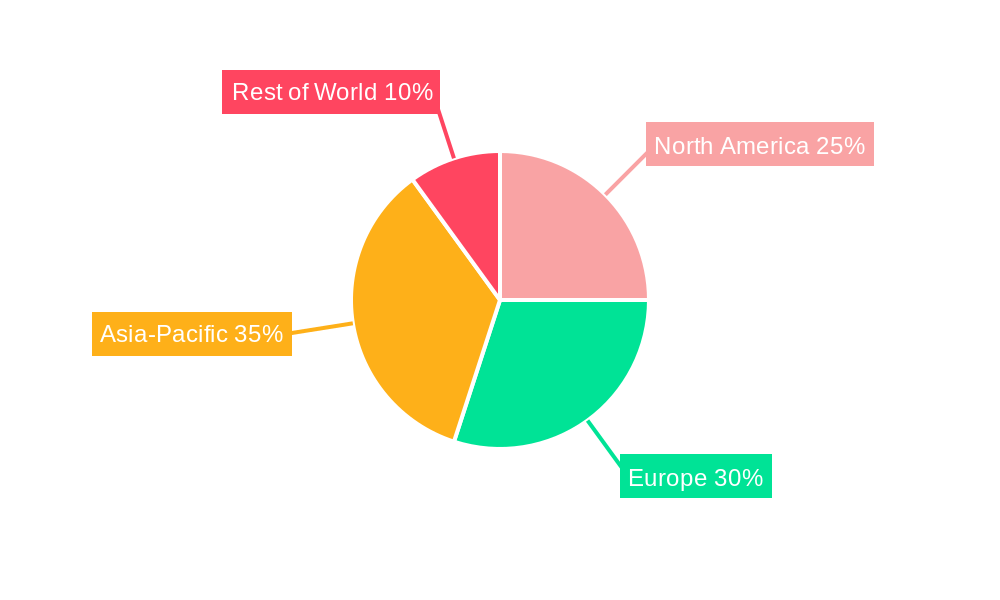
Dominant Markets & Segments in Marine Aggregate
The dominant region in the marine aggregate market is currently xx, driven primarily by rapid infrastructure development and large-scale construction projects. Within this region, xx is the leading country, benefiting from favorable government policies supporting infrastructure development and significant demand from the construction sector.
Key Drivers in Dominant Regions/Countries:
- Robust economic growth and infrastructure spending.
- Favorable government policies and regulations supporting the construction sector.
- High population density and urbanization leading to increased housing and infrastructure needs.
- Significant investments in large-scale construction projects, including ports, roads, and bridges.
A detailed dominance analysis reveals that the success in these regions stems from a confluence of factors such as strong governmental support for infrastructure expansion, substantial private sector investment in construction, and the readily accessible marine aggregate resources.
Marine Aggregate Product Developments
Recent product developments in marine aggregate focus on enhancing product quality and consistency through refined processing techniques. The market is witnessing an increasing demand for value-added products tailored to specific applications, such as specialized mixes for high-performance concrete or aggregates pre-treated for enhanced durability. The adoption of advanced technologies is creating opportunities for improving the efficiency and sustainability of marine aggregate production and enhancing its competitive advantages in the construction market.
Report Scope & Segmentation Analysis
This report segments the marine aggregate market by several factors, including:
By Region: North America, Europe, Asia-Pacific, South America, Middle East & Africa. Each region shows unique growth projections based on regional economic activity and infrastructure developments.
By Application: Construction (Residential, Commercial, Infrastructure), Coastal Protection, and other niche applications. Growth varies among these segments due to the unique needs and demands of each sector.
By Material Type: Sand, Gravel, and other types of marine aggregates. Different material types show varying market sizes due to their unique properties and suitability for different projects.
Competitive dynamics vary across different segments due to varying levels of competition, technological advancements, and market dynamics.
Key Drivers of Marine Aggregate Growth
Several factors are propelling the growth of the marine aggregate market:
- Infrastructure development: Government initiatives for large-scale infrastructure projects like roads, ports, and airports.
- Construction boom: The construction industry’s continuous need for construction materials.
- Technological advancements: Efficient extraction and processing technologies.
- Favorable government policies: Policies that encourage and regulate sustainable extraction and development.
Challenges in the Marine Aggregate Sector
The marine aggregate sector faces several challenges:
- Environmental regulations: Compliance costs and restrictions on extraction sites.
- Supply chain disruptions: Logistics complexities and fluctuating material costs.
- Competition from alternative materials: The increasing use of recycled materials and substitutes.
- Fluctuating prices of raw materials: The industry is sensitive to fluctuations in the cost of fuel and equipment.
Emerging Opportunities in Marine Aggregate
Several opportunities are emerging for the marine aggregate industry:
- Sustainable extraction techniques: Demand for environmentally friendly extraction methods.
- New applications: Expanding into niche markets like offshore wind farms and 3D printing.
- Value-added products: Developing specialized aggregates for specific applications.
- Technological innovation: Utilizing advanced technologies for increased efficiency and sustainable mining practices.
Leading Players in the Marine Aggregate Market
- Boskalis
- Tarmac
- DEME Group
- CEMEX UK
- Brett Group
- Volker Dredging
- Heidelberg Materials UK
- Martin Marietta Materials
- Metsähallitus
- Dudman
- Royal IHC
- The Crown Estate
- Rudus
- Dalian Jialin Environmental Protection Building Materials Co., Ltd.
Key Developments in Marine Aggregate Industry
- 2022 Q4: DEME Group launched a new generation of dredging vessels incorporating advanced automation and emission reduction technologies. This significantly impacts market competitiveness.
- 2023 Q1: Tarmac announced a strategic partnership to develop sustainable marine aggregate extraction methods. This initiative contributes to enhancing the environmental profile of the sector.
- 2023 Q2: A major merger between two smaller marine aggregate companies resulted in a significant increase in market share. This consolidation affects market dynamics. (Further developments can be added here as data becomes available)
Strategic Outlook for Marine Aggregate Market
The marine aggregate market is poised for sustained growth, driven by robust global infrastructure development and the increasing demand for construction materials. Further technological advancements in extraction and processing, coupled with a focus on sustainability and environmental responsibility, will shape the future landscape. Opportunities exist for companies to differentiate themselves by offering innovative solutions and value-added products catering to specific market needs. The market presents significant potential for expansion, especially in developing economies with substantial infrastructure investment plans.
Marine Aggregate Segmentation
-
1. Application
- 1.1. Architecture
- 1.2. Transportation
- 1.3. Beaches
- 1.4. Coastal Defense
- 1.5. Other
-
2. Type
- 2.1. Marine Sand
- 2.2. Marine Gravel
- 2.3. Others
Marine Aggregate Segmentation By Geography
-
1. North America
- 1.1. United States
- 1.2. Canada
- 1.3. Mexico
-
2. South America
- 2.1. Brazil
- 2.2. Argentina
- 2.3. Rest of South America
-
3. Europe
- 3.1. United Kingdom
- 3.2. Germany
- 3.3. France
- 3.4. Italy
- 3.5. Spain
- 3.6. Russia
- 3.7. Benelux
- 3.8. Nordics
- 3.9. Rest of Europe
-
4. Middle East & Africa
- 4.1. Turkey
- 4.2. Israel
- 4.3. GCC
- 4.4. North Africa
- 4.5. South Africa
- 4.6. Rest of Middle East & Africa
-
5. Asia Pacific
- 5.1. China
- 5.2. India
- 5.3. Japan
- 5.4. South Korea
- 5.5. ASEAN
- 5.6. Oceania
- 5.7. Rest of Asia Pacific
Marine Aggregate Regional Market Share
Geographic Coverage of Marine Aggregate
Marine Aggregate REPORT HIGHLIGHTS
| Aspects | Details |
|---|---|
| Study Period | 2020-2034 |
| Base Year | 2025 |
| Estimated Year | 2026 |
| Forecast Period | 2026-2034 |
| Historical Period | 2020-2025 |
| Growth Rate | CAGR of 8.3% from 2020-2034 |
| Segmentation |
|
Table of Contents
- 1. Introduction
- 1.1. Research Scope
- 1.2. Market Segmentation
- 1.3. Research Objective
- 1.4. Definitions and Assumptions
- 2. Executive Summary
- 2.1. Market Snapshot
- 3. Market Dynamics
- 3.1. Market Drivers
- 3.2. Market Restrains
- 3.3. Market Trends
- 3.4. Market Opportunities
- 4. Market Factor Analysis
- 4.1. Porters Five Forces
- 4.1.1. Bargaining Power of Suppliers
- 4.1.2. Bargaining Power of Buyers
- 4.1.3. Threat of New Entrants
- 4.1.4. Threat of Substitutes
- 4.1.5. Competitive Rivalry
- 4.2. PESTEL analysis
- 4.3. BCG Analysis
- 4.3.1. Stars (High Growth, High Market Share)
- 4.3.2. Cash Cows (Low Growth, High Market Share)
- 4.3.3. Question Mark (High Growth, Low Market Share)
- 4.3.4. Dogs (Low Growth, Low Market Share)
- 4.4. Ansoff Matrix Analysis
- 4.5. Supply Chain Analysis
- 4.6. Regulatory Landscape
- 4.7. Current Market Potential and Opportunity Assessment (TAM–SAM–SOM Framework)
- 4.8. RAX Analyst Note
- 4.1. Porters Five Forces
- 5. Market Analysis, Insights and Forecast 2021-2033
- 5.1. Market Analysis, Insights and Forecast - by Application
- 5.1.1. Architecture
- 5.1.2. Transportation
- 5.1.3. Beaches
- 5.1.4. Coastal Defense
- 5.1.5. Other
- 5.2. Market Analysis, Insights and Forecast - by Type
- 5.2.1. Marine Sand
- 5.2.2. Marine Gravel
- 5.2.3. Others
- 5.3. Market Analysis, Insights and Forecast - by Region
- 5.3.1. North America
- 5.3.2. South America
- 5.3.3. Europe
- 5.3.4. Middle East & Africa
- 5.3.5. Asia Pacific
- 5.1. Market Analysis, Insights and Forecast - by Application
- 6. Global Marine Aggregate Analysis, Insights and Forecast, 2021-2033
- 6.1. Market Analysis, Insights and Forecast - by Application
- 6.1.1. Architecture
- 6.1.2. Transportation
- 6.1.3. Beaches
- 6.1.4. Coastal Defense
- 6.1.5. Other
- 6.2. Market Analysis, Insights and Forecast - by Type
- 6.2.1. Marine Sand
- 6.2.2. Marine Gravel
- 6.2.3. Others
- 6.1. Market Analysis, Insights and Forecast - by Application
- 7. North America Marine Aggregate Analysis, Insights and Forecast, 2020-2032
- 7.1. Market Analysis, Insights and Forecast - by Application
- 7.1.1. Architecture
- 7.1.2. Transportation
- 7.1.3. Beaches
- 7.1.4. Coastal Defense
- 7.1.5. Other
- 7.2. Market Analysis, Insights and Forecast - by Type
- 7.2.1. Marine Sand
- 7.2.2. Marine Gravel
- 7.2.3. Others
- 7.1. Market Analysis, Insights and Forecast - by Application
- 8. South America Marine Aggregate Analysis, Insights and Forecast, 2020-2032
- 8.1. Market Analysis, Insights and Forecast - by Application
- 8.1.1. Architecture
- 8.1.2. Transportation
- 8.1.3. Beaches
- 8.1.4. Coastal Defense
- 8.1.5. Other
- 8.2. Market Analysis, Insights and Forecast - by Type
- 8.2.1. Marine Sand
- 8.2.2. Marine Gravel
- 8.2.3. Others
- 8.1. Market Analysis, Insights and Forecast - by Application
- 9. Europe Marine Aggregate Analysis, Insights and Forecast, 2020-2032
- 9.1. Market Analysis, Insights and Forecast - by Application
- 9.1.1. Architecture
- 9.1.2. Transportation
- 9.1.3. Beaches
- 9.1.4. Coastal Defense
- 9.1.5. Other
- 9.2. Market Analysis, Insights and Forecast - by Type
- 9.2.1. Marine Sand
- 9.2.2. Marine Gravel
- 9.2.3. Others
- 9.1. Market Analysis, Insights and Forecast - by Application
- 10. Middle East & Africa Marine Aggregate Analysis, Insights and Forecast, 2020-2032
- 10.1. Market Analysis, Insights and Forecast - by Application
- 10.1.1. Architecture
- 10.1.2. Transportation
- 10.1.3. Beaches
- 10.1.4. Coastal Defense
- 10.1.5. Other
- 10.2. Market Analysis, Insights and Forecast - by Type
- 10.2.1. Marine Sand
- 10.2.2. Marine Gravel
- 10.2.3. Others
- 10.1. Market Analysis, Insights and Forecast - by Application
- 11. Asia Pacific Marine Aggregate Analysis, Insights and Forecast, 2020-2032
- 11.1. Market Analysis, Insights and Forecast - by Application
- 11.1.1. Architecture
- 11.1.2. Transportation
- 11.1.3. Beaches
- 11.1.4. Coastal Defense
- 11.1.5. Other
- 11.2. Market Analysis, Insights and Forecast - by Type
- 11.2.1. Marine Sand
- 11.2.2. Marine Gravel
- 11.2.3. Others
- 11.1. Market Analysis, Insights and Forecast - by Application
- 12. Competitive Analysis
- 12.1. Company Profiles
- 12.1.1 Boskalis
- 12.1.1.1. Company Overview
- 12.1.1.2. Products
- 12.1.1.3. Company Financials
- 12.1.1.4. SWOT Analysis
- 12.1.2 Tarmac
- 12.1.2.1. Company Overview
- 12.1.2.2. Products
- 12.1.2.3. Company Financials
- 12.1.2.4. SWOT Analysis
- 12.1.3 DEME Group
- 12.1.3.1. Company Overview
- 12.1.3.2. Products
- 12.1.3.3. Company Financials
- 12.1.3.4. SWOT Analysis
- 12.1.4 CEMEX UK
- 12.1.4.1. Company Overview
- 12.1.4.2. Products
- 12.1.4.3. Company Financials
- 12.1.4.4. SWOT Analysis
- 12.1.5 Brett Group
- 12.1.5.1. Company Overview
- 12.1.5.2. Products
- 12.1.5.3. Company Financials
- 12.1.5.4. SWOT Analysis
- 12.1.6 Volker Dredging
- 12.1.6.1. Company Overview
- 12.1.6.2. Products
- 12.1.6.3. Company Financials
- 12.1.6.4. SWOT Analysis
- 12.1.7 Heidelberg Materials UK
- 12.1.7.1. Company Overview
- 12.1.7.2. Products
- 12.1.7.3. Company Financials
- 12.1.7.4. SWOT Analysis
- 12.1.8 Martin Marietta Materials
- 12.1.8.1. Company Overview
- 12.1.8.2. Products
- 12.1.8.3. Company Financials
- 12.1.8.4. SWOT Analysis
- 12.1.9 Metsähallitus
- 12.1.9.1. Company Overview
- 12.1.9.2. Products
- 12.1.9.3. Company Financials
- 12.1.9.4. SWOT Analysis
- 12.1.10 Dudman
- 12.1.10.1. Company Overview
- 12.1.10.2. Products
- 12.1.10.3. Company Financials
- 12.1.10.4. SWOT Analysis
- 12.1.11 Royal IHC
- 12.1.11.1. Company Overview
- 12.1.11.2. Products
- 12.1.11.3. Company Financials
- 12.1.11.4. SWOT Analysis
- 12.1.12 The Crown Estate
- 12.1.12.1. Company Overview
- 12.1.12.2. Products
- 12.1.12.3. Company Financials
- 12.1.12.4. SWOT Analysis
- 12.1.13 Rudus
- 12.1.13.1. Company Overview
- 12.1.13.2. Products
- 12.1.13.3. Company Financials
- 12.1.13.4. SWOT Analysis
- 12.1.14 Dalian Jialin Environmental Protection Building Materials Co. Ltd.
- 12.1.14.1. Company Overview
- 12.1.14.2. Products
- 12.1.14.3. Company Financials
- 12.1.14.4. SWOT Analysis
- 12.1.1 Boskalis
- 12.2. Market Entropy
- 12.2.1 Company's Key Areas Served
- 12.2.2 Recent Developments
- 12.3. Company Market Share Analysis 2025
- 12.3.1 Top 5 Companies Market Share Analysis
- 12.3.2 Top 3 Companies Market Share Analysis
- 12.4. List of Potential Customers
- 13. Research Methodology
List of Figures
- Figure 1: Global Marine Aggregate Revenue Breakdown (million, %) by Region 2025 & 2033
- Figure 2: North America Marine Aggregate Revenue (million), by Application 2025 & 2033
- Figure 3: North America Marine Aggregate Revenue Share (%), by Application 2025 & 2033
- Figure 4: North America Marine Aggregate Revenue (million), by Type 2025 & 2033
- Figure 5: North America Marine Aggregate Revenue Share (%), by Type 2025 & 2033
- Figure 6: North America Marine Aggregate Revenue (million), by Country 2025 & 2033
- Figure 7: North America Marine Aggregate Revenue Share (%), by Country 2025 & 2033
- Figure 8: South America Marine Aggregate Revenue (million), by Application 2025 & 2033
- Figure 9: South America Marine Aggregate Revenue Share (%), by Application 2025 & 2033
- Figure 10: South America Marine Aggregate Revenue (million), by Type 2025 & 2033
- Figure 11: South America Marine Aggregate Revenue Share (%), by Type 2025 & 2033
- Figure 12: South America Marine Aggregate Revenue (million), by Country 2025 & 2033
- Figure 13: South America Marine Aggregate Revenue Share (%), by Country 2025 & 2033
- Figure 14: Europe Marine Aggregate Revenue (million), by Application 2025 & 2033
- Figure 15: Europe Marine Aggregate Revenue Share (%), by Application 2025 & 2033
- Figure 16: Europe Marine Aggregate Revenue (million), by Type 2025 & 2033
- Figure 17: Europe Marine Aggregate Revenue Share (%), by Type 2025 & 2033
- Figure 18: Europe Marine Aggregate Revenue (million), by Country 2025 & 2033
- Figure 19: Europe Marine Aggregate Revenue Share (%), by Country 2025 & 2033
- Figure 20: Middle East & Africa Marine Aggregate Revenue (million), by Application 2025 & 2033
- Figure 21: Middle East & Africa Marine Aggregate Revenue Share (%), by Application 2025 & 2033
- Figure 22: Middle East & Africa Marine Aggregate Revenue (million), by Type 2025 & 2033
- Figure 23: Middle East & Africa Marine Aggregate Revenue Share (%), by Type 2025 & 2033
- Figure 24: Middle East & Africa Marine Aggregate Revenue (million), by Country 2025 & 2033
- Figure 25: Middle East & Africa Marine Aggregate Revenue Share (%), by Country 2025 & 2033
- Figure 26: Asia Pacific Marine Aggregate Revenue (million), by Application 2025 & 2033
- Figure 27: Asia Pacific Marine Aggregate Revenue Share (%), by Application 2025 & 2033
- Figure 28: Asia Pacific Marine Aggregate Revenue (million), by Type 2025 & 2033
- Figure 29: Asia Pacific Marine Aggregate Revenue Share (%), by Type 2025 & 2033
- Figure 30: Asia Pacific Marine Aggregate Revenue (million), by Country 2025 & 2033
- Figure 31: Asia Pacific Marine Aggregate Revenue Share (%), by Country 2025 & 2033
List of Tables
- Table 1: Global Marine Aggregate Revenue million Forecast, by Application 2020 & 2033
- Table 2: Global Marine Aggregate Revenue million Forecast, by Type 2020 & 2033
- Table 3: Global Marine Aggregate Revenue million Forecast, by Region 2020 & 2033
- Table 4: Global Marine Aggregate Revenue million Forecast, by Application 2020 & 2033
- Table 5: Global Marine Aggregate Revenue million Forecast, by Type 2020 & 2033
- Table 6: Global Marine Aggregate Revenue million Forecast, by Country 2020 & 2033
- Table 7: United States Marine Aggregate Revenue (million) Forecast, by Application 2020 & 2033
- Table 8: Canada Marine Aggregate Revenue (million) Forecast, by Application 2020 & 2033
- Table 9: Mexico Marine Aggregate Revenue (million) Forecast, by Application 2020 & 2033
- Table 10: Global Marine Aggregate Revenue million Forecast, by Application 2020 & 2033
- Table 11: Global Marine Aggregate Revenue million Forecast, by Type 2020 & 2033
- Table 12: Global Marine Aggregate Revenue million Forecast, by Country 2020 & 2033
- Table 13: Brazil Marine Aggregate Revenue (million) Forecast, by Application 2020 & 2033
- Table 14: Argentina Marine Aggregate Revenue (million) Forecast, by Application 2020 & 2033
- Table 15: Rest of South America Marine Aggregate Revenue (million) Forecast, by Application 2020 & 2033
- Table 16: Global Marine Aggregate Revenue million Forecast, by Application 2020 & 2033
- Table 17: Global Marine Aggregate Revenue million Forecast, by Type 2020 & 2033
- Table 18: Global Marine Aggregate Revenue million Forecast, by Country 2020 & 2033
- Table 19: United Kingdom Marine Aggregate Revenue (million) Forecast, by Application 2020 & 2033
- Table 20: Germany Marine Aggregate Revenue (million) Forecast, by Application 2020 & 2033
- Table 21: France Marine Aggregate Revenue (million) Forecast, by Application 2020 & 2033
- Table 22: Italy Marine Aggregate Revenue (million) Forecast, by Application 2020 & 2033
- Table 23: Spain Marine Aggregate Revenue (million) Forecast, by Application 2020 & 2033
- Table 24: Russia Marine Aggregate Revenue (million) Forecast, by Application 2020 & 2033
- Table 25: Benelux Marine Aggregate Revenue (million) Forecast, by Application 2020 & 2033
- Table 26: Nordics Marine Aggregate Revenue (million) Forecast, by Application 2020 & 2033
- Table 27: Rest of Europe Marine Aggregate Revenue (million) Forecast, by Application 2020 & 2033
- Table 28: Global Marine Aggregate Revenue million Forecast, by Application 2020 & 2033
- Table 29: Global Marine Aggregate Revenue million Forecast, by Type 2020 & 2033
- Table 30: Global Marine Aggregate Revenue million Forecast, by Country 2020 & 2033
- Table 31: Turkey Marine Aggregate Revenue (million) Forecast, by Application 2020 & 2033
- Table 32: Israel Marine Aggregate Revenue (million) Forecast, by Application 2020 & 2033
- Table 33: GCC Marine Aggregate Revenue (million) Forecast, by Application 2020 & 2033
- Table 34: North Africa Marine Aggregate Revenue (million) Forecast, by Application 2020 & 2033
- Table 35: South Africa Marine Aggregate Revenue (million) Forecast, by Application 2020 & 2033
- Table 36: Rest of Middle East & Africa Marine Aggregate Revenue (million) Forecast, by Application 2020 & 2033
- Table 37: Global Marine Aggregate Revenue million Forecast, by Application 2020 & 2033
- Table 38: Global Marine Aggregate Revenue million Forecast, by Type 2020 & 2033
- Table 39: Global Marine Aggregate Revenue million Forecast, by Country 2020 & 2033
- Table 40: China Marine Aggregate Revenue (million) Forecast, by Application 2020 & 2033
- Table 41: India Marine Aggregate Revenue (million) Forecast, by Application 2020 & 2033
- Table 42: Japan Marine Aggregate Revenue (million) Forecast, by Application 2020 & 2033
- Table 43: South Korea Marine Aggregate Revenue (million) Forecast, by Application 2020 & 2033
- Table 44: ASEAN Marine Aggregate Revenue (million) Forecast, by Application 2020 & 2033
- Table 45: Oceania Marine Aggregate Revenue (million) Forecast, by Application 2020 & 2033
- Table 46: Rest of Asia Pacific Marine Aggregate Revenue (million) Forecast, by Application 2020 & 2033
Frequently Asked Questions
1. What is the projected Compound Annual Growth Rate (CAGR) of the Marine Aggregate?
The projected CAGR is approximately 8.3%.
2. Which companies are prominent players in the Marine Aggregate?
Key companies in the market include Boskalis, Tarmac, DEME Group, CEMEX UK, Brett Group, Volker Dredging, Heidelberg Materials UK, Martin Marietta Materials, Metsähallitus, Dudman, Royal IHC, The Crown Estate, Rudus, Dalian Jialin Environmental Protection Building Materials Co., Ltd..
3. What are the main segments of the Marine Aggregate?
The market segments include Application, Type.
4. Can you provide details about the market size?
The market size is estimated to be USD 443 million as of 2022.
5. What are some drivers contributing to market growth?
N/A
6. What are the notable trends driving market growth?
N/A
7. Are there any restraints impacting market growth?
N/A
8. Can you provide examples of recent developments in the market?
N/A
9. What pricing options are available for accessing the report?
Pricing options include single-user, multi-user, and enterprise licenses priced at USD 2900.00, USD 4350.00, and USD 5800.00 respectively.
10. Is the market size provided in terms of value or volume?
The market size is provided in terms of value, measured in million.
11. Are there any specific market keywords associated with the report?
Yes, the market keyword associated with the report is "Marine Aggregate," which aids in identifying and referencing the specific market segment covered.
12. How do I determine which pricing option suits my needs best?
The pricing options vary based on user requirements and access needs. Individual users may opt for single-user licenses, while businesses requiring broader access may choose multi-user or enterprise licenses for cost-effective access to the report.
13. Are there any additional resources or data provided in the Marine Aggregate report?
While the report offers comprehensive insights, it's advisable to review the specific contents or supplementary materials provided to ascertain if additional resources or data are available.
14. How can I stay updated on further developments or reports in the Marine Aggregate?
To stay informed about further developments, trends, and reports in the Marine Aggregate, consider subscribing to industry newsletters, following relevant companies and organizations, or regularly checking reputable industry news sources and publications.
Methodology
Step 1 - Identification of Relevant Samples Size from Population Database


Step 2 - Approaches for Defining Global Market Size (Value, Volume* & Price*)

Note*: In applicable scenarios
Step 3 - Data Sources
Primary Research
- Web Analytics
- Survey Reports
- Research Institute
- Latest Research Reports
- Opinion Leaders
Secondary Research
- Annual Reports
- White Paper
- Latest Press Release
- Industry Association
- Paid Database
- Investor Presentations

Step 4 - Data Triangulation
Involves using different sources of information in order to increase the validity of a study
These sources are likely to be stakeholders in a program - participants, other researchers, program staff, other community members, and so on.
Then we put all data in single framework & apply various statistical tools to find out the dynamic on the market.
During the analysis stage, feedback from the stakeholder groups would be compared to determine areas of agreement as well as areas of divergence