
Key Insights
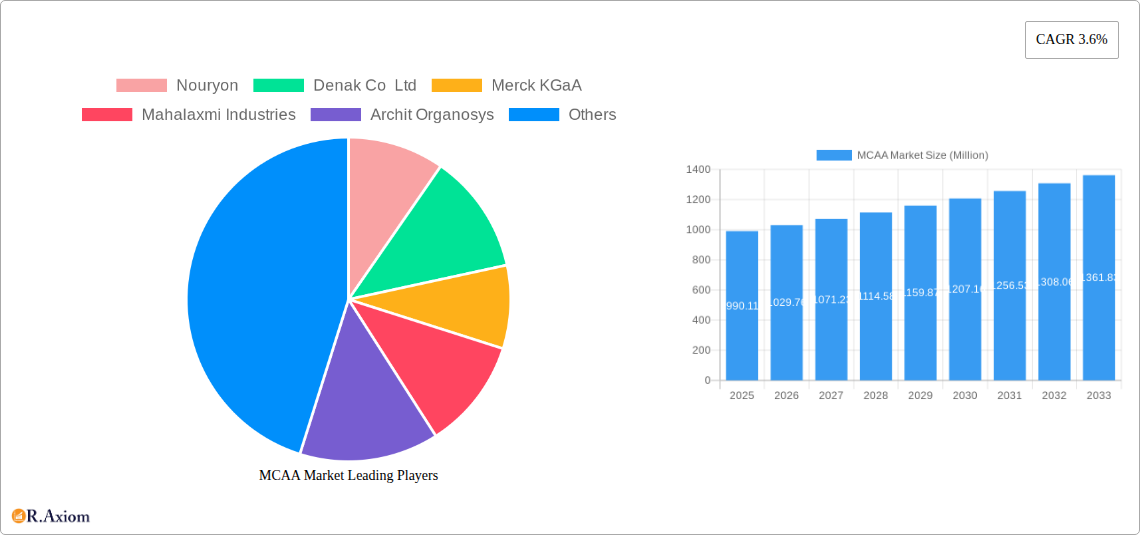
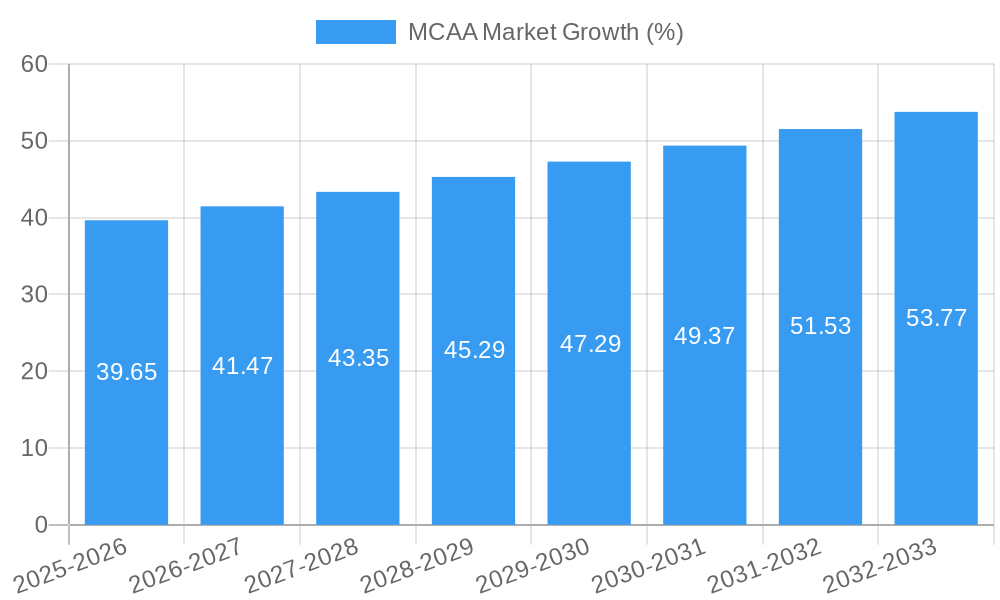
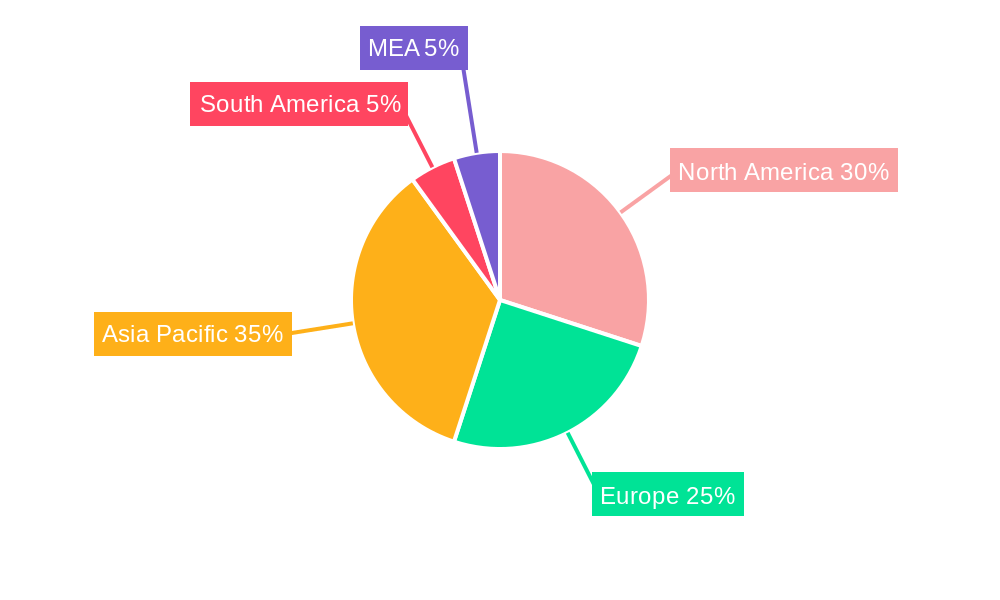
The Mono Chloro Acetic Acid (MCAA) market, valued at $990.11 million in 2025, is projected to experience steady growth, driven by its diverse applications across various sectors. A Compound Annual Growth Rate (CAGR) of 3.6% from 2025 to 2033 indicates a sustained market expansion. Key drivers include the increasing demand for MCAA in the pharmaceutical and personal care industries, fueled by its use as an intermediate in the synthesis of various pharmaceuticals and cosmetic ingredients. The agrochemical sector also contributes significantly to MCAA demand, with its application as a herbicide precursor. Furthermore, the burgeoning growth of the dyes and detergents industry necessitates a greater supply of MCAA as a crucial raw material. However, stringent environmental regulations regarding the production and handling of MCAA pose a significant restraint, impacting market growth. The market segmentation reveals a strong reliance on chemical applications such as glycine, carboxymethylcellulose (CMC), and surfactants, underscoring their importance in the overall market value. Geographic distribution showcases a multi-polar market, with North America, Europe, and Asia Pacific likely holding significant market shares, driven by established industrial bases and robust consumer markets in these regions. The competitive landscape is characterized by a mix of large multinational corporations and regional players, suggesting a dynamic and evolving market structure.
The future trajectory of the MCAA market hinges on technological advancements in production processes aimed at minimizing environmental impact. Industry consolidation and strategic partnerships are likely to reshape the competitive landscape. Emerging economies in Asia-Pacific are poised to drive significant market expansion, particularly in regions like India and China, which are witnessing rapid industrialization and increased demand for chemical intermediates. The ongoing research and development efforts focused on developing more sustainable and efficient MCAA production methods will play a pivotal role in shaping the market's long-term prospects. Increased consumer awareness of environmental sustainability and stricter regulations will likely prompt manufacturers to adopt cleaner production technologies, driving innovation and fostering responsible market growth.
This in-depth report provides a comprehensive analysis of the Monochloroacetic Acid (MCAA) market, offering invaluable insights for stakeholders across the value chain. Covering the period from 2019 to 2033, with a focus on 2025, this report unveils key market trends, competitive dynamics, and future growth opportunities. The report leverages extensive data analysis to project a market size of XX Million by 2033, offering a detailed breakdown by segment and region.
MCAA Market Concentration & Innovation
The MCAA market exhibits a moderately concentrated landscape, with key players holding significant market share. Nouryon, Merck KGaA, and PCC Group are among the leading players, each contributing approximately XX% to the total market value in 2025 (estimated). The market's innovation landscape is driven by the development of sustainable and efficient production processes, coupled with efforts to expand applications in high-growth sectors like personal care and pharmaceuticals. Regulatory frameworks, particularly concerning environmental regulations, are also key drivers of innovation. The market has witnessed several M&A activities in recent years, with deal values totaling approximately XX Million in the last five years. These mergers and acquisitions are mainly driven by companies seeking to expand their market reach, enhance their product portfolios, and improve operational efficiencies.
- Market Concentration: Moderately concentrated, with top three players holding XX% market share (2025 estimate).
- Innovation Drivers: Sustainable production, expanded applications, and environmental regulations.
- M&A Activity: Total deal value approximately XX Million over the past five years.
- Regulatory Framework: Stringent environmental regulations shaping product development and market entry.
- Product Substitutes: Limited direct substitutes, but alternative chemicals pose indirect competition.
- End-User Trends: Growing demand from personal care and pharmaceutical sectors.
MCAA Market Industry Trends & Insights
The MCAA market is poised for robust growth, driven by rising demand from diverse end-user industries, particularly personal care, pharmaceuticals, and agrochemicals. The market registered a CAGR of XX% during the historical period (2019-2024) and is projected to maintain a steady CAGR of XX% during the forecast period (2025-2033). Technological advancements in production processes are contributing to cost reduction and increased efficiency. Consumer preferences for sustainable and ethically sourced products are also shaping market dynamics, prompting manufacturers to adopt eco-friendly practices. The competitive landscape is characterized by intense rivalry among established players and emerging entrants, leading to product differentiation and innovation. Market penetration in untapped regions presents significant growth opportunities.
Dominant Markets & Segments in MCAA Market
The Asia-Pacific region is currently the dominant market for MCAA, driven primarily by strong demand from India and China. Within chemical applications, the Glycine and Carboxymethylcellulose (CMC) segments dominate, representing approximately XX% of total market value in 2025 (estimated). In the end-user sector, personal care and pharmaceuticals account for the largest share, with a projected market size of XX Million in 2025 (estimated).
- Key Drivers in Asia-Pacific: Rapid industrialization, increasing population, and rising disposable incomes.
- Dominant Chemical Applications: Glycine and CMC, driven by their wide use in various products.
- Dominant End-User Industries: Personal care and pharmaceuticals, fueled by growing consumer demand.
- Growth Projections (2025-2033): Significant growth anticipated across all major segments and regions.
MCAA Market Product Developments
Recent product developments focus on enhancing the purity and efficiency of MCAA production. Manufacturers are increasingly incorporating sustainable and eco-friendly practices into their manufacturing processes. This focus on improving product quality and sustainability is driving the competitive advantage. Technological advancements, such as the implementation of advanced reaction engineering techniques and the use of renewable energy sources in manufacturing, are shaping the evolution of MCAA products.
Report Scope & Segmentation Analysis
This report segments the MCAA market based on chemical application (Glycine, CMC, Surfactants, 2,4-Dichloro Phenoxy Acetic Acid, Thioglycol Acid, Other Applications) and end-user industry (Personal Care and Pharmaceuticals, Agrochemicals, Geological Drillings, Dyes and Detergents, Other End-user Industries). Each segment's growth trajectory is analyzed, incorporating market size projections, competitive dynamics, and key drivers. The report presents a detailed overview of the market size and growth potential for each segment, considering various factors that influence the market dynamics.
Key Drivers of MCAA Market Growth
The MCAA market is experiencing growth due to several factors, including increasing demand from various end-user industries like pharmaceuticals and agrochemicals. Technological advancements in production methods are also contributing to cost reduction and efficiency improvements. Favorable economic conditions and supportive government policies in certain regions further stimulate market growth. The rising global population and increasing demand for consumer goods are also key drivers.
Challenges in the MCAA Market Sector
The MCAA market faces challenges such as stringent environmental regulations and fluctuations in raw material prices. Supply chain disruptions and intense competition also pose significant challenges for market players. These factors can impact production costs and profitability, affecting the overall market growth. The total impact of these challenges on the market value is estimated to be around XX Million annually.
Emerging Opportunities in MCAA Market
Emerging opportunities include the development of new applications for MCAA in various industries, particularly in the renewable energy sector. Expansion into new geographic markets and the adoption of innovative production technologies present significant opportunities for growth. Furthermore, rising consumer demand for sustainable and eco-friendly products creates opportunities for manufacturers who prioritize sustainability in their production processes.
Leading Players in the MCAA Market Market
- Nouryon
- Denak Co Ltd
- Merck KGaA
- Mahalaxmi Industries
- Archit Organosys
- Jiangxi Biochem Co Ltd
- Alfa Aesar Thermo Fisher Scientific
- Meridian Chem Bond Pvt Ltd
- TerraTech
- PCC Group
- Henan HDF Chemical Company Ltd
- ITALMAR (THAILAND) CO LTD
- Shandong Minji New Material Technology Co Ltd
Key Developments in MCAA Market Industry
- April 2021: Atul Limited and Nouryon launched a joint venture in Gujarat, India, with a 32,000-ton MCA annual production capacity. This significantly increased supply to meet growing demand in Indian agricultural, personal care, and pharmaceutical markets.
- September 2021: Archit Organosys approved a plan to increase production capacity by 12,000 tpa at its Bhavnagar plant, fueled by rising domestic and export demand.
Strategic Outlook for MCAA Market Market
The MCAA market is poised for sustained growth driven by increasing demand from various sectors and technological advancements. The focus on sustainability and efficiency improvements will continue to shape the market dynamics. Exploring new applications and expanding into untapped markets will be key strategic priorities for market players. The market's future potential is substantial, with significant growth opportunities across various segments and regions.
MCAA Market Segmentation
-
1. Chemical Application
- 1.1. Glycine
- 1.2. Carboxymethylcellulose (CMC)
- 1.3. Surfactants
- 1.4. 2,4-Dichloro Phenoxy Acetic Acid
- 1.5. Thioglycol Acid
- 1.6. Other Applications
-
2. End-user Industry
- 2.1. Personal Care and Pharmaceuticals
- 2.2. Agrochemicals
- 2.3. Geological Drillings
- 2.4. Dyes and Detergents
- 2.5. Other End-user Industries
MCAA Market Segmentation By Geography
-
1. Asia Pacific
- 1.1. China
- 1.2. India
- 1.3. Japan
- 1.4. South Korea
- 1.5. Malaysia
- 1.6. Thailand
- 1.7. Indonesia
- 1.8. Vietnam
- 1.9. Rest of Asia Pacific
-
2. North America
- 2.1. United States
- 2.2. Canada
- 2.3. Mexico
-
3. Europe
- 3.1. Germany
- 3.2. United Kingdom
- 3.3. Italy
- 3.4. France
- 3.5. Spain
- 3.6. Nordic Countries
- 3.7. Turkey
- 3.8. Russia
- 3.9. Rest of Europe
-
4. South America
- 4.1. Brazil
- 4.2. Argentina
- 4.3. Colombia
- 4.4. Rest of South America
-
5. Middle East and Africa
- 5.1. Saudi Arabia
- 5.2. Qatar
- 5.3. United Arab Emirates
- 5.4. Nigeria
- 5.5. Egypt
- 5.6. South Africa
- 5.7. Rest of Middle East and Africa
MCAA Market REPORT HIGHLIGHTS
| Aspects | Details |
|---|---|
| Study Period | 2019-2033 |
| Base Year | 2024 |
| Estimated Year | 2025 |
| Forecast Period | 2025-2033 |
| Historical Period | 2019-2024 |
| Growth Rate | CAGR of 3.6% from 2019-2033 |
| Segmentation |
|
Table of Contents
- 1. Introduction
- 1.1. Research Scope
- 1.2. Market Segmentation
- 1.3. Research Methodology
- 1.4. Definitions and Assumptions
- 2. Executive Summary
- 2.1. Introduction
- 3. Market Dynamics
- 3.1. Introduction
- 3.2. Market Drivers
- 3.2.1. Growing consumption from the pharmaceutical Industry; Growing production of agrochemical in the country
- 3.3. Market Restrains
- 3.3.1. Decline in detergent consumption
- 3.4. Market Trends
- 3.4.1. Increasing Demand from Personal Care and Pharmaceuticals Industries
- 4. Market Factor Analysis
- 4.1. Porters Five Forces
- 4.2. Supply/Value Chain
- 4.3. PESTEL analysis
- 4.4. Market Entropy
- 4.5. Patent/Trademark Analysis
- 5. Global MCAA Market Analysis, Insights and Forecast, 2019-2031
- 5.1. Market Analysis, Insights and Forecast - by Chemical Application
- 5.1.1. Glycine
- 5.1.2. Carboxymethylcellulose (CMC)
- 5.1.3. Surfactants
- 5.1.4. 2,4-Dichloro Phenoxy Acetic Acid
- 5.1.5. Thioglycol Acid
- 5.1.6. Other Applications
- 5.2. Market Analysis, Insights and Forecast - by End-user Industry
- 5.2.1. Personal Care and Pharmaceuticals
- 5.2.2. Agrochemicals
- 5.2.3. Geological Drillings
- 5.2.4. Dyes and Detergents
- 5.2.5. Other End-user Industries
- 5.3. Market Analysis, Insights and Forecast - by Region
- 5.3.1. Asia Pacific
- 5.3.2. North America
- 5.3.3. Europe
- 5.3.4. South America
- 5.3.5. Middle East and Africa
- 5.1. Market Analysis, Insights and Forecast - by Chemical Application
- 6. Asia Pacific MCAA Market Analysis, Insights and Forecast, 2019-2031
- 6.1. Market Analysis, Insights and Forecast - by Chemical Application
- 6.1.1. Glycine
- 6.1.2. Carboxymethylcellulose (CMC)
- 6.1.3. Surfactants
- 6.1.4. 2,4-Dichloro Phenoxy Acetic Acid
- 6.1.5. Thioglycol Acid
- 6.1.6. Other Applications
- 6.2. Market Analysis, Insights and Forecast - by End-user Industry
- 6.2.1. Personal Care and Pharmaceuticals
- 6.2.2. Agrochemicals
- 6.2.3. Geological Drillings
- 6.2.4. Dyes and Detergents
- 6.2.5. Other End-user Industries
- 6.1. Market Analysis, Insights and Forecast - by Chemical Application
- 7. North America MCAA Market Analysis, Insights and Forecast, 2019-2031
- 7.1. Market Analysis, Insights and Forecast - by Chemical Application
- 7.1.1. Glycine
- 7.1.2. Carboxymethylcellulose (CMC)
- 7.1.3. Surfactants
- 7.1.4. 2,4-Dichloro Phenoxy Acetic Acid
- 7.1.5. Thioglycol Acid
- 7.1.6. Other Applications
- 7.2. Market Analysis, Insights and Forecast - by End-user Industry
- 7.2.1. Personal Care and Pharmaceuticals
- 7.2.2. Agrochemicals
- 7.2.3. Geological Drillings
- 7.2.4. Dyes and Detergents
- 7.2.5. Other End-user Industries
- 7.1. Market Analysis, Insights and Forecast - by Chemical Application
- 8. Europe MCAA Market Analysis, Insights and Forecast, 2019-2031
- 8.1. Market Analysis, Insights and Forecast - by Chemical Application
- 8.1.1. Glycine
- 8.1.2. Carboxymethylcellulose (CMC)
- 8.1.3. Surfactants
- 8.1.4. 2,4-Dichloro Phenoxy Acetic Acid
- 8.1.5. Thioglycol Acid
- 8.1.6. Other Applications
- 8.2. Market Analysis, Insights and Forecast - by End-user Industry
- 8.2.1. Personal Care and Pharmaceuticals
- 8.2.2. Agrochemicals
- 8.2.3. Geological Drillings
- 8.2.4. Dyes and Detergents
- 8.2.5. Other End-user Industries
- 8.1. Market Analysis, Insights and Forecast - by Chemical Application
- 9. South America MCAA Market Analysis, Insights and Forecast, 2019-2031
- 9.1. Market Analysis, Insights and Forecast - by Chemical Application
- 9.1.1. Glycine
- 9.1.2. Carboxymethylcellulose (CMC)
- 9.1.3. Surfactants
- 9.1.4. 2,4-Dichloro Phenoxy Acetic Acid
- 9.1.5. Thioglycol Acid
- 9.1.6. Other Applications
- 9.2. Market Analysis, Insights and Forecast - by End-user Industry
- 9.2.1. Personal Care and Pharmaceuticals
- 9.2.2. Agrochemicals
- 9.2.3. Geological Drillings
- 9.2.4. Dyes and Detergents
- 9.2.5. Other End-user Industries
- 9.1. Market Analysis, Insights and Forecast - by Chemical Application
- 10. Middle East and Africa MCAA Market Analysis, Insights and Forecast, 2019-2031
- 10.1. Market Analysis, Insights and Forecast - by Chemical Application
- 10.1.1. Glycine
- 10.1.2. Carboxymethylcellulose (CMC)
- 10.1.3. Surfactants
- 10.1.4. 2,4-Dichloro Phenoxy Acetic Acid
- 10.1.5. Thioglycol Acid
- 10.1.6. Other Applications
- 10.2. Market Analysis, Insights and Forecast - by End-user Industry
- 10.2.1. Personal Care and Pharmaceuticals
- 10.2.2. Agrochemicals
- 10.2.3. Geological Drillings
- 10.2.4. Dyes and Detergents
- 10.2.5. Other End-user Industries
- 10.1. Market Analysis, Insights and Forecast - by Chemical Application
- 11. North America MCAA Market Analysis, Insights and Forecast, 2019-2031
- 11.1. Market Analysis, Insights and Forecast - By Country/Sub-region
- 11.1.1 United States
- 11.1.2 Canada
- 11.1.3 Mexico
- 12. Europe MCAA Market Analysis, Insights and Forecast, 2019-2031
- 12.1. Market Analysis, Insights and Forecast - By Country/Sub-region
- 12.1.1 Germany
- 12.1.2 France
- 12.1.3 Italy
- 12.1.4 United Kingdom
- 12.1.5 Netherlands
- 12.1.6 Rest of Europe
- 13. Asia Pacific MCAA Market Analysis, Insights and Forecast, 2019-2031
- 13.1. Market Analysis, Insights and Forecast - By Country/Sub-region
- 13.1.1 China
- 13.1.2 Japan
- 13.1.3 India
- 13.1.4 South Korea
- 13.1.5 Taiwan
- 13.1.6 Australia
- 13.1.7 Rest of Asia-Pacific
- 14. South America MCAA Market Analysis, Insights and Forecast, 2019-2031
- 14.1. Market Analysis, Insights and Forecast - By Country/Sub-region
- 14.1.1 Brazil
- 14.1.2 Argentina
- 14.1.3 Rest of South America
- 15. MEA MCAA Market Analysis, Insights and Forecast, 2019-2031
- 15.1. Market Analysis, Insights and Forecast - By Country/Sub-region
- 15.1.1 Middle East
- 15.1.2 Africa
- 16. Competitive Analysis
- 16.1. Global Market Share Analysis 2024
- 16.2. Company Profiles
- 16.2.1 Nouryon
- 16.2.1.1. Overview
- 16.2.1.2. Products
- 16.2.1.3. SWOT Analysis
- 16.2.1.4. Recent Developments
- 16.2.1.5. Financials (Based on Availability)
- 16.2.2 Denak Co Ltd
- 16.2.2.1. Overview
- 16.2.2.2. Products
- 16.2.2.3. SWOT Analysis
- 16.2.2.4. Recent Developments
- 16.2.2.5. Financials (Based on Availability)
- 16.2.3 Merck KGaA
- 16.2.3.1. Overview
- 16.2.3.2. Products
- 16.2.3.3. SWOT Analysis
- 16.2.3.4. Recent Developments
- 16.2.3.5. Financials (Based on Availability)
- 16.2.4 Mahalaxmi Industries
- 16.2.4.1. Overview
- 16.2.4.2. Products
- 16.2.4.3. SWOT Analysis
- 16.2.4.4. Recent Developments
- 16.2.4.5. Financials (Based on Availability)
- 16.2.5 Archit Organosys
- 16.2.5.1. Overview
- 16.2.5.2. Products
- 16.2.5.3. SWOT Analysis
- 16.2.5.4. Recent Developments
- 16.2.5.5. Financials (Based on Availability)
- 16.2.6 Jiangxi Biochem Co Ltd
- 16.2.6.1. Overview
- 16.2.6.2. Products
- 16.2.6.3. SWOT Analysis
- 16.2.6.4. Recent Developments
- 16.2.6.5. Financials (Based on Availability)
- 16.2.7 Alfa Aesar Thermo Fisher Scientific
- 16.2.7.1. Overview
- 16.2.7.2. Products
- 16.2.7.3. SWOT Analysis
- 16.2.7.4. Recent Developments
- 16.2.7.5. Financials (Based on Availability)
- 16.2.8 Meridian Chem Bond Pvt Ltd
- 16.2.8.1. Overview
- 16.2.8.2. Products
- 16.2.8.3. SWOT Analysis
- 16.2.8.4. Recent Developments
- 16.2.8.5. Financials (Based on Availability)
- 16.2.9 TerraTech
- 16.2.9.1. Overview
- 16.2.9.2. Products
- 16.2.9.3. SWOT Analysis
- 16.2.9.4. Recent Developments
- 16.2.9.5. Financials (Based on Availability)
- 16.2.10 PCC Group
- 16.2.10.1. Overview
- 16.2.10.2. Products
- 16.2.10.3. SWOT Analysis
- 16.2.10.4. Recent Developments
- 16.2.10.5. Financials (Based on Availability)
- 16.2.11 Henan HDF Chemical CompanyLtd
- 16.2.11.1. Overview
- 16.2.11.2. Products
- 16.2.11.3. SWOT Analysis
- 16.2.11.4. Recent Developments
- 16.2.11.5. Financials (Based on Availability)
- 16.2.12 ITALMAR (THAILAND) CO LTD
- 16.2.12.1. Overview
- 16.2.12.2. Products
- 16.2.12.3. SWOT Analysis
- 16.2.12.4. Recent Developments
- 16.2.12.5. Financials (Based on Availability)
- 16.2.13 Shandong Minji New Material Technology Co Ltd
- 16.2.13.1. Overview
- 16.2.13.2. Products
- 16.2.13.3. SWOT Analysis
- 16.2.13.4. Recent Developments
- 16.2.13.5. Financials (Based on Availability)
- 16.2.1 Nouryon
List of Figures
- Figure 1: Global MCAA Market Revenue Breakdown (Million, %) by Region 2024 & 2032
- Figure 2: Global MCAA Market Volume Breakdown (K Tons, %) by Region 2024 & 2032
- Figure 3: North America MCAA Market Revenue (Million), by Country 2024 & 2032
- Figure 4: North America MCAA Market Volume (K Tons), by Country 2024 & 2032
- Figure 5: North America MCAA Market Revenue Share (%), by Country 2024 & 2032
- Figure 6: North America MCAA Market Volume Share (%), by Country 2024 & 2032
- Figure 7: Europe MCAA Market Revenue (Million), by Country 2024 & 2032
- Figure 8: Europe MCAA Market Volume (K Tons), by Country 2024 & 2032
- Figure 9: Europe MCAA Market Revenue Share (%), by Country 2024 & 2032
- Figure 10: Europe MCAA Market Volume Share (%), by Country 2024 & 2032
- Figure 11: Asia Pacific MCAA Market Revenue (Million), by Country 2024 & 2032
- Figure 12: Asia Pacific MCAA Market Volume (K Tons), by Country 2024 & 2032
- Figure 13: Asia Pacific MCAA Market Revenue Share (%), by Country 2024 & 2032
- Figure 14: Asia Pacific MCAA Market Volume Share (%), by Country 2024 & 2032
- Figure 15: South America MCAA Market Revenue (Million), by Country 2024 & 2032
- Figure 16: South America MCAA Market Volume (K Tons), by Country 2024 & 2032
- Figure 17: South America MCAA Market Revenue Share (%), by Country 2024 & 2032
- Figure 18: South America MCAA Market Volume Share (%), by Country 2024 & 2032
- Figure 19: MEA MCAA Market Revenue (Million), by Country 2024 & 2032
- Figure 20: MEA MCAA Market Volume (K Tons), by Country 2024 & 2032
- Figure 21: MEA MCAA Market Revenue Share (%), by Country 2024 & 2032
- Figure 22: MEA MCAA Market Volume Share (%), by Country 2024 & 2032
- Figure 23: Asia Pacific MCAA Market Revenue (Million), by Chemical Application 2024 & 2032
- Figure 24: Asia Pacific MCAA Market Volume (K Tons), by Chemical Application 2024 & 2032
- Figure 25: Asia Pacific MCAA Market Revenue Share (%), by Chemical Application 2024 & 2032
- Figure 26: Asia Pacific MCAA Market Volume Share (%), by Chemical Application 2024 & 2032
- Figure 27: Asia Pacific MCAA Market Revenue (Million), by End-user Industry 2024 & 2032
- Figure 28: Asia Pacific MCAA Market Volume (K Tons), by End-user Industry 2024 & 2032
- Figure 29: Asia Pacific MCAA Market Revenue Share (%), by End-user Industry 2024 & 2032
- Figure 30: Asia Pacific MCAA Market Volume Share (%), by End-user Industry 2024 & 2032
- Figure 31: Asia Pacific MCAA Market Revenue (Million), by Country 2024 & 2032
- Figure 32: Asia Pacific MCAA Market Volume (K Tons), by Country 2024 & 2032
- Figure 33: Asia Pacific MCAA Market Revenue Share (%), by Country 2024 & 2032
- Figure 34: Asia Pacific MCAA Market Volume Share (%), by Country 2024 & 2032
- Figure 35: North America MCAA Market Revenue (Million), by Chemical Application 2024 & 2032
- Figure 36: North America MCAA Market Volume (K Tons), by Chemical Application 2024 & 2032
- Figure 37: North America MCAA Market Revenue Share (%), by Chemical Application 2024 & 2032
- Figure 38: North America MCAA Market Volume Share (%), by Chemical Application 2024 & 2032
- Figure 39: North America MCAA Market Revenue (Million), by End-user Industry 2024 & 2032
- Figure 40: North America MCAA Market Volume (K Tons), by End-user Industry 2024 & 2032
- Figure 41: North America MCAA Market Revenue Share (%), by End-user Industry 2024 & 2032
- Figure 42: North America MCAA Market Volume Share (%), by End-user Industry 2024 & 2032
- Figure 43: North America MCAA Market Revenue (Million), by Country 2024 & 2032
- Figure 44: North America MCAA Market Volume (K Tons), by Country 2024 & 2032
- Figure 45: North America MCAA Market Revenue Share (%), by Country 2024 & 2032
- Figure 46: North America MCAA Market Volume Share (%), by Country 2024 & 2032
- Figure 47: Europe MCAA Market Revenue (Million), by Chemical Application 2024 & 2032
- Figure 48: Europe MCAA Market Volume (K Tons), by Chemical Application 2024 & 2032
- Figure 49: Europe MCAA Market Revenue Share (%), by Chemical Application 2024 & 2032
- Figure 50: Europe MCAA Market Volume Share (%), by Chemical Application 2024 & 2032
- Figure 51: Europe MCAA Market Revenue (Million), by End-user Industry 2024 & 2032
- Figure 52: Europe MCAA Market Volume (K Tons), by End-user Industry 2024 & 2032
- Figure 53: Europe MCAA Market Revenue Share (%), by End-user Industry 2024 & 2032
- Figure 54: Europe MCAA Market Volume Share (%), by End-user Industry 2024 & 2032
- Figure 55: Europe MCAA Market Revenue (Million), by Country 2024 & 2032
- Figure 56: Europe MCAA Market Volume (K Tons), by Country 2024 & 2032
- Figure 57: Europe MCAA Market Revenue Share (%), by Country 2024 & 2032
- Figure 58: Europe MCAA Market Volume Share (%), by Country 2024 & 2032
- Figure 59: South America MCAA Market Revenue (Million), by Chemical Application 2024 & 2032
- Figure 60: South America MCAA Market Volume (K Tons), by Chemical Application 2024 & 2032
- Figure 61: South America MCAA Market Revenue Share (%), by Chemical Application 2024 & 2032
- Figure 62: South America MCAA Market Volume Share (%), by Chemical Application 2024 & 2032
- Figure 63: South America MCAA Market Revenue (Million), by End-user Industry 2024 & 2032
- Figure 64: South America MCAA Market Volume (K Tons), by End-user Industry 2024 & 2032
- Figure 65: South America MCAA Market Revenue Share (%), by End-user Industry 2024 & 2032
- Figure 66: South America MCAA Market Volume Share (%), by End-user Industry 2024 & 2032
- Figure 67: South America MCAA Market Revenue (Million), by Country 2024 & 2032
- Figure 68: South America MCAA Market Volume (K Tons), by Country 2024 & 2032
- Figure 69: South America MCAA Market Revenue Share (%), by Country 2024 & 2032
- Figure 70: South America MCAA Market Volume Share (%), by Country 2024 & 2032
- Figure 71: Middle East and Africa MCAA Market Revenue (Million), by Chemical Application 2024 & 2032
- Figure 72: Middle East and Africa MCAA Market Volume (K Tons), by Chemical Application 2024 & 2032
- Figure 73: Middle East and Africa MCAA Market Revenue Share (%), by Chemical Application 2024 & 2032
- Figure 74: Middle East and Africa MCAA Market Volume Share (%), by Chemical Application 2024 & 2032
- Figure 75: Middle East and Africa MCAA Market Revenue (Million), by End-user Industry 2024 & 2032
- Figure 76: Middle East and Africa MCAA Market Volume (K Tons), by End-user Industry 2024 & 2032
- Figure 77: Middle East and Africa MCAA Market Revenue Share (%), by End-user Industry 2024 & 2032
- Figure 78: Middle East and Africa MCAA Market Volume Share (%), by End-user Industry 2024 & 2032
- Figure 79: Middle East and Africa MCAA Market Revenue (Million), by Country 2024 & 2032
- Figure 80: Middle East and Africa MCAA Market Volume (K Tons), by Country 2024 & 2032
- Figure 81: Middle East and Africa MCAA Market Revenue Share (%), by Country 2024 & 2032
- Figure 82: Middle East and Africa MCAA Market Volume Share (%), by Country 2024 & 2032
List of Tables
- Table 1: Global MCAA Market Revenue Million Forecast, by Region 2019 & 2032
- Table 2: Global MCAA Market Volume K Tons Forecast, by Region 2019 & 2032
- Table 3: Global MCAA Market Revenue Million Forecast, by Chemical Application 2019 & 2032
- Table 4: Global MCAA Market Volume K Tons Forecast, by Chemical Application 2019 & 2032
- Table 5: Global MCAA Market Revenue Million Forecast, by End-user Industry 2019 & 2032
- Table 6: Global MCAA Market Volume K Tons Forecast, by End-user Industry 2019 & 2032
- Table 7: Global MCAA Market Revenue Million Forecast, by Region 2019 & 2032
- Table 8: Global MCAA Market Volume K Tons Forecast, by Region 2019 & 2032
- Table 9: Global MCAA Market Revenue Million Forecast, by Country 2019 & 2032
- Table 10: Global MCAA Market Volume K Tons Forecast, by Country 2019 & 2032
- Table 11: United States MCAA Market Revenue (Million) Forecast, by Application 2019 & 2032
- Table 12: United States MCAA Market Volume (K Tons) Forecast, by Application 2019 & 2032
- Table 13: Canada MCAA Market Revenue (Million) Forecast, by Application 2019 & 2032
- Table 14: Canada MCAA Market Volume (K Tons) Forecast, by Application 2019 & 2032
- Table 15: Mexico MCAA Market Revenue (Million) Forecast, by Application 2019 & 2032
- Table 16: Mexico MCAA Market Volume (K Tons) Forecast, by Application 2019 & 2032
- Table 17: Global MCAA Market Revenue Million Forecast, by Country 2019 & 2032
- Table 18: Global MCAA Market Volume K Tons Forecast, by Country 2019 & 2032
- Table 19: Germany MCAA Market Revenue (Million) Forecast, by Application 2019 & 2032
- Table 20: Germany MCAA Market Volume (K Tons) Forecast, by Application 2019 & 2032
- Table 21: France MCAA Market Revenue (Million) Forecast, by Application 2019 & 2032
- Table 22: France MCAA Market Volume (K Tons) Forecast, by Application 2019 & 2032
- Table 23: Italy MCAA Market Revenue (Million) Forecast, by Application 2019 & 2032
- Table 24: Italy MCAA Market Volume (K Tons) Forecast, by Application 2019 & 2032
- Table 25: United Kingdom MCAA Market Revenue (Million) Forecast, by Application 2019 & 2032
- Table 26: United Kingdom MCAA Market Volume (K Tons) Forecast, by Application 2019 & 2032
- Table 27: Netherlands MCAA Market Revenue (Million) Forecast, by Application 2019 & 2032
- Table 28: Netherlands MCAA Market Volume (K Tons) Forecast, by Application 2019 & 2032
- Table 29: Rest of Europe MCAA Market Revenue (Million) Forecast, by Application 2019 & 2032
- Table 30: Rest of Europe MCAA Market Volume (K Tons) Forecast, by Application 2019 & 2032
- Table 31: Global MCAA Market Revenue Million Forecast, by Country 2019 & 2032
- Table 32: Global MCAA Market Volume K Tons Forecast, by Country 2019 & 2032
- Table 33: China MCAA Market Revenue (Million) Forecast, by Application 2019 & 2032
- Table 34: China MCAA Market Volume (K Tons) Forecast, by Application 2019 & 2032
- Table 35: Japan MCAA Market Revenue (Million) Forecast, by Application 2019 & 2032
- Table 36: Japan MCAA Market Volume (K Tons) Forecast, by Application 2019 & 2032
- Table 37: India MCAA Market Revenue (Million) Forecast, by Application 2019 & 2032
- Table 38: India MCAA Market Volume (K Tons) Forecast, by Application 2019 & 2032
- Table 39: South Korea MCAA Market Revenue (Million) Forecast, by Application 2019 & 2032
- Table 40: South Korea MCAA Market Volume (K Tons) Forecast, by Application 2019 & 2032
- Table 41: Taiwan MCAA Market Revenue (Million) Forecast, by Application 2019 & 2032
- Table 42: Taiwan MCAA Market Volume (K Tons) Forecast, by Application 2019 & 2032
- Table 43: Australia MCAA Market Revenue (Million) Forecast, by Application 2019 & 2032
- Table 44: Australia MCAA Market Volume (K Tons) Forecast, by Application 2019 & 2032
- Table 45: Rest of Asia-Pacific MCAA Market Revenue (Million) Forecast, by Application 2019 & 2032
- Table 46: Rest of Asia-Pacific MCAA Market Volume (K Tons) Forecast, by Application 2019 & 2032
- Table 47: Global MCAA Market Revenue Million Forecast, by Country 2019 & 2032
- Table 48: Global MCAA Market Volume K Tons Forecast, by Country 2019 & 2032
- Table 49: Brazil MCAA Market Revenue (Million) Forecast, by Application 2019 & 2032
- Table 50: Brazil MCAA Market Volume (K Tons) Forecast, by Application 2019 & 2032
- Table 51: Argentina MCAA Market Revenue (Million) Forecast, by Application 2019 & 2032
- Table 52: Argentina MCAA Market Volume (K Tons) Forecast, by Application 2019 & 2032
- Table 53: Rest of South America MCAA Market Revenue (Million) Forecast, by Application 2019 & 2032
- Table 54: Rest of South America MCAA Market Volume (K Tons) Forecast, by Application 2019 & 2032
- Table 55: Global MCAA Market Revenue Million Forecast, by Country 2019 & 2032
- Table 56: Global MCAA Market Volume K Tons Forecast, by Country 2019 & 2032
- Table 57: Middle East MCAA Market Revenue (Million) Forecast, by Application 2019 & 2032
- Table 58: Middle East MCAA Market Volume (K Tons) Forecast, by Application 2019 & 2032
- Table 59: Africa MCAA Market Revenue (Million) Forecast, by Application 2019 & 2032
- Table 60: Africa MCAA Market Volume (K Tons) Forecast, by Application 2019 & 2032
- Table 61: Global MCAA Market Revenue Million Forecast, by Chemical Application 2019 & 2032
- Table 62: Global MCAA Market Volume K Tons Forecast, by Chemical Application 2019 & 2032
- Table 63: Global MCAA Market Revenue Million Forecast, by End-user Industry 2019 & 2032
- Table 64: Global MCAA Market Volume K Tons Forecast, by End-user Industry 2019 & 2032
- Table 65: Global MCAA Market Revenue Million Forecast, by Country 2019 & 2032
- Table 66: Global MCAA Market Volume K Tons Forecast, by Country 2019 & 2032
- Table 67: China MCAA Market Revenue (Million) Forecast, by Application 2019 & 2032
- Table 68: China MCAA Market Volume (K Tons) Forecast, by Application 2019 & 2032
- Table 69: India MCAA Market Revenue (Million) Forecast, by Application 2019 & 2032
- Table 70: India MCAA Market Volume (K Tons) Forecast, by Application 2019 & 2032
- Table 71: Japan MCAA Market Revenue (Million) Forecast, by Application 2019 & 2032
- Table 72: Japan MCAA Market Volume (K Tons) Forecast, by Application 2019 & 2032
- Table 73: South Korea MCAA Market Revenue (Million) Forecast, by Application 2019 & 2032
- Table 74: South Korea MCAA Market Volume (K Tons) Forecast, by Application 2019 & 2032
- Table 75: Malaysia MCAA Market Revenue (Million) Forecast, by Application 2019 & 2032
- Table 76: Malaysia MCAA Market Volume (K Tons) Forecast, by Application 2019 & 2032
- Table 77: Thailand MCAA Market Revenue (Million) Forecast, by Application 2019 & 2032
- Table 78: Thailand MCAA Market Volume (K Tons) Forecast, by Application 2019 & 2032
- Table 79: Indonesia MCAA Market Revenue (Million) Forecast, by Application 2019 & 2032
- Table 80: Indonesia MCAA Market Volume (K Tons) Forecast, by Application 2019 & 2032
- Table 81: Vietnam MCAA Market Revenue (Million) Forecast, by Application 2019 & 2032
- Table 82: Vietnam MCAA Market Volume (K Tons) Forecast, by Application 2019 & 2032
- Table 83: Rest of Asia Pacific MCAA Market Revenue (Million) Forecast, by Application 2019 & 2032
- Table 84: Rest of Asia Pacific MCAA Market Volume (K Tons) Forecast, by Application 2019 & 2032
- Table 85: Global MCAA Market Revenue Million Forecast, by Chemical Application 2019 & 2032
- Table 86: Global MCAA Market Volume K Tons Forecast, by Chemical Application 2019 & 2032
- Table 87: Global MCAA Market Revenue Million Forecast, by End-user Industry 2019 & 2032
- Table 88: Global MCAA Market Volume K Tons Forecast, by End-user Industry 2019 & 2032
- Table 89: Global MCAA Market Revenue Million Forecast, by Country 2019 & 2032
- Table 90: Global MCAA Market Volume K Tons Forecast, by Country 2019 & 2032
- Table 91: United States MCAA Market Revenue (Million) Forecast, by Application 2019 & 2032
- Table 92: United States MCAA Market Volume (K Tons) Forecast, by Application 2019 & 2032
- Table 93: Canada MCAA Market Revenue (Million) Forecast, by Application 2019 & 2032
- Table 94: Canada MCAA Market Volume (K Tons) Forecast, by Application 2019 & 2032
- Table 95: Mexico MCAA Market Revenue (Million) Forecast, by Application 2019 & 2032
- Table 96: Mexico MCAA Market Volume (K Tons) Forecast, by Application 2019 & 2032
- Table 97: Global MCAA Market Revenue Million Forecast, by Chemical Application 2019 & 2032
- Table 98: Global MCAA Market Volume K Tons Forecast, by Chemical Application 2019 & 2032
- Table 99: Global MCAA Market Revenue Million Forecast, by End-user Industry 2019 & 2032
- Table 100: Global MCAA Market Volume K Tons Forecast, by End-user Industry 2019 & 2032
- Table 101: Global MCAA Market Revenue Million Forecast, by Country 2019 & 2032
- Table 102: Global MCAA Market Volume K Tons Forecast, by Country 2019 & 2032
- Table 103: Germany MCAA Market Revenue (Million) Forecast, by Application 2019 & 2032
- Table 104: Germany MCAA Market Volume (K Tons) Forecast, by Application 2019 & 2032
- Table 105: United Kingdom MCAA Market Revenue (Million) Forecast, by Application 2019 & 2032
- Table 106: United Kingdom MCAA Market Volume (K Tons) Forecast, by Application 2019 & 2032
- Table 107: Italy MCAA Market Revenue (Million) Forecast, by Application 2019 & 2032
- Table 108: Italy MCAA Market Volume (K Tons) Forecast, by Application 2019 & 2032
- Table 109: France MCAA Market Revenue (Million) Forecast, by Application 2019 & 2032
- Table 110: France MCAA Market Volume (K Tons) Forecast, by Application 2019 & 2032
- Table 111: Spain MCAA Market Revenue (Million) Forecast, by Application 2019 & 2032
- Table 112: Spain MCAA Market Volume (K Tons) Forecast, by Application 2019 & 2032
- Table 113: Nordic Countries MCAA Market Revenue (Million) Forecast, by Application 2019 & 2032
- Table 114: Nordic Countries MCAA Market Volume (K Tons) Forecast, by Application 2019 & 2032
- Table 115: Turkey MCAA Market Revenue (Million) Forecast, by Application 2019 & 2032
- Table 116: Turkey MCAA Market Volume (K Tons) Forecast, by Application 2019 & 2032
- Table 117: Russia MCAA Market Revenue (Million) Forecast, by Application 2019 & 2032
- Table 118: Russia MCAA Market Volume (K Tons) Forecast, by Application 2019 & 2032
- Table 119: Rest of Europe MCAA Market Revenue (Million) Forecast, by Application 2019 & 2032
- Table 120: Rest of Europe MCAA Market Volume (K Tons) Forecast, by Application 2019 & 2032
- Table 121: Global MCAA Market Revenue Million Forecast, by Chemical Application 2019 & 2032
- Table 122: Global MCAA Market Volume K Tons Forecast, by Chemical Application 2019 & 2032
- Table 123: Global MCAA Market Revenue Million Forecast, by End-user Industry 2019 & 2032
- Table 124: Global MCAA Market Volume K Tons Forecast, by End-user Industry 2019 & 2032
- Table 125: Global MCAA Market Revenue Million Forecast, by Country 2019 & 2032
- Table 126: Global MCAA Market Volume K Tons Forecast, by Country 2019 & 2032
- Table 127: Brazil MCAA Market Revenue (Million) Forecast, by Application 2019 & 2032
- Table 128: Brazil MCAA Market Volume (K Tons) Forecast, by Application 2019 & 2032
- Table 129: Argentina MCAA Market Revenue (Million) Forecast, by Application 2019 & 2032
- Table 130: Argentina MCAA Market Volume (K Tons) Forecast, by Application 2019 & 2032
- Table 131: Colombia MCAA Market Revenue (Million) Forecast, by Application 2019 & 2032
- Table 132: Colombia MCAA Market Volume (K Tons) Forecast, by Application 2019 & 2032
- Table 133: Rest of South America MCAA Market Revenue (Million) Forecast, by Application 2019 & 2032
- Table 134: Rest of South America MCAA Market Volume (K Tons) Forecast, by Application 2019 & 2032
- Table 135: Global MCAA Market Revenue Million Forecast, by Chemical Application 2019 & 2032
- Table 136: Global MCAA Market Volume K Tons Forecast, by Chemical Application 2019 & 2032
- Table 137: Global MCAA Market Revenue Million Forecast, by End-user Industry 2019 & 2032
- Table 138: Global MCAA Market Volume K Tons Forecast, by End-user Industry 2019 & 2032
- Table 139: Global MCAA Market Revenue Million Forecast, by Country 2019 & 2032
- Table 140: Global MCAA Market Volume K Tons Forecast, by Country 2019 & 2032
- Table 141: Saudi Arabia MCAA Market Revenue (Million) Forecast, by Application 2019 & 2032
- Table 142: Saudi Arabia MCAA Market Volume (K Tons) Forecast, by Application 2019 & 2032
- Table 143: Qatar MCAA Market Revenue (Million) Forecast, by Application 2019 & 2032
- Table 144: Qatar MCAA Market Volume (K Tons) Forecast, by Application 2019 & 2032
- Table 145: United Arab Emirates MCAA Market Revenue (Million) Forecast, by Application 2019 & 2032
- Table 146: United Arab Emirates MCAA Market Volume (K Tons) Forecast, by Application 2019 & 2032
- Table 147: Nigeria MCAA Market Revenue (Million) Forecast, by Application 2019 & 2032
- Table 148: Nigeria MCAA Market Volume (K Tons) Forecast, by Application 2019 & 2032
- Table 149: Egypt MCAA Market Revenue (Million) Forecast, by Application 2019 & 2032
- Table 150: Egypt MCAA Market Volume (K Tons) Forecast, by Application 2019 & 2032
- Table 151: South Africa MCAA Market Revenue (Million) Forecast, by Application 2019 & 2032
- Table 152: South Africa MCAA Market Volume (K Tons) Forecast, by Application 2019 & 2032
- Table 153: Rest of Middle East and Africa MCAA Market Revenue (Million) Forecast, by Application 2019 & 2032
- Table 154: Rest of Middle East and Africa MCAA Market Volume (K Tons) Forecast, by Application 2019 & 2032
Frequently Asked Questions
1. What is the projected Compound Annual Growth Rate (CAGR) of the MCAA Market?
The projected CAGR is approximately 3.6%.
2. Which companies are prominent players in the MCAA Market?
Key companies in the market include Nouryon, Denak Co Ltd, Merck KGaA, Mahalaxmi Industries, Archit Organosys, Jiangxi Biochem Co Ltd, Alfa Aesar Thermo Fisher Scientific, Meridian Chem Bond Pvt Ltd, TerraTech, PCC Group, Henan HDF Chemical CompanyLtd, ITALMAR (THAILAND) CO LTD, Shandong Minji New Material Technology Co Ltd.
3. What are the main segments of the MCAA Market?
The market segments include Chemical Application, End-user Industry.
4. Can you provide details about the market size?
The market size is estimated to be USD 990.11 Million as of 2022.
5. What are some drivers contributing to market growth?
Growing consumption from the pharmaceutical Industry; Growing production of agrochemical in the country.
6. What are the notable trends driving market growth?
Increasing Demand from Personal Care and Pharmaceuticals Industries.
7. Are there any restraints impacting market growth?
Decline in detergent consumption.
8. Can you provide examples of recent developments in the market?
September 2021: The Board of Directors of Archit Organosys approved the proposal to increase the production capacity by 12,000 tpa at the existing Bhavnagar plant in Gujarat. The project will entail an investment of Rs five crore which will be financed through internal accruals. There is an increase in demand for Monochloro Acetic Acid (MCA) both at the domestic and export level, as witnessed by the company.
9. What pricing options are available for accessing the report?
Pricing options include single-user, multi-user, and enterprise licenses priced at USD 4750, USD 5250, and USD 8750 respectively.
10. Is the market size provided in terms of value or volume?
The market size is provided in terms of value, measured in Million and volume, measured in K Tons.
11. Are there any specific market keywords associated with the report?
Yes, the market keyword associated with the report is "MCAA Market," which aids in identifying and referencing the specific market segment covered.
12. How do I determine which pricing option suits my needs best?
The pricing options vary based on user requirements and access needs. Individual users may opt for single-user licenses, while businesses requiring broader access may choose multi-user or enterprise licenses for cost-effective access to the report.
13. Are there any additional resources or data provided in the MCAA Market report?
While the report offers comprehensive insights, it's advisable to review the specific contents or supplementary materials provided to ascertain if additional resources or data are available.
14. How can I stay updated on further developments or reports in the MCAA Market?
To stay informed about further developments, trends, and reports in the MCAA Market, consider subscribing to industry newsletters, following relevant companies and organizations, or regularly checking reputable industry news sources and publications.
Methodology
Step 1 - Identification of Relevant Samples Size from Population Database


Step 2 - Approaches for Defining Global Market Size (Value, Volume* & Price*)

Note*: In applicable scenarios
Step 3 - Data Sources
Primary Research
- Web Analytics
- Survey Reports
- Research Institute
- Latest Research Reports
- Opinion Leaders
Secondary Research
- Annual Reports
- White Paper
- Latest Press Release
- Industry Association
- Paid Database
- Investor Presentations

Step 4 - Data Triangulation
Involves using different sources of information in order to increase the validity of a study
These sources are likely to be stakeholders in a program - participants, other researchers, program staff, other community members, and so on.
Then we put all data in single framework & apply various statistical tools to find out the dynamic on the market.
During the analysis stage, feedback from the stakeholder groups would be compared to determine areas of agreement as well as areas of divergence


