

Key Insights
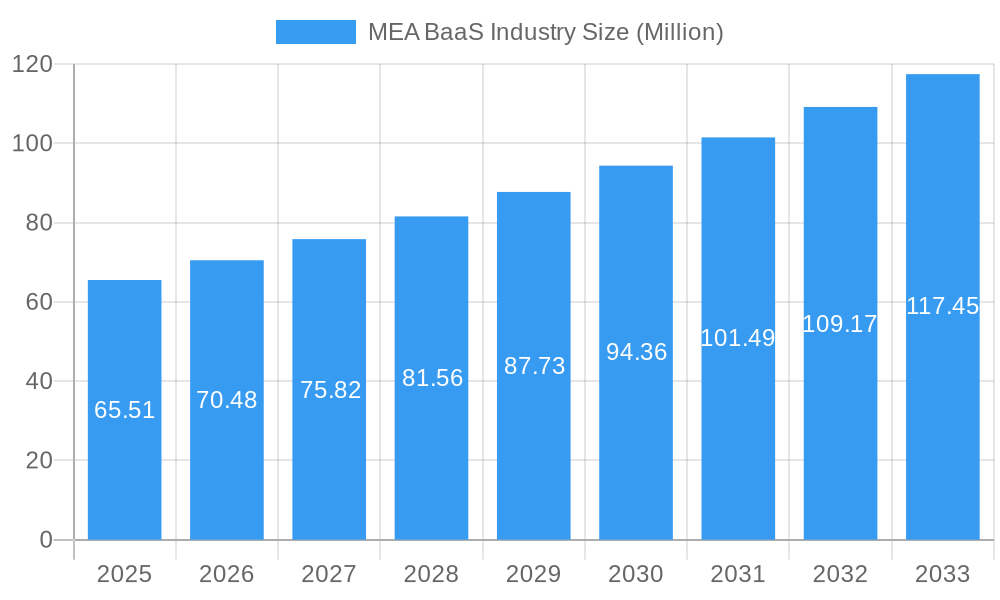
The Middle East and Africa (MEA) Banking-as-a-Service (BaaS) market is experiencing robust growth, projected to reach $65.51 million in 2025 and maintain a Compound Annual Growth Rate (CAGR) of 7.40% from 2025 to 2033. This expansion is driven by several key factors. The increasing adoption of digital financial services across the region, fueled by rising smartphone penetration and internet access, is a primary catalyst. Furthermore, the demand for streamlined and cost-effective banking solutions from fintech startups and traditional financial institutions is significantly contributing to BaaS market growth. Regulations supporting innovation in the financial technology sector are also playing a crucial role, fostering a more conducive environment for BaaS providers. The competitive landscape includes both established players like Al Baraka Bank and newer entrants like Sarwa Co and NOW Money, reflecting a dynamic and evolving market. The diverse range of services offered, encompassing payment processing, lending, and account management, contributes to the broad appeal and market expansion of BaaS solutions within the MEA region.
MEA BaaS Industry Market Size (In Million)
Looking ahead, the continued growth of the MEA BaaS market is expected to be influenced by several trends. Increased investments in fintech infrastructure, coupled with the ongoing development of robust regulatory frameworks, will likely further stimulate market expansion. The integration of advanced technologies, such as artificial intelligence (AI) and blockchain, into BaaS offerings will likely enhance efficiency and security, thus attracting a wider customer base. Challenges remain, however, including data security concerns and the need to address the digital literacy gap in certain segments of the population. Nevertheless, the overall outlook for the MEA BaaS market remains positive, with significant opportunities for growth and innovation throughout the forecast period. The market’s trajectory suggests a substantial increase in market value by 2033, driven by consistent adoption and technological advancements.
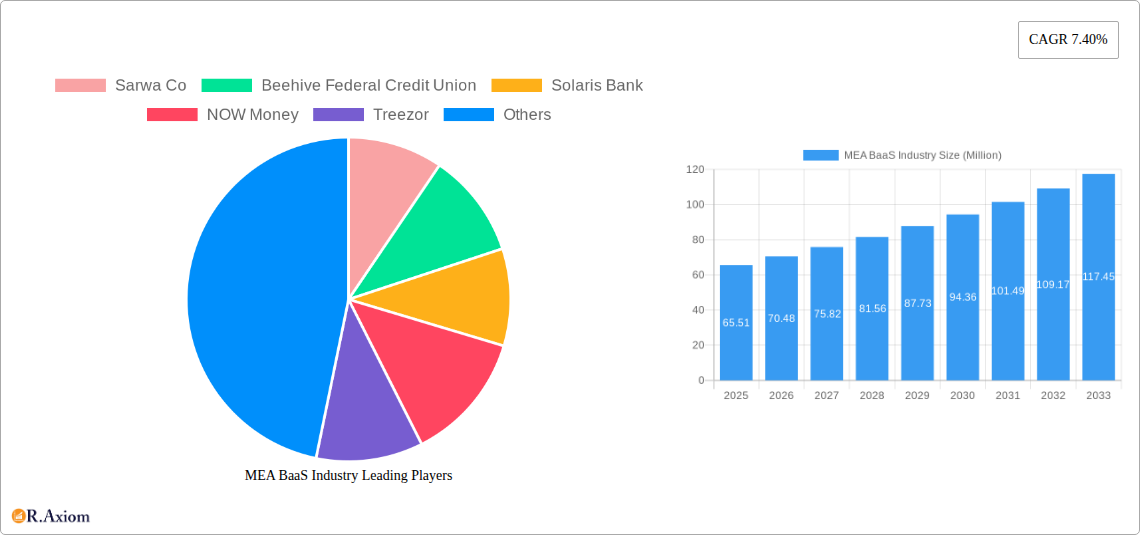
MEA BaaS Industry Company Market Share
This in-depth report provides a comprehensive analysis of the Middle East and Africa (MEA) Banking-as-a-Service (BaaS) industry, covering market size, growth drivers, key players, and future trends. The study period spans from 2019 to 2033, with 2025 serving as the base and estimated year. The report offers actionable insights for industry stakeholders, investors, and businesses seeking to capitalize on the burgeoning MEA BaaS market. The total market value in 2025 is estimated at $XX Million.
MEA BaaS Industry Market Concentration & Innovation
The MEA BaaS market presents a dynamic competitive landscape driven by a confluence of technological innovation, evolving consumer demands, and a progressively supportive regulatory environment. This sector is characterized by a healthy mix of established financial institutions and agile fintech disruptors, contributing to a moderately fragmented market structure. While specific market share data for individual entities is still coalescing, our projections indicate that the leading five players will collectively command an estimated XX% of the market share by 2025, underscoring a growing concentration among key innovators.
- Market Concentration: The market exhibits a moderately fragmented nature, featuring a core group of leading players alongside a vibrant ecosystem of specialized niche providers.
- Innovation Drivers: Key accelerators include the widespread adoption of advanced technologies such as open banking APIs and cloud computing, a burgeoning demand for accessible digital financial services, and proactive government initiatives aimed at fostering financial inclusion and digital transformation.
- Regulatory Frameworks: The regulatory landscape across the MEA region is diverse, significantly impacting market entry strategies and operational frameworks. Achieving greater regulatory clarity and harmonization is paramount for unlocking the full growth potential of the BaaS market.
- Product Substitutes: While traditional banking models continue to offer some competition, they are increasingly challenged by the inherent agility, scalability, and cost-effectiveness offered by BaaS solutions.
- End-User Trends: A pronounced shift towards digital banking experiences and a growing appetite for seamlessly integrated financial services within non-financial platforms are defining end-user preferences.
- M&A Activities: The MEA BaaS sector has been a hotbed for strategic mergers and acquisitions in recent years, with deal values ranging from $XX Million to $XX Million. These transactions highlight a strong trend towards industry consolidation and the pursuit of synergistic advantages.
MEA BaaS Industry Industry Trends & Insights
The MEA BaaS industry is poised for significant expansion, propelled by escalating smartphone penetration, widespread internet access, and a demographic profile marked by its youth and digital fluency. Projections indicate a robust Compound Annual Growth Rate (CAGR) of XX% for the forecast period spanning 2025 to 2033, with market penetration anticipated to reach an impressive XX% by 2033.
Several converging factors are fueling this optimistic trajectory:
- Market Growth Drivers: The demand for hyper-personalized financial services, the accelerated pace of digital transformation within the financial sector, and the widespread adoption of embedded finance solutions are pivotal contributors to sustained market growth.
- Technological Disruptions: The integration of cutting-edge technologies such as Artificial Intelligence (AI), Machine Learning (ML), and Blockchain is creating novel avenues for enhancing operational efficiency, bolstering security, and driving innovation across the BaaS ecosystem.
- Consumer Preferences: Modern consumers increasingly prioritize financial experiences that are not only convenient and personalized but also digital-first, thereby creating substantial demand for sophisticated BaaS solutions.
- Competitive Dynamics: The market is experiencing intensified competition as new entrants emerge and established players focus on differentiation through continuous innovation and strategic partnerships.
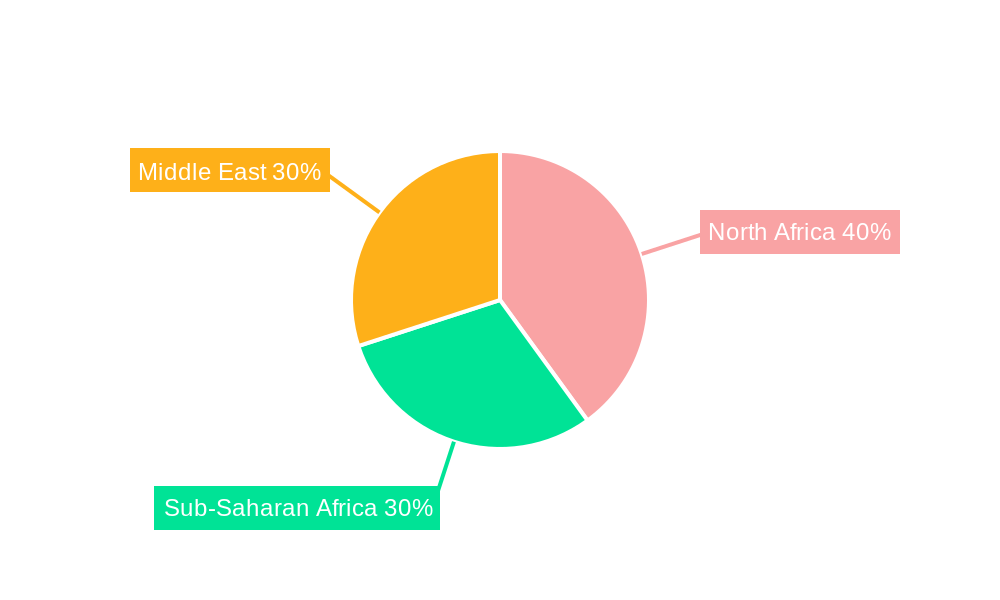
Dominant Markets & Segments in MEA BaaS Industry
The United Arab Emirates (UAE) and Saudi Arabia currently stand as the preeminent markets within the MEA BaaS industry, largely attributed to their advanced digital infrastructures and progressive regulatory frameworks that champion fintech innovation. Neighboring economies, particularly within North Africa, are rapidly advancing their digital adoption rates and are emerging as significant growth territories.
- Key Drivers for UAE and Saudi Arabia:
- Supportive Government Policies: Active promotion of digital financial services and the creation of an enabling environment for fintech ventures.
- Developed Infrastructure: High levels of internet and mobile penetration, laying a strong foundation for digital service delivery.
- Strong Economic Growth: A conducive economic climate that fosters investment in cutting-edge financial technologies and digital solutions.
- Focus on Financial Inclusion: Dedicated efforts by governments to extend financial services to unbanked and underbanked populations, a key driver for BaaS adoption.
The most significant market segments are those catering to Small and Medium-sized Enterprises (SMEs), large corporations, and the rapidly expanding neobank sector.
MEA BaaS Industry Product Developments
Recent product innovations in the MEA BaaS space involve advanced APIs, enhanced security features, and the incorporation of AI-powered personalization capabilities. The key focus is on creating seamless integration with existing systems and providing flexible, scalable solutions that cater to diverse client needs. Competitive advantages are gained through superior technology, robust security measures, and exceptional customer support.
Report Scope & Segmentation Analysis
This report segments the MEA BaaS market based on various factors:
- By Service Type: Account services, payment services, lending services, and other value-added services. Each segment exhibits varying growth trajectories and competitive intensities. For instance, payment services are currently the largest segment.
- By Deployment Mode: Cloud-based and on-premise deployments, with cloud-based solutions witnessing faster adoption.
- By Enterprise Size: SMEs, large corporations, and financial institutions all have unique needs and preferences influencing market demand.
- By Geography: The report analyzes market dynamics in various MEA countries, highlighting regional variations in growth rates and competitive landscapes.
Key Drivers of MEA BaaS Industry Growth
Several factors are driving the growth of the MEA BaaS industry:
- Technological Advancements: Open banking APIs and cloud technology enable faster innovation and scalability.
- Economic Growth: The rising middle class and increased disposable income fuel demand for digital financial services.
- Government Support: Initiatives promoting fintech and digital inclusion provide a favorable regulatory environment.
- Demand for Digital Financial Services: A growing preference for convenient and accessible financial solutions drives adoption of BaaS.
Challenges in the MEA BaaS Industry Sector
Despite its promising growth, the MEA BaaS sector faces several critical challenges:
- Regulatory Hurdles: The fragmented nature of regulations across different MEA countries can introduce complexities and impediments to seamless market entry and cross-border expansion.
- Cybersecurity Concerns: The paramount importance of robust data security and the continuous need to defend against evolving cyber threats are ongoing challenges for all participants.
- Competition: The highly competitive landscape, marked by the presence of both established financial giants and agile fintech startups, necessitates relentless innovation and a clear strategy for differentiation.
- Infrastructure Gaps: Disparities in internet connectivity and mobile penetration across the region can create accessibility barriers in certain geographies, resulting in an estimated $XX Million in annual untapped market potential.
Emerging Opportunities in MEA BaaS Industry
Opportunities abound in the MEA BaaS market:
- Expansion into Underserved Markets: Reaching unbanked and underbanked populations offers significant growth potential.
- Integration with Emerging Technologies: Leveraging AI, blockchain, and other cutting-edge technologies can create innovative BaaS solutions.
- Development of Specialized Solutions: Tailoring BaaS offerings to specific industry verticals (e.g., healthcare, e-commerce) creates niche market opportunities.
- Partnerships and Collaborations: Strategic alliances can accelerate market penetration and expand product offerings.
Key Developments in MEA BaaS Industry Industry
- March 2022: Aazzur strategically partnered with Treezor, significantly expanding its BaaS capabilities and customer reach.
- September 2022: Wio Bank launched its innovative platform bank in the UAE, a move that is expected to accelerate embedded finance adoption and the growth of the BaaS ecosystem in the region.
Strategic Outlook for MEA BaaS Industry Market
The MEA BaaS market is poised for significant growth in the coming years, driven by favorable demographics, technological advancements, and supportive regulatory frameworks. The focus will be on innovation, strategic partnerships, and addressing the unique needs of diverse market segments. By 2033, the market is expected to reach a value of $XX Million.
MEA BaaS Industry Segmentation
-
1. Type
- 1.1. API-based BaaS
- 1.2. Cloud based baaS
-
2. Service Type
- 2.1. Payment Process Services
- 2.2. Digital Banking Services
- 2.3. KYC Services
- 2.4. Customer Support Services
- 2.5. Others
-
3. Enterprises Size
- 3.1. Large Enterprises
- 3.2. Small & Medium Enterprises
MEA BaaS Industry Segmentation By Geography
-
1. North America
- 1.1. United States
- 1.2. Canada
- 1.3. Mexico
-
2. South America
- 2.1. Brazil
- 2.2. Argentina
- 2.3. Rest of South America
-
3. Europe
- 3.1. United Kingdom
- 3.2. Germany
- 3.3. France
- 3.4. Italy
- 3.5. Spain
- 3.6. Russia
- 3.7. Benelux
- 3.8. Nordics
- 3.9. Rest of Europe
-
4. Middle East & Africa
- 4.1. Turkey
- 4.2. Israel
- 4.3. GCC
- 4.4. North Africa
- 4.5. South Africa
- 4.6. Rest of Middle East & Africa
-
5. Asia Pacific
- 5.1. China
- 5.2. India
- 5.3. Japan
- 5.4. South Korea
- 5.5. ASEAN
- 5.6. Oceania
- 5.7. Rest of Asia Pacific
MEA BaaS Industry Regional Market Share
Geographic Coverage of MEA BaaS Industry
MEA BaaS Industry REPORT HIGHLIGHTS
| Aspects | Details |
|---|---|
| Study Period | 2020-2034 |
| Base Year | 2025 |
| Estimated Year | 2026 |
| Forecast Period | 2026-2034 |
| Historical Period | 2020-2025 |
| Growth Rate | CAGR of 7.40% from 2020-2034 |
| Segmentation |
|
Table of Contents
- 1. Introduction
- 1.1. Research Scope
- 1.2. Market Segmentation
- 1.3. Research Objective
- 1.4. Definitions and Assumptions
- 2. Executive Summary
- 2.1. Market Snapshot
- 3. Market Dynamics
- 3.1. Market Drivers
- 3.2. Market Restrains
- 3.3. Market Trends
- 3.4. Market Opportunities
- 4. Market Factor Analysis
- 4.1. Porters Five Forces
- 4.1.1. Bargaining Power of Suppliers
- 4.1.2. Bargaining Power of Buyers
- 4.1.3. Threat of New Entrants
- 4.1.4. Threat of Substitutes
- 4.1.5. Competitive Rivalry
- 4.2. PESTEL analysis
- 4.3. BCG Analysis
- 4.3.1. Stars (High Growth, High Market Share)
- 4.3.2. Cash Cows (Low Growth, High Market Share)
- 4.3.3. Question Mark (High Growth, Low Market Share)
- 4.3.4. Dogs (Low Growth, Low Market Share)
- 4.4. Ansoff Matrix Analysis
- 4.5. Supply Chain Analysis
- 4.6. Regulatory Landscape
- 4.7. Current Market Potential and Opportunity Assessment (TAM–SAM–SOM Framework)
- 4.8. RAX Analyst Note
- 4.1. Porters Five Forces
- 5. Market Analysis, Insights and Forecast 2021-2033
- 5.1. Market Analysis, Insights and Forecast - by Type
- 5.1.1. API-based BaaS
- 5.1.2. Cloud based baaS
- 5.2. Market Analysis, Insights and Forecast - by Service Type
- 5.2.1. Payment Process Services
- 5.2.2. Digital Banking Services
- 5.2.3. KYC Services
- 5.2.4. Customer Support Services
- 5.2.5. Others
- 5.3. Market Analysis, Insights and Forecast - by Enterprises Size
- 5.3.1. Large Enterprises
- 5.3.2. Small & Medium Enterprises
- 5.4. Market Analysis, Insights and Forecast - by Region
- 5.4.1. North America
- 5.4.2. South America
- 5.4.3. Europe
- 5.4.4. Middle East & Africa
- 5.4.5. Asia Pacific
- 5.1. Market Analysis, Insights and Forecast - by Type
- 6. Global MEA BaaS Industry Analysis, Insights and Forecast, 2021-2033
- 6.1. Market Analysis, Insights and Forecast - by Type
- 6.1.1. API-based BaaS
- 6.1.2. Cloud based baaS
- 6.2. Market Analysis, Insights and Forecast - by Service Type
- 6.2.1. Payment Process Services
- 6.2.2. Digital Banking Services
- 6.2.3. KYC Services
- 6.2.4. Customer Support Services
- 6.2.5. Others
- 6.3. Market Analysis, Insights and Forecast - by Enterprises Size
- 6.3.1. Large Enterprises
- 6.3.2. Small & Medium Enterprises
- 6.1. Market Analysis, Insights and Forecast - by Type
- 7. North America MEA BaaS Industry Analysis, Insights and Forecast, 2020-2032
- 7.1. Market Analysis, Insights and Forecast - by Type
- 7.1.1. API-based BaaS
- 7.1.2. Cloud based baaS
- 7.2. Market Analysis, Insights and Forecast - by Service Type
- 7.2.1. Payment Process Services
- 7.2.2. Digital Banking Services
- 7.2.3. KYC Services
- 7.2.4. Customer Support Services
- 7.2.5. Others
- 7.3. Market Analysis, Insights and Forecast - by Enterprises Size
- 7.3.1. Large Enterprises
- 7.3.2. Small & Medium Enterprises
- 7.1. Market Analysis, Insights and Forecast - by Type
- 8. South America MEA BaaS Industry Analysis, Insights and Forecast, 2020-2032
- 8.1. Market Analysis, Insights and Forecast - by Type
- 8.1.1. API-based BaaS
- 8.1.2. Cloud based baaS
- 8.2. Market Analysis, Insights and Forecast - by Service Type
- 8.2.1. Payment Process Services
- 8.2.2. Digital Banking Services
- 8.2.3. KYC Services
- 8.2.4. Customer Support Services
- 8.2.5. Others
- 8.3. Market Analysis, Insights and Forecast - by Enterprises Size
- 8.3.1. Large Enterprises
- 8.3.2. Small & Medium Enterprises
- 8.1. Market Analysis, Insights and Forecast - by Type
- 9. Europe MEA BaaS Industry Analysis, Insights and Forecast, 2020-2032
- 9.1. Market Analysis, Insights and Forecast - by Type
- 9.1.1. API-based BaaS
- 9.1.2. Cloud based baaS
- 9.2. Market Analysis, Insights and Forecast - by Service Type
- 9.2.1. Payment Process Services
- 9.2.2. Digital Banking Services
- 9.2.3. KYC Services
- 9.2.4. Customer Support Services
- 9.2.5. Others
- 9.3. Market Analysis, Insights and Forecast - by Enterprises Size
- 9.3.1. Large Enterprises
- 9.3.2. Small & Medium Enterprises
- 9.1. Market Analysis, Insights and Forecast - by Type
- 10. Middle East & Africa MEA BaaS Industry Analysis, Insights and Forecast, 2020-2032
- 10.1. Market Analysis, Insights and Forecast - by Type
- 10.1.1. API-based BaaS
- 10.1.2. Cloud based baaS
- 10.2. Market Analysis, Insights and Forecast - by Service Type
- 10.2.1. Payment Process Services
- 10.2.2. Digital Banking Services
- 10.2.3. KYC Services
- 10.2.4. Customer Support Services
- 10.2.5. Others
- 10.3. Market Analysis, Insights and Forecast - by Enterprises Size
- 10.3.1. Large Enterprises
- 10.3.2. Small & Medium Enterprises
- 10.1. Market Analysis, Insights and Forecast - by Type
- 11. Asia Pacific MEA BaaS Industry Analysis, Insights and Forecast, 2020-2032
- 11.1. Market Analysis, Insights and Forecast - by Type
- 11.1.1. API-based BaaS
- 11.1.2. Cloud based baaS
- 11.2. Market Analysis, Insights and Forecast - by Service Type
- 11.2.1. Payment Process Services
- 11.2.2. Digital Banking Services
- 11.2.3. KYC Services
- 11.2.4. Customer Support Services
- 11.2.5. Others
- 11.3. Market Analysis, Insights and Forecast - by Enterprises Size
- 11.3.1. Large Enterprises
- 11.3.2. Small & Medium Enterprises
- 11.1. Market Analysis, Insights and Forecast - by Type
- 12. Competitive Analysis
- 12.1. Company Profiles
- 12.1.1 Sarwa Co
- 12.1.1.1. Company Overview
- 12.1.1.2. Products
- 12.1.1.3. Company Financials
- 12.1.1.4. SWOT Analysis
- 12.1.2 Beehive Federal Credit Union
- 12.1.2.1. Company Overview
- 12.1.2.2. Products
- 12.1.2.3. Company Financials
- 12.1.2.4. SWOT Analysis
- 12.1.3 Solaris Bank
- 12.1.3.1. Company Overview
- 12.1.3.2. Products
- 12.1.3.3. Company Financials
- 12.1.3.4. SWOT Analysis
- 12.1.4 NOW Money
- 12.1.4.1. Company Overview
- 12.1.4.2. Products
- 12.1.4.3. Company Financials
- 12.1.4.4. SWOT Analysis
- 12.1.5 Treezor
- 12.1.5.1. Company Overview
- 12.1.5.2. Products
- 12.1.5.3. Company Financials
- 12.1.5.4. SWOT Analysis
- 12.1.6 Telr
- 12.1.6.1. Company Overview
- 12.1.6.2. Products
- 12.1.6.3. Company Financials
- 12.1.6.4. SWOT Analysis
- 12.1.7 Mamo Pay
- 12.1.7.1. Company Overview
- 12.1.7.2. Products
- 12.1.7.3. Company Financials
- 12.1.7.4. SWOT Analysis
- 12.1.8 Felix
- 12.1.8.1. Company Overview
- 12.1.8.2. Products
- 12.1.8.3. Company Financials
- 12.1.8.4. SWOT Analysis
- 12.1.9 Jingle Pay
- 12.1.9.1. Company Overview
- 12.1.9.2. Products
- 12.1.9.3. Company Financials
- 12.1.9.4. SWOT Analysis
- 12.1.10 Al Baraka Bank**List Not Exhaustive
- 12.1.10.1. Company Overview
- 12.1.10.2. Products
- 12.1.10.3. Company Financials
- 12.1.10.4. SWOT Analysis
- 12.1.1 Sarwa Co
- 12.2. Market Entropy
- 12.2.1 Company's Key Areas Served
- 12.2.2 Recent Developments
- 12.3. Company Market Share Analysis 2025
- 12.3.1 Top 5 Companies Market Share Analysis
- 12.3.2 Top 3 Companies Market Share Analysis
- 12.4. List of Potential Customers
- 13. Research Methodology
List of Figures
- Figure 1: Global MEA BaaS Industry Revenue Breakdown (Million, %) by Region 2025 & 2033
- Figure 2: Global MEA BaaS Industry Volume Breakdown (Billion, %) by Region 2025 & 2033
- Figure 3: North America MEA BaaS Industry Revenue (Million), by Type 2025 & 2033
- Figure 4: North America MEA BaaS Industry Volume (Billion), by Type 2025 & 2033
- Figure 5: North America MEA BaaS Industry Revenue Share (%), by Type 2025 & 2033
- Figure 6: North America MEA BaaS Industry Volume Share (%), by Type 2025 & 2033
- Figure 7: North America MEA BaaS Industry Revenue (Million), by Service Type 2025 & 2033
- Figure 8: North America MEA BaaS Industry Volume (Billion), by Service Type 2025 & 2033
- Figure 9: North America MEA BaaS Industry Revenue Share (%), by Service Type 2025 & 2033
- Figure 10: North America MEA BaaS Industry Volume Share (%), by Service Type 2025 & 2033
- Figure 11: North America MEA BaaS Industry Revenue (Million), by Enterprises Size 2025 & 2033
- Figure 12: North America MEA BaaS Industry Volume (Billion), by Enterprises Size 2025 & 2033
- Figure 13: North America MEA BaaS Industry Revenue Share (%), by Enterprises Size 2025 & 2033
- Figure 14: North America MEA BaaS Industry Volume Share (%), by Enterprises Size 2025 & 2033
- Figure 15: North America MEA BaaS Industry Revenue (Million), by Country 2025 & 2033
- Figure 16: North America MEA BaaS Industry Volume (Billion), by Country 2025 & 2033
- Figure 17: North America MEA BaaS Industry Revenue Share (%), by Country 2025 & 2033
- Figure 18: North America MEA BaaS Industry Volume Share (%), by Country 2025 & 2033
- Figure 19: South America MEA BaaS Industry Revenue (Million), by Type 2025 & 2033
- Figure 20: South America MEA BaaS Industry Volume (Billion), by Type 2025 & 2033
- Figure 21: South America MEA BaaS Industry Revenue Share (%), by Type 2025 & 2033
- Figure 22: South America MEA BaaS Industry Volume Share (%), by Type 2025 & 2033
- Figure 23: South America MEA BaaS Industry Revenue (Million), by Service Type 2025 & 2033
- Figure 24: South America MEA BaaS Industry Volume (Billion), by Service Type 2025 & 2033
- Figure 25: South America MEA BaaS Industry Revenue Share (%), by Service Type 2025 & 2033
- Figure 26: South America MEA BaaS Industry Volume Share (%), by Service Type 2025 & 2033
- Figure 27: South America MEA BaaS Industry Revenue (Million), by Enterprises Size 2025 & 2033
- Figure 28: South America MEA BaaS Industry Volume (Billion), by Enterprises Size 2025 & 2033
- Figure 29: South America MEA BaaS Industry Revenue Share (%), by Enterprises Size 2025 & 2033
- Figure 30: South America MEA BaaS Industry Volume Share (%), by Enterprises Size 2025 & 2033
- Figure 31: South America MEA BaaS Industry Revenue (Million), by Country 2025 & 2033
- Figure 32: South America MEA BaaS Industry Volume (Billion), by Country 2025 & 2033
- Figure 33: South America MEA BaaS Industry Revenue Share (%), by Country 2025 & 2033
- Figure 34: South America MEA BaaS Industry Volume Share (%), by Country 2025 & 2033
- Figure 35: Europe MEA BaaS Industry Revenue (Million), by Type 2025 & 2033
- Figure 36: Europe MEA BaaS Industry Volume (Billion), by Type 2025 & 2033
- Figure 37: Europe MEA BaaS Industry Revenue Share (%), by Type 2025 & 2033
- Figure 38: Europe MEA BaaS Industry Volume Share (%), by Type 2025 & 2033
- Figure 39: Europe MEA BaaS Industry Revenue (Million), by Service Type 2025 & 2033
- Figure 40: Europe MEA BaaS Industry Volume (Billion), by Service Type 2025 & 2033
- Figure 41: Europe MEA BaaS Industry Revenue Share (%), by Service Type 2025 & 2033
- Figure 42: Europe MEA BaaS Industry Volume Share (%), by Service Type 2025 & 2033
- Figure 43: Europe MEA BaaS Industry Revenue (Million), by Enterprises Size 2025 & 2033
- Figure 44: Europe MEA BaaS Industry Volume (Billion), by Enterprises Size 2025 & 2033
- Figure 45: Europe MEA BaaS Industry Revenue Share (%), by Enterprises Size 2025 & 2033
- Figure 46: Europe MEA BaaS Industry Volume Share (%), by Enterprises Size 2025 & 2033
- Figure 47: Europe MEA BaaS Industry Revenue (Million), by Country 2025 & 2033
- Figure 48: Europe MEA BaaS Industry Volume (Billion), by Country 2025 & 2033
- Figure 49: Europe MEA BaaS Industry Revenue Share (%), by Country 2025 & 2033
- Figure 50: Europe MEA BaaS Industry Volume Share (%), by Country 2025 & 2033
- Figure 51: Middle East & Africa MEA BaaS Industry Revenue (Million), by Type 2025 & 2033
- Figure 52: Middle East & Africa MEA BaaS Industry Volume (Billion), by Type 2025 & 2033
- Figure 53: Middle East & Africa MEA BaaS Industry Revenue Share (%), by Type 2025 & 2033
- Figure 54: Middle East & Africa MEA BaaS Industry Volume Share (%), by Type 2025 & 2033
- Figure 55: Middle East & Africa MEA BaaS Industry Revenue (Million), by Service Type 2025 & 2033
- Figure 56: Middle East & Africa MEA BaaS Industry Volume (Billion), by Service Type 2025 & 2033
- Figure 57: Middle East & Africa MEA BaaS Industry Revenue Share (%), by Service Type 2025 & 2033
- Figure 58: Middle East & Africa MEA BaaS Industry Volume Share (%), by Service Type 2025 & 2033
- Figure 59: Middle East & Africa MEA BaaS Industry Revenue (Million), by Enterprises Size 2025 & 2033
- Figure 60: Middle East & Africa MEA BaaS Industry Volume (Billion), by Enterprises Size 2025 & 2033
- Figure 61: Middle East & Africa MEA BaaS Industry Revenue Share (%), by Enterprises Size 2025 & 2033
- Figure 62: Middle East & Africa MEA BaaS Industry Volume Share (%), by Enterprises Size 2025 & 2033
- Figure 63: Middle East & Africa MEA BaaS Industry Revenue (Million), by Country 2025 & 2033
- Figure 64: Middle East & Africa MEA BaaS Industry Volume (Billion), by Country 2025 & 2033
- Figure 65: Middle East & Africa MEA BaaS Industry Revenue Share (%), by Country 2025 & 2033
- Figure 66: Middle East & Africa MEA BaaS Industry Volume Share (%), by Country 2025 & 2033
- Figure 67: Asia Pacific MEA BaaS Industry Revenue (Million), by Type 2025 & 2033
- Figure 68: Asia Pacific MEA BaaS Industry Volume (Billion), by Type 2025 & 2033
- Figure 69: Asia Pacific MEA BaaS Industry Revenue Share (%), by Type 2025 & 2033
- Figure 70: Asia Pacific MEA BaaS Industry Volume Share (%), by Type 2025 & 2033
- Figure 71: Asia Pacific MEA BaaS Industry Revenue (Million), by Service Type 2025 & 2033
- Figure 72: Asia Pacific MEA BaaS Industry Volume (Billion), by Service Type 2025 & 2033
- Figure 73: Asia Pacific MEA BaaS Industry Revenue Share (%), by Service Type 2025 & 2033
- Figure 74: Asia Pacific MEA BaaS Industry Volume Share (%), by Service Type 2025 & 2033
- Figure 75: Asia Pacific MEA BaaS Industry Revenue (Million), by Enterprises Size 2025 & 2033
- Figure 76: Asia Pacific MEA BaaS Industry Volume (Billion), by Enterprises Size 2025 & 2033
- Figure 77: Asia Pacific MEA BaaS Industry Revenue Share (%), by Enterprises Size 2025 & 2033
- Figure 78: Asia Pacific MEA BaaS Industry Volume Share (%), by Enterprises Size 2025 & 2033
- Figure 79: Asia Pacific MEA BaaS Industry Revenue (Million), by Country 2025 & 2033
- Figure 80: Asia Pacific MEA BaaS Industry Volume (Billion), by Country 2025 & 2033
- Figure 81: Asia Pacific MEA BaaS Industry Revenue Share (%), by Country 2025 & 2033
- Figure 82: Asia Pacific MEA BaaS Industry Volume Share (%), by Country 2025 & 2033
List of Tables
- Table 1: Global MEA BaaS Industry Revenue Million Forecast, by Type 2020 & 2033
- Table 2: Global MEA BaaS Industry Volume Billion Forecast, by Type 2020 & 2033
- Table 3: Global MEA BaaS Industry Revenue Million Forecast, by Service Type 2020 & 2033
- Table 4: Global MEA BaaS Industry Volume Billion Forecast, by Service Type 2020 & 2033
- Table 5: Global MEA BaaS Industry Revenue Million Forecast, by Enterprises Size 2020 & 2033
- Table 6: Global MEA BaaS Industry Volume Billion Forecast, by Enterprises Size 2020 & 2033
- Table 7: Global MEA BaaS Industry Revenue Million Forecast, by Region 2020 & 2033
- Table 8: Global MEA BaaS Industry Volume Billion Forecast, by Region 2020 & 2033
- Table 9: Global MEA BaaS Industry Revenue Million Forecast, by Type 2020 & 2033
- Table 10: Global MEA BaaS Industry Volume Billion Forecast, by Type 2020 & 2033
- Table 11: Global MEA BaaS Industry Revenue Million Forecast, by Service Type 2020 & 2033
- Table 12: Global MEA BaaS Industry Volume Billion Forecast, by Service Type 2020 & 2033
- Table 13: Global MEA BaaS Industry Revenue Million Forecast, by Enterprises Size 2020 & 2033
- Table 14: Global MEA BaaS Industry Volume Billion Forecast, by Enterprises Size 2020 & 2033
- Table 15: Global MEA BaaS Industry Revenue Million Forecast, by Country 2020 & 2033
- Table 16: Global MEA BaaS Industry Volume Billion Forecast, by Country 2020 & 2033
- Table 17: United States MEA BaaS Industry Revenue (Million) Forecast, by Application 2020 & 2033
- Table 18: United States MEA BaaS Industry Volume (Billion) Forecast, by Application 2020 & 2033
- Table 19: Canada MEA BaaS Industry Revenue (Million) Forecast, by Application 2020 & 2033
- Table 20: Canada MEA BaaS Industry Volume (Billion) Forecast, by Application 2020 & 2033
- Table 21: Mexico MEA BaaS Industry Revenue (Million) Forecast, by Application 2020 & 2033
- Table 22: Mexico MEA BaaS Industry Volume (Billion) Forecast, by Application 2020 & 2033
- Table 23: Global MEA BaaS Industry Revenue Million Forecast, by Type 2020 & 2033
- Table 24: Global MEA BaaS Industry Volume Billion Forecast, by Type 2020 & 2033
- Table 25: Global MEA BaaS Industry Revenue Million Forecast, by Service Type 2020 & 2033
- Table 26: Global MEA BaaS Industry Volume Billion Forecast, by Service Type 2020 & 2033
- Table 27: Global MEA BaaS Industry Revenue Million Forecast, by Enterprises Size 2020 & 2033
- Table 28: Global MEA BaaS Industry Volume Billion Forecast, by Enterprises Size 2020 & 2033
- Table 29: Global MEA BaaS Industry Revenue Million Forecast, by Country 2020 & 2033
- Table 30: Global MEA BaaS Industry Volume Billion Forecast, by Country 2020 & 2033
- Table 31: Brazil MEA BaaS Industry Revenue (Million) Forecast, by Application 2020 & 2033
- Table 32: Brazil MEA BaaS Industry Volume (Billion) Forecast, by Application 2020 & 2033
- Table 33: Argentina MEA BaaS Industry Revenue (Million) Forecast, by Application 2020 & 2033
- Table 34: Argentina MEA BaaS Industry Volume (Billion) Forecast, by Application 2020 & 2033
- Table 35: Rest of South America MEA BaaS Industry Revenue (Million) Forecast, by Application 2020 & 2033
- Table 36: Rest of South America MEA BaaS Industry Volume (Billion) Forecast, by Application 2020 & 2033
- Table 37: Global MEA BaaS Industry Revenue Million Forecast, by Type 2020 & 2033
- Table 38: Global MEA BaaS Industry Volume Billion Forecast, by Type 2020 & 2033
- Table 39: Global MEA BaaS Industry Revenue Million Forecast, by Service Type 2020 & 2033
- Table 40: Global MEA BaaS Industry Volume Billion Forecast, by Service Type 2020 & 2033
- Table 41: Global MEA BaaS Industry Revenue Million Forecast, by Enterprises Size 2020 & 2033
- Table 42: Global MEA BaaS Industry Volume Billion Forecast, by Enterprises Size 2020 & 2033
- Table 43: Global MEA BaaS Industry Revenue Million Forecast, by Country 2020 & 2033
- Table 44: Global MEA BaaS Industry Volume Billion Forecast, by Country 2020 & 2033
- Table 45: United Kingdom MEA BaaS Industry Revenue (Million) Forecast, by Application 2020 & 2033
- Table 46: United Kingdom MEA BaaS Industry Volume (Billion) Forecast, by Application 2020 & 2033
- Table 47: Germany MEA BaaS Industry Revenue (Million) Forecast, by Application 2020 & 2033
- Table 48: Germany MEA BaaS Industry Volume (Billion) Forecast, by Application 2020 & 2033
- Table 49: France MEA BaaS Industry Revenue (Million) Forecast, by Application 2020 & 2033
- Table 50: France MEA BaaS Industry Volume (Billion) Forecast, by Application 2020 & 2033
- Table 51: Italy MEA BaaS Industry Revenue (Million) Forecast, by Application 2020 & 2033
- Table 52: Italy MEA BaaS Industry Volume (Billion) Forecast, by Application 2020 & 2033
- Table 53: Spain MEA BaaS Industry Revenue (Million) Forecast, by Application 2020 & 2033
- Table 54: Spain MEA BaaS Industry Volume (Billion) Forecast, by Application 2020 & 2033
- Table 55: Russia MEA BaaS Industry Revenue (Million) Forecast, by Application 2020 & 2033
- Table 56: Russia MEA BaaS Industry Volume (Billion) Forecast, by Application 2020 & 2033
- Table 57: Benelux MEA BaaS Industry Revenue (Million) Forecast, by Application 2020 & 2033
- Table 58: Benelux MEA BaaS Industry Volume (Billion) Forecast, by Application 2020 & 2033
- Table 59: Nordics MEA BaaS Industry Revenue (Million) Forecast, by Application 2020 & 2033
- Table 60: Nordics MEA BaaS Industry Volume (Billion) Forecast, by Application 2020 & 2033
- Table 61: Rest of Europe MEA BaaS Industry Revenue (Million) Forecast, by Application 2020 & 2033
- Table 62: Rest of Europe MEA BaaS Industry Volume (Billion) Forecast, by Application 2020 & 2033
- Table 63: Global MEA BaaS Industry Revenue Million Forecast, by Type 2020 & 2033
- Table 64: Global MEA BaaS Industry Volume Billion Forecast, by Type 2020 & 2033
- Table 65: Global MEA BaaS Industry Revenue Million Forecast, by Service Type 2020 & 2033
- Table 66: Global MEA BaaS Industry Volume Billion Forecast, by Service Type 2020 & 2033
- Table 67: Global MEA BaaS Industry Revenue Million Forecast, by Enterprises Size 2020 & 2033
- Table 68: Global MEA BaaS Industry Volume Billion Forecast, by Enterprises Size 2020 & 2033
- Table 69: Global MEA BaaS Industry Revenue Million Forecast, by Country 2020 & 2033
- Table 70: Global MEA BaaS Industry Volume Billion Forecast, by Country 2020 & 2033
- Table 71: Turkey MEA BaaS Industry Revenue (Million) Forecast, by Application 2020 & 2033
- Table 72: Turkey MEA BaaS Industry Volume (Billion) Forecast, by Application 2020 & 2033
- Table 73: Israel MEA BaaS Industry Revenue (Million) Forecast, by Application 2020 & 2033
- Table 74: Israel MEA BaaS Industry Volume (Billion) Forecast, by Application 2020 & 2033
- Table 75: GCC MEA BaaS Industry Revenue (Million) Forecast, by Application 2020 & 2033
- Table 76: GCC MEA BaaS Industry Volume (Billion) Forecast, by Application 2020 & 2033
- Table 77: North Africa MEA BaaS Industry Revenue (Million) Forecast, by Application 2020 & 2033
- Table 78: North Africa MEA BaaS Industry Volume (Billion) Forecast, by Application 2020 & 2033
- Table 79: South Africa MEA BaaS Industry Revenue (Million) Forecast, by Application 2020 & 2033
- Table 80: South Africa MEA BaaS Industry Volume (Billion) Forecast, by Application 2020 & 2033
- Table 81: Rest of Middle East & Africa MEA BaaS Industry Revenue (Million) Forecast, by Application 2020 & 2033
- Table 82: Rest of Middle East & Africa MEA BaaS Industry Volume (Billion) Forecast, by Application 2020 & 2033
- Table 83: Global MEA BaaS Industry Revenue Million Forecast, by Type 2020 & 2033
- Table 84: Global MEA BaaS Industry Volume Billion Forecast, by Type 2020 & 2033
- Table 85: Global MEA BaaS Industry Revenue Million Forecast, by Service Type 2020 & 2033
- Table 86: Global MEA BaaS Industry Volume Billion Forecast, by Service Type 2020 & 2033
- Table 87: Global MEA BaaS Industry Revenue Million Forecast, by Enterprises Size 2020 & 2033
- Table 88: Global MEA BaaS Industry Volume Billion Forecast, by Enterprises Size 2020 & 2033
- Table 89: Global MEA BaaS Industry Revenue Million Forecast, by Country 2020 & 2033
- Table 90: Global MEA BaaS Industry Volume Billion Forecast, by Country 2020 & 2033
- Table 91: China MEA BaaS Industry Revenue (Million) Forecast, by Application 2020 & 2033
- Table 92: China MEA BaaS Industry Volume (Billion) Forecast, by Application 2020 & 2033
- Table 93: India MEA BaaS Industry Revenue (Million) Forecast, by Application 2020 & 2033
- Table 94: India MEA BaaS Industry Volume (Billion) Forecast, by Application 2020 & 2033
- Table 95: Japan MEA BaaS Industry Revenue (Million) Forecast, by Application 2020 & 2033
- Table 96: Japan MEA BaaS Industry Volume (Billion) Forecast, by Application 2020 & 2033
- Table 97: South Korea MEA BaaS Industry Revenue (Million) Forecast, by Application 2020 & 2033
- Table 98: South Korea MEA BaaS Industry Volume (Billion) Forecast, by Application 2020 & 2033
- Table 99: ASEAN MEA BaaS Industry Revenue (Million) Forecast, by Application 2020 & 2033
- Table 100: ASEAN MEA BaaS Industry Volume (Billion) Forecast, by Application 2020 & 2033
- Table 101: Oceania MEA BaaS Industry Revenue (Million) Forecast, by Application 2020 & 2033
- Table 102: Oceania MEA BaaS Industry Volume (Billion) Forecast, by Application 2020 & 2033
- Table 103: Rest of Asia Pacific MEA BaaS Industry Revenue (Million) Forecast, by Application 2020 & 2033
- Table 104: Rest of Asia Pacific MEA BaaS Industry Volume (Billion) Forecast, by Application 2020 & 2033
Frequently Asked Questions
1. What is the projected Compound Annual Growth Rate (CAGR) of the MEA BaaS Industry?
The projected CAGR is approximately 7.40%.
2. Which companies are prominent players in the MEA BaaS Industry?
Key companies in the market include Sarwa Co, Beehive Federal Credit Union, Solaris Bank, NOW Money, Treezor, Telr, Mamo Pay, Felix, Jingle Pay, Al Baraka Bank**List Not Exhaustive.
3. What are the main segments of the MEA BaaS Industry?
The market segments include Type, Service Type, Enterprises Size.
4. Can you provide details about the market size?
The market size is estimated to be USD 65.51 Million as of 2022.
5. What are some drivers contributing to market growth?
Rise in Digital Banking the Region; Rise in Volume of Financial Transaction in the Region.
6. What are the notable trends driving market growth?
Rising Volume of Transaction in the Region.
7. Are there any restraints impacting market growth?
Rise in Digital Banking the Region; Rise in Volume of Financial Transaction in the Region.
8. Can you provide examples of recent developments in the market?
In March 2022. Aazzur partnered with Treezor which exists as a European firm in Banking-as-a-Service (BaaS). The partnership will increase Aazzur's client base and develop its BaaS offering in the region by supplying its payment infrastructure for account and card management, while Aazur will provide front-end layers, integration, and value-added products for front-end and wealth services.
9. What pricing options are available for accessing the report?
Pricing options include single-user, multi-user, and enterprise licenses priced at USD 3800, USD 4500, and USD 5800 respectively.
10. Is the market size provided in terms of value or volume?
The market size is provided in terms of value, measured in Million and volume, measured in Billion.
11. Are there any specific market keywords associated with the report?
Yes, the market keyword associated with the report is "MEA BaaS Industry," which aids in identifying and referencing the specific market segment covered.
12. How do I determine which pricing option suits my needs best?
The pricing options vary based on user requirements and access needs. Individual users may opt for single-user licenses, while businesses requiring broader access may choose multi-user or enterprise licenses for cost-effective access to the report.
13. Are there any additional resources or data provided in the MEA BaaS Industry report?
While the report offers comprehensive insights, it's advisable to review the specific contents or supplementary materials provided to ascertain if additional resources or data are available.
14. How can I stay updated on further developments or reports in the MEA BaaS Industry?
To stay informed about further developments, trends, and reports in the MEA BaaS Industry, consider subscribing to industry newsletters, following relevant companies and organizations, or regularly checking reputable industry news sources and publications.
Methodology
Step 1 - Identification of Relevant Samples Size from Population Database


Step 2 - Approaches for Defining Global Market Size (Value, Volume* & Price*)

Note*: In applicable scenarios
Step 3 - Data Sources
Primary Research
- Web Analytics
- Survey Reports
- Research Institute
- Latest Research Reports
- Opinion Leaders
Secondary Research
- Annual Reports
- White Paper
- Latest Press Release
- Industry Association
- Paid Database
- Investor Presentations

Step 4 - Data Triangulation
Involves using different sources of information in order to increase the validity of a study
These sources are likely to be stakeholders in a program - participants, other researchers, program staff, other community members, and so on.
Then we put all data in single framework & apply various statistical tools to find out the dynamic on the market.
During the analysis stage, feedback from the stakeholder groups would be compared to determine areas of agreement as well as areas of divergence