
Key Insights
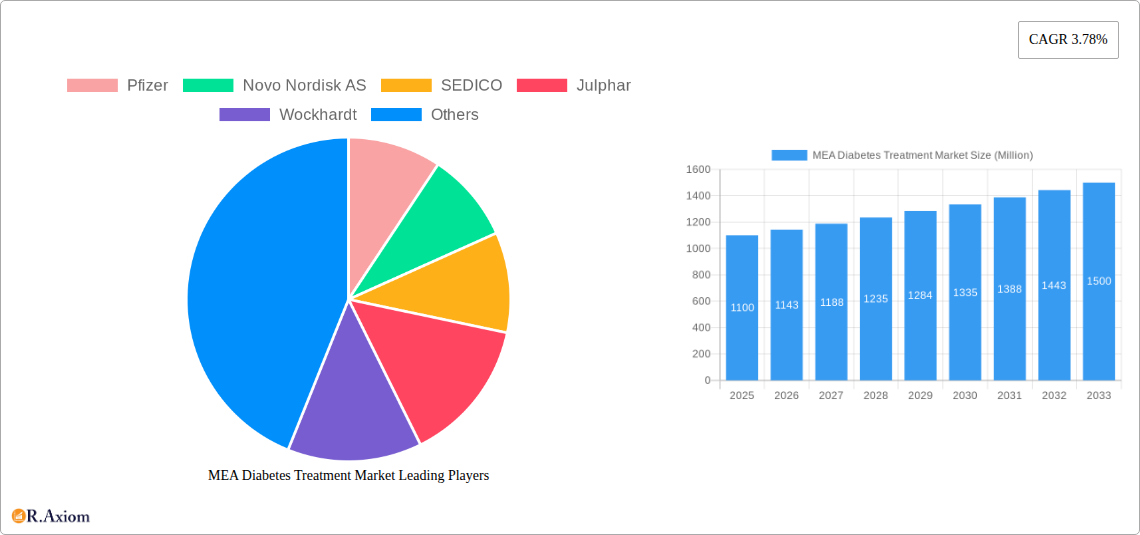
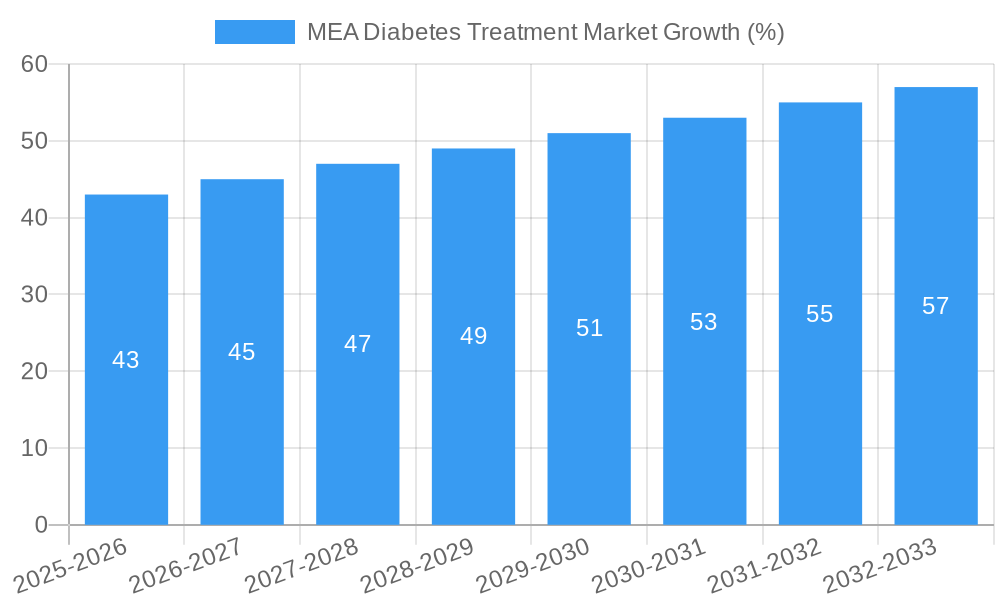
The MEA (Middle East and Africa) diabetes treatment market, valued at approximately $1.1 billion in 2025, is projected to experience steady growth, driven by rising diabetes prevalence, increasing awareness of effective treatments, and improved healthcare infrastructure in certain regions. The market's Compound Annual Growth Rate (CAGR) of 3.78% from 2025 to 2033 indicates a substantial expansion, with projected market size exceeding $1.6 billion by 2033. Key growth drivers include the increasing geriatric population, lifestyle changes leading to higher diabetes incidence, and growing adoption of insulin therapies, particularly long-acting and basal insulins. However, factors such as high treatment costs, limited healthcare access in some parts of the region, and a lack of awareness in certain underserved communities may pose challenges to market penetration. The market is segmented by insulin type (Basal/Long-acting, Bolus/Fast-acting, Traditional Human, Combination, Biosimilars), with long-acting insulins expected to lead the segment due to their improved efficacy and convenience. Major players like Novo Nordisk, Sanofi Aventis, and Eli Lilly are actively engaged in the market, shaping its competitive landscape through product innovation and strategic partnerships. Further growth will depend on government initiatives to enhance diabetes management programs, increase affordability of treatments, and address regional disparities in healthcare access.
The growth trajectory of the MEA diabetes treatment market is heavily influenced by the varying healthcare infrastructure and economic conditions across its diverse nations. While countries like the UAE and Saudi Arabia exhibit robust healthcare systems and higher disposable incomes driving increased demand for advanced therapies, other regions may face challenges in terms of accessibility and affordability. This disparity calls for a multifaceted approach, including targeted public health campaigns to increase awareness and improve early detection rates, alongside initiatives to make treatment more accessible and affordable in underserved communities. The strategic deployment of biosimilar insulins, offering cost-effective alternatives to branded products, could play a significant role in expanding market access and accelerating overall growth within the region. The increasing focus on personalized medicine and the development of innovative treatment approaches could further shape the market's evolution in the coming years.
MEA Diabetes Treatment Market: A Comprehensive Report (2019-2033)
This detailed report provides a comprehensive analysis of the Middle East and Africa (MEA) diabetes treatment market, offering invaluable insights for industry stakeholders, investors, and strategic decision-makers. With a focus on market dynamics, competitive landscape, and future growth projections, this report covers the period from 2019 to 2033, with 2025 as the base year and a forecast period of 2025-2033. The historical period analyzed is 2019-2024. The market is segmented by product type, including Basal or Long-acting Insulins, Basaglar (Insulin Glargine), Bolus or Fast-acting Insulins, Apidra (Insulin Glulisine), Traditional Human Insulins, Insuman, Combination Insulins, Soliqua/Suliqua (Insulin glargine/Lixisenatide), and Biosimilar Insulins. Key players analyzed include Pfizer, Novo Nordisk AS, SEDICO, Julphar, Wockhardt, Eli Lilly, Exir, Eli Lilly and Company, Sanofi Aventis, Biocon, and Novo Nordisk, along with an analysis of the "Other Company" segment. The report is valued at xx Million and is expected to reach xx Million by 2033.
MEA Diabetes Treatment Market Market Concentration & Innovation
The MEA diabetes treatment market exhibits a moderately concentrated structure, with key players holding significant market share. Pfizer, Novo Nordisk, and Sanofi Aventis are among the dominant players, collectively accounting for an estimated xx% of the market in 2025. However, the market is witnessing increased competition from local and regional players like Julphar and SEDICO, and the growing presence of biosimilar insulin manufacturers.
Innovation is a crucial driver in this market, fueled by the need for more effective and convenient treatment options. The development of advanced insulin delivery systems, such as wearable insulin pumps (as evidenced by EOFlow's recent UAE launch), is a significant trend. Furthermore, the rising prevalence of diabetes and increasing healthcare expenditure are bolstering innovation efforts. Regulatory frameworks within various MEA countries play a key role, influencing market access and the speed of innovation adoption. The presence of biosimilar insulins introduces a cost-effective alternative, influencing the competitive landscape. Mergers and acquisitions (M&A) activity, while not exceptionally high, is present, with deals primarily focused on expanding market access and securing distribution networks. For example, Eli Lilly's partnership with Eva Pharma showcases a strategic move to enhance insulin access in Africa. The average M&A deal value in the past 5 years has been estimated at xx Million.
MEA Diabetes Treatment Market Industry Trends & Insights
The MEA diabetes treatment market is characterized by robust growth, driven primarily by the rising prevalence of diabetes across the region, coupled with increasing awareness and improved access to healthcare. The market is projected to exhibit a CAGR of xx% during the forecast period (2025-2033). Technological disruptions, such as the introduction of advanced insulin delivery systems and continuous glucose monitoring (CGM) devices, are significantly impacting market dynamics. Consumer preferences are shifting towards more convenient and less invasive treatment options, further driving demand for innovative products. Competitive dynamics are intensifying, with both established multinational pharmaceutical companies and emerging local players vying for market share. The market penetration of insulin analogs is gradually increasing, replacing traditional human insulins. Price competition from biosimilars and generics is also influencing the market, particularly in countries with price-sensitive healthcare systems.
Dominant Markets & Segments in MEA Diabetes Treatment Market
The Gulf Cooperation Council (GCC) countries, particularly the UAE and Saudi Arabia, represent the most dominant markets within the MEA region due to high diabetes prevalence rates, advanced healthcare infrastructure, and strong economic conditions.
- Key Drivers for GCC Dominance:
- High per capita income and healthcare expenditure.
- Robust healthcare infrastructure and advanced medical facilities.
- Government initiatives promoting diabetes awareness and management.
- Strong pharmaceutical distribution networks.
The segment of Basal or Long-acting Insulins holds the largest market share due to its efficacy in providing consistent blood glucose control. However, the Bolus or Fast-acting Insulins segment is experiencing significant growth driven by the increasing preference for flexible insulin regimens. The market for Biosimilar Insulins is also expanding rapidly, driven by cost advantages and increased availability.
MEA Diabetes Treatment Market Product Developments
The MEA diabetes treatment market witnesses continuous product innovation, focusing on enhanced efficacy, convenience, and affordability. New insulin analogs with improved pharmacokinetic profiles and novel delivery systems, such as wearable insulin pumps and smart pens, are being introduced. The development of biosimilar insulins provides cost-effective alternatives to brand-name products, widening treatment accessibility. These advancements are primarily driven by technological advancements in drug delivery and an increased focus on personalized medicine. The market fit of these products is directly linked to the increasing prevalence of diabetes and improved affordability of healthcare services in the region.
Report Scope & Segmentation Analysis
This report comprehensively analyzes the MEA diabetes treatment market across various segments:
Basal or Long-acting Insulins: This segment is projected to maintain its dominance throughout the forecast period, driven by the efficacy of long-acting insulins in managing blood glucose levels. Market size is estimated at xx Million in 2025 and is expected to reach xx Million by 2033.
Basaglar (Insulin Glargine): This segment benefits from its established market presence and strong brand recognition. Growth is driven by its efficacy and convenience compared to older insulin formulations.
Bolus or Fast-acting Insulins: This segment is experiencing rapid growth due to its flexibility in managing blood glucose levels before meals.
Apidra (Insulin Glulisine): This segment enjoys a positive outlook due to its rapid onset of action and ease of use.
Traditional Human Insulins: While this segment faces competition from newer insulin analogs, it continues to serve a significant market share due to its lower cost.
Combination Insulins: This segment holds a smaller market share, but its growth is anticipated due to its effectiveness in managing specific diabetes types.
Soliqua/Suliqua (Insulin glargine/Lixisenatide): This segment is experiencing growth driven by the combined benefits of insulin and GLP-1 receptor agonist.
Biosimilar Insulins: This segment showcases substantial growth potential due to its cost-effectiveness and bioequivalence to brand-name products.
Key Drivers of MEA Diabetes Treatment Market Growth
Several factors contribute to the growth of the MEA diabetes treatment market. The escalating prevalence of diabetes, driven by lifestyle changes and aging populations, is a primary driver. Increased healthcare spending, coupled with government initiatives promoting diabetes awareness and management, further fuels market growth. Technological advancements, such as the development of advanced insulin delivery systems and CGM devices, enhance treatment efficacy and patient convenience.
Challenges in the MEA Diabetes Treatment Market Sector
Challenges impacting the MEA diabetes treatment market include limited healthcare access in certain regions, high treatment costs restricting affordability for many patients, and the prevalence of counterfeit medications. Supply chain disruptions and variations in regulatory frameworks across different MEA countries also pose significant hurdles. Furthermore, ensuring the consistent and widespread availability of affordable insulin across the varied socio-economic strata of the region is a major challenge.
Emerging Opportunities in MEA Diabetes Treatment Market
Significant opportunities exist for expansion into underserved markets within the MEA region. The growth of telehealth and digital health platforms offers new avenues for diabetes management and patient education. The growing adoption of innovative technologies, such as AI-powered diagnostic tools and remote monitoring systems, presents further opportunities. Finally, the increasing focus on preventative healthcare measures holds potential for positive market impact.
Leading Players in the MEA Diabetes Treatment Market Market
- Pfizer
- Novo Nordisk AS
- SEDICO
- Julphar
- Wockhardt
- Eli Lilly
- Exir
- Eli Lilly and Company
- Sanofi Aventis
- Biocon
- Novo Nordisk
- Other Company Share Analyse
Key Developments in MEA Diabetes Treatment Market Industry
- February 2023: EOFlow receives UAE MOHAP certification for its EOPatch wearable insulin pump, marking its entry into the Middle East market and potentially serving as a gateway to other MENA countries.
- December 2022: Eli Lilly partners with Eva Pharma to improve insulin access in Africa by providing active pharmaceutical ingredients and technology transfer at reduced costs.
Strategic Outlook for MEA Diabetes Treatment Market Market
The MEA diabetes treatment market holds significant growth potential driven by increasing diabetes prevalence, rising healthcare expenditure, and technological advancements. Focusing on cost-effective solutions, expansion into underserved markets, and leveraging digital health technologies will be key for successful market penetration and sustained growth. The focus on preventative healthcare will play a crucial role in long-term sustainable market growth.
MEA Diabetes Treatment Market Segmentation
-
1. Product
- 1.1. Basal or Long-acting Insulins
- 1.2. Bolus or Fast-acting Insulins
- 1.3. Traditional Human Insulins
- 1.4. Combination Insulins
- 1.5. Biosimilar Insulins
-
2. Geography
- 2.1. Saudi Arabia
- 2.2. Iran
- 2.3. Egypt
- 2.4. Oman
- 2.5. South Africa
- 2.6. Rest of Middle East and Africa
MEA Diabetes Treatment Market Segmentation By Geography
- 1. Saudi Arabia
- 2. Iran
- 3. Egypt
- 4. Oman
- 5. South Africa
- 6. Rest of Middle East and Africa
MEA Diabetes Treatment Market REPORT HIGHLIGHTS
| Aspects | Details |
|---|---|
| Study Period | 2019-2033 |
| Base Year | 2024 |
| Estimated Year | 2025 |
| Forecast Period | 2025-2033 |
| Historical Period | 2019-2024 |
| Growth Rate | CAGR of 3.78% from 2019-2033 |
| Segmentation |
|
Table of Contents
- 1. Introduction
- 1.1. Research Scope
- 1.2. Market Segmentation
- 1.3. Research Methodology
- 1.4. Definitions and Assumptions
- 2. Executive Summary
- 2.1. Introduction
- 3. Market Dynamics
- 3.1. Introduction
- 3.2. Market Drivers
- 3.2.1. ; The Rise in Global Prevalence of Cases of Obesity due to Modern Sedentary Lifestyles; Rise in Awareness and Disposable Income in Developed Economies
- 3.3. Market Restrains
- 3.3.1 ; Highly Cost of Branded Products in Emerging Countries; Severe Adverse Associated with Medication Including Seizures
- 3.3.2 Suicidal Attempts and Even Death; Adoption of Traditional Yoga and Herbal Products
- 3.4. Market Trends
- 3.4.1. Biosimilar Insulin Segment Holds Highest Market Share in Middle-East and Africa Human Insulin Market.
- 4. Market Factor Analysis
- 4.1. Porters Five Forces
- 4.2. Supply/Value Chain
- 4.3. PESTEL analysis
- 4.4. Market Entropy
- 4.5. Patent/Trademark Analysis
- 5. Global MEA Diabetes Treatment Market Analysis, Insights and Forecast, 2019-2031
- 5.1. Market Analysis, Insights and Forecast - by Product
- 5.1.1. Basal or Long-acting Insulins
- 5.1.2. Bolus or Fast-acting Insulins
- 5.1.3. Traditional Human Insulins
- 5.1.4. Combination Insulins
- 5.1.5. Biosimilar Insulins
- 5.2. Market Analysis, Insights and Forecast - by Geography
- 5.2.1. Saudi Arabia
- 5.2.2. Iran
- 5.2.3. Egypt
- 5.2.4. Oman
- 5.2.5. South Africa
- 5.2.6. Rest of Middle East and Africa
- 5.3. Market Analysis, Insights and Forecast - by Region
- 5.3.1. Saudi Arabia
- 5.3.2. Iran
- 5.3.3. Egypt
- 5.3.4. Oman
- 5.3.5. South Africa
- 5.3.6. Rest of Middle East and Africa
- 5.1. Market Analysis, Insights and Forecast - by Product
- 6. Saudi Arabia MEA Diabetes Treatment Market Analysis, Insights and Forecast, 2019-2031
- 6.1. Market Analysis, Insights and Forecast - by Product
- 6.1.1. Basal or Long-acting Insulins
- 6.1.2. Bolus or Fast-acting Insulins
- 6.1.3. Traditional Human Insulins
- 6.1.4. Combination Insulins
- 6.1.5. Biosimilar Insulins
- 6.2. Market Analysis, Insights and Forecast - by Geography
- 6.2.1. Saudi Arabia
- 6.2.2. Iran
- 6.2.3. Egypt
- 6.2.4. Oman
- 6.2.5. South Africa
- 6.2.6. Rest of Middle East and Africa
- 6.1. Market Analysis, Insights and Forecast - by Product
- 7. Iran MEA Diabetes Treatment Market Analysis, Insights and Forecast, 2019-2031
- 7.1. Market Analysis, Insights and Forecast - by Product
- 7.1.1. Basal or Long-acting Insulins
- 7.1.2. Bolus or Fast-acting Insulins
- 7.1.3. Traditional Human Insulins
- 7.1.4. Combination Insulins
- 7.1.5. Biosimilar Insulins
- 7.2. Market Analysis, Insights and Forecast - by Geography
- 7.2.1. Saudi Arabia
- 7.2.2. Iran
- 7.2.3. Egypt
- 7.2.4. Oman
- 7.2.5. South Africa
- 7.2.6. Rest of Middle East and Africa
- 7.1. Market Analysis, Insights and Forecast - by Product
- 8. Egypt MEA Diabetes Treatment Market Analysis, Insights and Forecast, 2019-2031
- 8.1. Market Analysis, Insights and Forecast - by Product
- 8.1.1. Basal or Long-acting Insulins
- 8.1.2. Bolus or Fast-acting Insulins
- 8.1.3. Traditional Human Insulins
- 8.1.4. Combination Insulins
- 8.1.5. Biosimilar Insulins
- 8.2. Market Analysis, Insights and Forecast - by Geography
- 8.2.1. Saudi Arabia
- 8.2.2. Iran
- 8.2.3. Egypt
- 8.2.4. Oman
- 8.2.5. South Africa
- 8.2.6. Rest of Middle East and Africa
- 8.1. Market Analysis, Insights and Forecast - by Product
- 9. Oman MEA Diabetes Treatment Market Analysis, Insights and Forecast, 2019-2031
- 9.1. Market Analysis, Insights and Forecast - by Product
- 9.1.1. Basal or Long-acting Insulins
- 9.1.2. Bolus or Fast-acting Insulins
- 9.1.3. Traditional Human Insulins
- 9.1.4. Combination Insulins
- 9.1.5. Biosimilar Insulins
- 9.2. Market Analysis, Insights and Forecast - by Geography
- 9.2.1. Saudi Arabia
- 9.2.2. Iran
- 9.2.3. Egypt
- 9.2.4. Oman
- 9.2.5. South Africa
- 9.2.6. Rest of Middle East and Africa
- 9.1. Market Analysis, Insights and Forecast - by Product
- 10. South Africa MEA Diabetes Treatment Market Analysis, Insights and Forecast, 2019-2031
- 10.1. Market Analysis, Insights and Forecast - by Product
- 10.1.1. Basal or Long-acting Insulins
- 10.1.2. Bolus or Fast-acting Insulins
- 10.1.3. Traditional Human Insulins
- 10.1.4. Combination Insulins
- 10.1.5. Biosimilar Insulins
- 10.2. Market Analysis, Insights and Forecast - by Geography
- 10.2.1. Saudi Arabia
- 10.2.2. Iran
- 10.2.3. Egypt
- 10.2.4. Oman
- 10.2.5. South Africa
- 10.2.6. Rest of Middle East and Africa
- 10.1. Market Analysis, Insights and Forecast - by Product
- 11. Rest of Middle East and Africa MEA Diabetes Treatment Market Analysis, Insights and Forecast, 2019-2031
- 11.1. Market Analysis, Insights and Forecast - by Product
- 11.1.1. Basal or Long-acting Insulins
- 11.1.2. Bolus or Fast-acting Insulins
- 11.1.3. Traditional Human Insulins
- 11.1.4. Combination Insulins
- 11.1.5. Biosimilar Insulins
- 11.2. Market Analysis, Insights and Forecast - by Geography
- 11.2.1. Saudi Arabia
- 11.2.2. Iran
- 11.2.3. Egypt
- 11.2.4. Oman
- 11.2.5. South Africa
- 11.2.6. Rest of Middle East and Africa
- 11.1. Market Analysis, Insights and Forecast - by Product
- 12. North America MEA Diabetes Treatment Market Analysis, Insights and Forecast, 2019-2031
- 12.1. Market Analysis, Insights and Forecast - By Country/Sub-region
- 12.1.1 United States
- 12.1.2 Canada
- 12.1.3 Mexico
- 13. Europe MEA Diabetes Treatment Market Analysis, Insights and Forecast, 2019-2031
- 13.1. Market Analysis, Insights and Forecast - By Country/Sub-region
- 13.1.1 Germany
- 13.1.2 United Kingdom
- 13.1.3 France
- 13.1.4 Spain
- 13.1.5 Italy
- 13.1.6 Spain
- 13.1.7 Belgium
- 13.1.8 Netherland
- 13.1.9 Nordics
- 13.1.10 Rest of Europe
- 14. Asia Pacific MEA Diabetes Treatment Market Analysis, Insights and Forecast, 2019-2031
- 14.1. Market Analysis, Insights and Forecast - By Country/Sub-region
- 14.1.1 China
- 14.1.2 Japan
- 14.1.3 India
- 14.1.4 South Korea
- 14.1.5 Southeast Asia
- 14.1.6 Australia
- 14.1.7 Indonesia
- 14.1.8 Phillipes
- 14.1.9 Singapore
- 14.1.10 Thailandc
- 14.1.11 Rest of Asia Pacific
- 15. South America MEA Diabetes Treatment Market Analysis, Insights and Forecast, 2019-2031
- 15.1. Market Analysis, Insights and Forecast - By Country/Sub-region
- 15.1.1 Brazil
- 15.1.2 Argentina
- 15.1.3 Peru
- 15.1.4 Chile
- 15.1.5 Colombia
- 15.1.6 Ecuador
- 15.1.7 Venezuela
- 15.1.8 Rest of South America
- 16. North America MEA Diabetes Treatment Market Analysis, Insights and Forecast, 2019-2031
- 16.1. Market Analysis, Insights and Forecast - By Country/Sub-region
- 16.1.1 United States
- 16.1.2 Canada
- 16.1.3 Mexico
- 17. MEA MEA Diabetes Treatment Market Analysis, Insights and Forecast, 2019-2031
- 17.1. Market Analysis, Insights and Forecast - By Country/Sub-region
- 17.1.1 United Arab Emirates
- 17.1.2 Saudi Arabia
- 17.1.3 South Africa
- 17.1.4 Rest of Middle East and Africa
- 18. Competitive Analysis
- 18.1. Global Market Share Analysis 2024
- 18.2. Company Profiles
- 18.2.1 Pfizer
- 18.2.1.1. Overview
- 18.2.1.2. Products
- 18.2.1.3. SWOT Analysis
- 18.2.1.4. Recent Developments
- 18.2.1.5. Financials (Based on Availability)
- 18.2.2 Novo Nordisk AS
- 18.2.2.1. Overview
- 18.2.2.2. Products
- 18.2.2.3. SWOT Analysis
- 18.2.2.4. Recent Developments
- 18.2.2.5. Financials (Based on Availability)
- 18.2.3 SEDICO
- 18.2.3.1. Overview
- 18.2.3.2. Products
- 18.2.3.3. SWOT Analysis
- 18.2.3.4. Recent Developments
- 18.2.3.5. Financials (Based on Availability)
- 18.2.4 Julphar
- 18.2.4.1. Overview
- 18.2.4.2. Products
- 18.2.4.3. SWOT Analysis
- 18.2.4.4. Recent Developments
- 18.2.4.5. Financials (Based on Availability)
- 18.2.5 Wockhardt
- 18.2.5.1. Overview
- 18.2.5.2. Products
- 18.2.5.3. SWOT Analysis
- 18.2.5.4. Recent Developments
- 18.2.5.5. Financials (Based on Availability)
- 18.2.6 Eli Lilly
- 18.2.6.1. Overview
- 18.2.6.2. Products
- 18.2.6.3. SWOT Analysis
- 18.2.6.4. Recent Developments
- 18.2.6.5. Financials (Based on Availability)
- 18.2.7 Exir
- 18.2.7.1. Overview
- 18.2.7.2. Products
- 18.2.7.3. SWOT Analysis
- 18.2.7.4. Recent Developments
- 18.2.7.5. Financials (Based on Availability)
- 18.2.8 Eli Lilly and Company
- 18.2.8.1. Overview
- 18.2.8.2. Products
- 18.2.8.3. SWOT Analysis
- 18.2.8.4. Recent Developments
- 18.2.8.5. Financials (Based on Availability)
- 18.2.9 Sanofi Aventis
- 18.2.9.1. Overview
- 18.2.9.2. Products
- 18.2.9.3. SWOT Analysis
- 18.2.9.4. Recent Developments
- 18.2.9.5. Financials (Based on Availability)
- 18.2.10 Biocon
- 18.2.10.1. Overview
- 18.2.10.2. Products
- 18.2.10.3. SWOT Analysis
- 18.2.10.4. Recent Developments
- 18.2.10.5. Financials (Based on Availability)
- 18.2.11 Novo Nordisk
- 18.2.11.1. Overview
- 18.2.11.2. Products
- 18.2.11.3. SWOT Analysis
- 18.2.11.4. Recent Developments
- 18.2.11.5. Financials (Based on Availability)
- 18.2.12 Other Company Share Analyse
- 18.2.12.1. Overview
- 18.2.12.2. Products
- 18.2.12.3. SWOT Analysis
- 18.2.12.4. Recent Developments
- 18.2.12.5. Financials (Based on Availability)
- 18.2.1 Pfizer
List of Figures
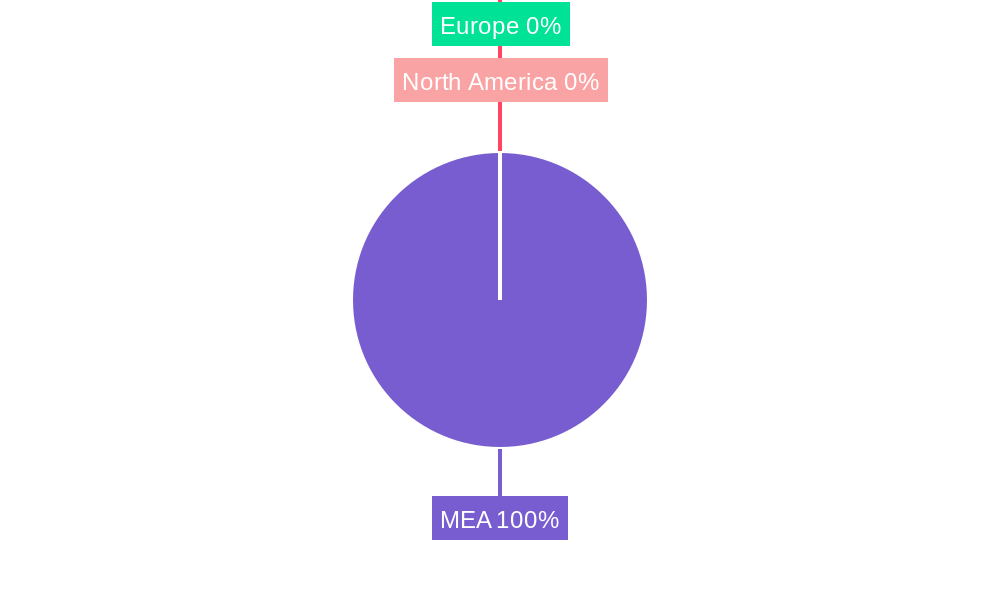
- Figure 1: Global MEA Diabetes Treatment Market Revenue Breakdown (Million, %) by Region 2024 & 2032
- Figure 2: Global MEA Diabetes Treatment Market Volume Breakdown (K Unit, %) by Region 2024 & 2032
- Figure 3: North America MEA Diabetes Treatment Market Revenue (Million), by Country 2024 & 2032
- Figure 4: North America MEA Diabetes Treatment Market Volume (K Unit), by Country 2024 & 2032
- Figure 5: North America MEA Diabetes Treatment Market Revenue Share (%), by Country 2024 & 2032
- Figure 6: North America MEA Diabetes Treatment Market Volume Share (%), by Country 2024 & 2032
- Figure 7: Europe MEA Diabetes Treatment Market Revenue (Million), by Country 2024 & 2032
- Figure 8: Europe MEA Diabetes Treatment Market Volume (K Unit), by Country 2024 & 2032
- Figure 9: Europe MEA Diabetes Treatment Market Revenue Share (%), by Country 2024 & 2032
- Figure 10: Europe MEA Diabetes Treatment Market Volume Share (%), by Country 2024 & 2032
- Figure 11: Asia Pacific MEA Diabetes Treatment Market Revenue (Million), by Country 2024 & 2032
- Figure 12: Asia Pacific MEA Diabetes Treatment Market Volume (K Unit), by Country 2024 & 2032
- Figure 13: Asia Pacific MEA Diabetes Treatment Market Revenue Share (%), by Country 2024 & 2032
- Figure 14: Asia Pacific MEA Diabetes Treatment Market Volume Share (%), by Country 2024 & 2032
- Figure 15: South America MEA Diabetes Treatment Market Revenue (Million), by Country 2024 & 2032
- Figure 16: South America MEA Diabetes Treatment Market Volume (K Unit), by Country 2024 & 2032
- Figure 17: South America MEA Diabetes Treatment Market Revenue Share (%), by Country 2024 & 2032
- Figure 18: South America MEA Diabetes Treatment Market Volume Share (%), by Country 2024 & 2032
- Figure 19: North America MEA Diabetes Treatment Market Revenue (Million), by Country 2024 & 2032
- Figure 20: North America MEA Diabetes Treatment Market Volume (K Unit), by Country 2024 & 2032
- Figure 21: North America MEA Diabetes Treatment Market Revenue Share (%), by Country 2024 & 2032
- Figure 22: North America MEA Diabetes Treatment Market Volume Share (%), by Country 2024 & 2032
- Figure 23: MEA MEA Diabetes Treatment Market Revenue (Million), by Country 2024 & 2032
- Figure 24: MEA MEA Diabetes Treatment Market Volume (K Unit), by Country 2024 & 2032
- Figure 25: MEA MEA Diabetes Treatment Market Revenue Share (%), by Country 2024 & 2032
- Figure 26: MEA MEA Diabetes Treatment Market Volume Share (%), by Country 2024 & 2032
- Figure 27: Saudi Arabia MEA Diabetes Treatment Market Revenue (Million), by Product 2024 & 2032
- Figure 28: Saudi Arabia MEA Diabetes Treatment Market Volume (K Unit), by Product 2024 & 2032
- Figure 29: Saudi Arabia MEA Diabetes Treatment Market Revenue Share (%), by Product 2024 & 2032
- Figure 30: Saudi Arabia MEA Diabetes Treatment Market Volume Share (%), by Product 2024 & 2032
- Figure 31: Saudi Arabia MEA Diabetes Treatment Market Revenue (Million), by Geography 2024 & 2032
- Figure 32: Saudi Arabia MEA Diabetes Treatment Market Volume (K Unit), by Geography 2024 & 2032
- Figure 33: Saudi Arabia MEA Diabetes Treatment Market Revenue Share (%), by Geography 2024 & 2032
- Figure 34: Saudi Arabia MEA Diabetes Treatment Market Volume Share (%), by Geography 2024 & 2032
- Figure 35: Saudi Arabia MEA Diabetes Treatment Market Revenue (Million), by Country 2024 & 2032
- Figure 36: Saudi Arabia MEA Diabetes Treatment Market Volume (K Unit), by Country 2024 & 2032
- Figure 37: Saudi Arabia MEA Diabetes Treatment Market Revenue Share (%), by Country 2024 & 2032
- Figure 38: Saudi Arabia MEA Diabetes Treatment Market Volume Share (%), by Country 2024 & 2032
- Figure 39: Iran MEA Diabetes Treatment Market Revenue (Million), by Product 2024 & 2032
- Figure 40: Iran MEA Diabetes Treatment Market Volume (K Unit), by Product 2024 & 2032
- Figure 41: Iran MEA Diabetes Treatment Market Revenue Share (%), by Product 2024 & 2032
- Figure 42: Iran MEA Diabetes Treatment Market Volume Share (%), by Product 2024 & 2032
- Figure 43: Iran MEA Diabetes Treatment Market Revenue (Million), by Geography 2024 & 2032
- Figure 44: Iran MEA Diabetes Treatment Market Volume (K Unit), by Geography 2024 & 2032
- Figure 45: Iran MEA Diabetes Treatment Market Revenue Share (%), by Geography 2024 & 2032
- Figure 46: Iran MEA Diabetes Treatment Market Volume Share (%), by Geography 2024 & 2032
- Figure 47: Iran MEA Diabetes Treatment Market Revenue (Million), by Country 2024 & 2032
- Figure 48: Iran MEA Diabetes Treatment Market Volume (K Unit), by Country 2024 & 2032
- Figure 49: Iran MEA Diabetes Treatment Market Revenue Share (%), by Country 2024 & 2032
- Figure 50: Iran MEA Diabetes Treatment Market Volume Share (%), by Country 2024 & 2032
- Figure 51: Egypt MEA Diabetes Treatment Market Revenue (Million), by Product 2024 & 2032
- Figure 52: Egypt MEA Diabetes Treatment Market Volume (K Unit), by Product 2024 & 2032
- Figure 53: Egypt MEA Diabetes Treatment Market Revenue Share (%), by Product 2024 & 2032
- Figure 54: Egypt MEA Diabetes Treatment Market Volume Share (%), by Product 2024 & 2032
- Figure 55: Egypt MEA Diabetes Treatment Market Revenue (Million), by Geography 2024 & 2032
- Figure 56: Egypt MEA Diabetes Treatment Market Volume (K Unit), by Geography 2024 & 2032
- Figure 57: Egypt MEA Diabetes Treatment Market Revenue Share (%), by Geography 2024 & 2032
- Figure 58: Egypt MEA Diabetes Treatment Market Volume Share (%), by Geography 2024 & 2032
- Figure 59: Egypt MEA Diabetes Treatment Market Revenue (Million), by Country 2024 & 2032
- Figure 60: Egypt MEA Diabetes Treatment Market Volume (K Unit), by Country 2024 & 2032
- Figure 61: Egypt MEA Diabetes Treatment Market Revenue Share (%), by Country 2024 & 2032
- Figure 62: Egypt MEA Diabetes Treatment Market Volume Share (%), by Country 2024 & 2032
- Figure 63: Oman MEA Diabetes Treatment Market Revenue (Million), by Product 2024 & 2032
- Figure 64: Oman MEA Diabetes Treatment Market Volume (K Unit), by Product 2024 & 2032
- Figure 65: Oman MEA Diabetes Treatment Market Revenue Share (%), by Product 2024 & 2032
- Figure 66: Oman MEA Diabetes Treatment Market Volume Share (%), by Product 2024 & 2032
- Figure 67: Oman MEA Diabetes Treatment Market Revenue (Million), by Geography 2024 & 2032
- Figure 68: Oman MEA Diabetes Treatment Market Volume (K Unit), by Geography 2024 & 2032
- Figure 69: Oman MEA Diabetes Treatment Market Revenue Share (%), by Geography 2024 & 2032
- Figure 70: Oman MEA Diabetes Treatment Market Volume Share (%), by Geography 2024 & 2032
- Figure 71: Oman MEA Diabetes Treatment Market Revenue (Million), by Country 2024 & 2032
- Figure 72: Oman MEA Diabetes Treatment Market Volume (K Unit), by Country 2024 & 2032
- Figure 73: Oman MEA Diabetes Treatment Market Revenue Share (%), by Country 2024 & 2032
- Figure 74: Oman MEA Diabetes Treatment Market Volume Share (%), by Country 2024 & 2032
- Figure 75: South Africa MEA Diabetes Treatment Market Revenue (Million), by Product 2024 & 2032
- Figure 76: South Africa MEA Diabetes Treatment Market Volume (K Unit), by Product 2024 & 2032
- Figure 77: South Africa MEA Diabetes Treatment Market Revenue Share (%), by Product 2024 & 2032
- Figure 78: South Africa MEA Diabetes Treatment Market Volume Share (%), by Product 2024 & 2032
- Figure 79: South Africa MEA Diabetes Treatment Market Revenue (Million), by Geography 2024 & 2032
- Figure 80: South Africa MEA Diabetes Treatment Market Volume (K Unit), by Geography 2024 & 2032
- Figure 81: South Africa MEA Diabetes Treatment Market Revenue Share (%), by Geography 2024 & 2032
- Figure 82: South Africa MEA Diabetes Treatment Market Volume Share (%), by Geography 2024 & 2032
- Figure 83: South Africa MEA Diabetes Treatment Market Revenue (Million), by Country 2024 & 2032
- Figure 84: South Africa MEA Diabetes Treatment Market Volume (K Unit), by Country 2024 & 2032
- Figure 85: South Africa MEA Diabetes Treatment Market Revenue Share (%), by Country 2024 & 2032
- Figure 86: South Africa MEA Diabetes Treatment Market Volume Share (%), by Country 2024 & 2032
- Figure 87: Rest of Middle East and Africa MEA Diabetes Treatment Market Revenue (Million), by Product 2024 & 2032
- Figure 88: Rest of Middle East and Africa MEA Diabetes Treatment Market Volume (K Unit), by Product 2024 & 2032
- Figure 89: Rest of Middle East and Africa MEA Diabetes Treatment Market Revenue Share (%), by Product 2024 & 2032
- Figure 90: Rest of Middle East and Africa MEA Diabetes Treatment Market Volume Share (%), by Product 2024 & 2032
- Figure 91: Rest of Middle East and Africa MEA Diabetes Treatment Market Revenue (Million), by Geography 2024 & 2032
- Figure 92: Rest of Middle East and Africa MEA Diabetes Treatment Market Volume (K Unit), by Geography 2024 & 2032
- Figure 93: Rest of Middle East and Africa MEA Diabetes Treatment Market Revenue Share (%), by Geography 2024 & 2032
- Figure 94: Rest of Middle East and Africa MEA Diabetes Treatment Market Volume Share (%), by Geography 2024 & 2032
- Figure 95: Rest of Middle East and Africa MEA Diabetes Treatment Market Revenue (Million), by Country 2024 & 2032
- Figure 96: Rest of Middle East and Africa MEA Diabetes Treatment Market Volume (K Unit), by Country 2024 & 2032
- Figure 97: Rest of Middle East and Africa MEA Diabetes Treatment Market Revenue Share (%), by Country 2024 & 2032
- Figure 98: Rest of Middle East and Africa MEA Diabetes Treatment Market Volume Share (%), by Country 2024 & 2032
List of Tables
- Table 1: Global MEA Diabetes Treatment Market Revenue Million Forecast, by Region 2019 & 2032
- Table 2: Global MEA Diabetes Treatment Market Volume K Unit Forecast, by Region 2019 & 2032
- Table 3: Global MEA Diabetes Treatment Market Revenue Million Forecast, by Product 2019 & 2032
- Table 4: Global MEA Diabetes Treatment Market Volume K Unit Forecast, by Product 2019 & 2032
- Table 5: Global MEA Diabetes Treatment Market Revenue Million Forecast, by Geography 2019 & 2032
- Table 6: Global MEA Diabetes Treatment Market Volume K Unit Forecast, by Geography 2019 & 2032
- Table 7: Global MEA Diabetes Treatment Market Revenue Million Forecast, by Region 2019 & 2032
- Table 8: Global MEA Diabetes Treatment Market Volume K Unit Forecast, by Region 2019 & 2032
- Table 9: Global MEA Diabetes Treatment Market Revenue Million Forecast, by Country 2019 & 2032
- Table 10: Global MEA Diabetes Treatment Market Volume K Unit Forecast, by Country 2019 & 2032
- Table 11: United States MEA Diabetes Treatment Market Revenue (Million) Forecast, by Application 2019 & 2032
- Table 12: United States MEA Diabetes Treatment Market Volume (K Unit) Forecast, by Application 2019 & 2032
- Table 13: Canada MEA Diabetes Treatment Market Revenue (Million) Forecast, by Application 2019 & 2032
- Table 14: Canada MEA Diabetes Treatment Market Volume (K Unit) Forecast, by Application 2019 & 2032
- Table 15: Mexico MEA Diabetes Treatment Market Revenue (Million) Forecast, by Application 2019 & 2032
- Table 16: Mexico MEA Diabetes Treatment Market Volume (K Unit) Forecast, by Application 2019 & 2032
- Table 17: Global MEA Diabetes Treatment Market Revenue Million Forecast, by Country 2019 & 2032
- Table 18: Global MEA Diabetes Treatment Market Volume K Unit Forecast, by Country 2019 & 2032
- Table 19: Germany MEA Diabetes Treatment Market Revenue (Million) Forecast, by Application 2019 & 2032
- Table 20: Germany MEA Diabetes Treatment Market Volume (K Unit) Forecast, by Application 2019 & 2032
- Table 21: United Kingdom MEA Diabetes Treatment Market Revenue (Million) Forecast, by Application 2019 & 2032
- Table 22: United Kingdom MEA Diabetes Treatment Market Volume (K Unit) Forecast, by Application 2019 & 2032
- Table 23: France MEA Diabetes Treatment Market Revenue (Million) Forecast, by Application 2019 & 2032
- Table 24: France MEA Diabetes Treatment Market Volume (K Unit) Forecast, by Application 2019 & 2032
- Table 25: Spain MEA Diabetes Treatment Market Revenue (Million) Forecast, by Application 2019 & 2032
- Table 26: Spain MEA Diabetes Treatment Market Volume (K Unit) Forecast, by Application 2019 & 2032
- Table 27: Italy MEA Diabetes Treatment Market Revenue (Million) Forecast, by Application 2019 & 2032
- Table 28: Italy MEA Diabetes Treatment Market Volume (K Unit) Forecast, by Application 2019 & 2032
- Table 29: Spain MEA Diabetes Treatment Market Revenue (Million) Forecast, by Application 2019 & 2032
- Table 30: Spain MEA Diabetes Treatment Market Volume (K Unit) Forecast, by Application 2019 & 2032
- Table 31: Belgium MEA Diabetes Treatment Market Revenue (Million) Forecast, by Application 2019 & 2032
- Table 32: Belgium MEA Diabetes Treatment Market Volume (K Unit) Forecast, by Application 2019 & 2032
- Table 33: Netherland MEA Diabetes Treatment Market Revenue (Million) Forecast, by Application 2019 & 2032
- Table 34: Netherland MEA Diabetes Treatment Market Volume (K Unit) Forecast, by Application 2019 & 2032
- Table 35: Nordics MEA Diabetes Treatment Market Revenue (Million) Forecast, by Application 2019 & 2032
- Table 36: Nordics MEA Diabetes Treatment Market Volume (K Unit) Forecast, by Application 2019 & 2032
- Table 37: Rest of Europe MEA Diabetes Treatment Market Revenue (Million) Forecast, by Application 2019 & 2032
- Table 38: Rest of Europe MEA Diabetes Treatment Market Volume (K Unit) Forecast, by Application 2019 & 2032
- Table 39: Global MEA Diabetes Treatment Market Revenue Million Forecast, by Country 2019 & 2032
- Table 40: Global MEA Diabetes Treatment Market Volume K Unit Forecast, by Country 2019 & 2032
- Table 41: China MEA Diabetes Treatment Market Revenue (Million) Forecast, by Application 2019 & 2032
- Table 42: China MEA Diabetes Treatment Market Volume (K Unit) Forecast, by Application 2019 & 2032
- Table 43: Japan MEA Diabetes Treatment Market Revenue (Million) Forecast, by Application 2019 & 2032
- Table 44: Japan MEA Diabetes Treatment Market Volume (K Unit) Forecast, by Application 2019 & 2032
- Table 45: India MEA Diabetes Treatment Market Revenue (Million) Forecast, by Application 2019 & 2032
- Table 46: India MEA Diabetes Treatment Market Volume (K Unit) Forecast, by Application 2019 & 2032
- Table 47: South Korea MEA Diabetes Treatment Market Revenue (Million) Forecast, by Application 2019 & 2032
- Table 48: South Korea MEA Diabetes Treatment Market Volume (K Unit) Forecast, by Application 2019 & 2032
- Table 49: Southeast Asia MEA Diabetes Treatment Market Revenue (Million) Forecast, by Application 2019 & 2032
- Table 50: Southeast Asia MEA Diabetes Treatment Market Volume (K Unit) Forecast, by Application 2019 & 2032
- Table 51: Australia MEA Diabetes Treatment Market Revenue (Million) Forecast, by Application 2019 & 2032
- Table 52: Australia MEA Diabetes Treatment Market Volume (K Unit) Forecast, by Application 2019 & 2032
- Table 53: Indonesia MEA Diabetes Treatment Market Revenue (Million) Forecast, by Application 2019 & 2032
- Table 54: Indonesia MEA Diabetes Treatment Market Volume (K Unit) Forecast, by Application 2019 & 2032
- Table 55: Phillipes MEA Diabetes Treatment Market Revenue (Million) Forecast, by Application 2019 & 2032
- Table 56: Phillipes MEA Diabetes Treatment Market Volume (K Unit) Forecast, by Application 2019 & 2032
- Table 57: Singapore MEA Diabetes Treatment Market Revenue (Million) Forecast, by Application 2019 & 2032
- Table 58: Singapore MEA Diabetes Treatment Market Volume (K Unit) Forecast, by Application 2019 & 2032
- Table 59: Thailandc MEA Diabetes Treatment Market Revenue (Million) Forecast, by Application 2019 & 2032
- Table 60: Thailandc MEA Diabetes Treatment Market Volume (K Unit) Forecast, by Application 2019 & 2032
- Table 61: Rest of Asia Pacific MEA Diabetes Treatment Market Revenue (Million) Forecast, by Application 2019 & 2032
- Table 62: Rest of Asia Pacific MEA Diabetes Treatment Market Volume (K Unit) Forecast, by Application 2019 & 2032
- Table 63: Global MEA Diabetes Treatment Market Revenue Million Forecast, by Country 2019 & 2032
- Table 64: Global MEA Diabetes Treatment Market Volume K Unit Forecast, by Country 2019 & 2032
- Table 65: Brazil MEA Diabetes Treatment Market Revenue (Million) Forecast, by Application 2019 & 2032
- Table 66: Brazil MEA Diabetes Treatment Market Volume (K Unit) Forecast, by Application 2019 & 2032
- Table 67: Argentina MEA Diabetes Treatment Market Revenue (Million) Forecast, by Application 2019 & 2032
- Table 68: Argentina MEA Diabetes Treatment Market Volume (K Unit) Forecast, by Application 2019 & 2032
- Table 69: Peru MEA Diabetes Treatment Market Revenue (Million) Forecast, by Application 2019 & 2032
- Table 70: Peru MEA Diabetes Treatment Market Volume (K Unit) Forecast, by Application 2019 & 2032
- Table 71: Chile MEA Diabetes Treatment Market Revenue (Million) Forecast, by Application 2019 & 2032
- Table 72: Chile MEA Diabetes Treatment Market Volume (K Unit) Forecast, by Application 2019 & 2032
- Table 73: Colombia MEA Diabetes Treatment Market Revenue (Million) Forecast, by Application 2019 & 2032
- Table 74: Colombia MEA Diabetes Treatment Market Volume (K Unit) Forecast, by Application 2019 & 2032
- Table 75: Ecuador MEA Diabetes Treatment Market Revenue (Million) Forecast, by Application 2019 & 2032
- Table 76: Ecuador MEA Diabetes Treatment Market Volume (K Unit) Forecast, by Application 2019 & 2032
- Table 77: Venezuela MEA Diabetes Treatment Market Revenue (Million) Forecast, by Application 2019 & 2032
- Table 78: Venezuela MEA Diabetes Treatment Market Volume (K Unit) Forecast, by Application 2019 & 2032
- Table 79: Rest of South America MEA Diabetes Treatment Market Revenue (Million) Forecast, by Application 2019 & 2032
- Table 80: Rest of South America MEA Diabetes Treatment Market Volume (K Unit) Forecast, by Application 2019 & 2032
- Table 81: Global MEA Diabetes Treatment Market Revenue Million Forecast, by Country 2019 & 2032
- Table 82: Global MEA Diabetes Treatment Market Volume K Unit Forecast, by Country 2019 & 2032
- Table 83: United States MEA Diabetes Treatment Market Revenue (Million) Forecast, by Application 2019 & 2032
- Table 84: United States MEA Diabetes Treatment Market Volume (K Unit) Forecast, by Application 2019 & 2032
- Table 85: Canada MEA Diabetes Treatment Market Revenue (Million) Forecast, by Application 2019 & 2032
- Table 86: Canada MEA Diabetes Treatment Market Volume (K Unit) Forecast, by Application 2019 & 2032
- Table 87: Mexico MEA Diabetes Treatment Market Revenue (Million) Forecast, by Application 2019 & 2032
- Table 88: Mexico MEA Diabetes Treatment Market Volume (K Unit) Forecast, by Application 2019 & 2032
- Table 89: Global MEA Diabetes Treatment Market Revenue Million Forecast, by Country 2019 & 2032
- Table 90: Global MEA Diabetes Treatment Market Volume K Unit Forecast, by Country 2019 & 2032
- Table 91: United Arab Emirates MEA Diabetes Treatment Market Revenue (Million) Forecast, by Application 2019 & 2032
- Table 92: United Arab Emirates MEA Diabetes Treatment Market Volume (K Unit) Forecast, by Application 2019 & 2032
- Table 93: Saudi Arabia MEA Diabetes Treatment Market Revenue (Million) Forecast, by Application 2019 & 2032
- Table 94: Saudi Arabia MEA Diabetes Treatment Market Volume (K Unit) Forecast, by Application 2019 & 2032
- Table 95: South Africa MEA Diabetes Treatment Market Revenue (Million) Forecast, by Application 2019 & 2032
- Table 96: South Africa MEA Diabetes Treatment Market Volume (K Unit) Forecast, by Application 2019 & 2032
- Table 97: Rest of Middle East and Africa MEA Diabetes Treatment Market Revenue (Million) Forecast, by Application 2019 & 2032
- Table 98: Rest of Middle East and Africa MEA Diabetes Treatment Market Volume (K Unit) Forecast, by Application 2019 & 2032
- Table 99: Global MEA Diabetes Treatment Market Revenue Million Forecast, by Product 2019 & 2032
- Table 100: Global MEA Diabetes Treatment Market Volume K Unit Forecast, by Product 2019 & 2032
- Table 101: Global MEA Diabetes Treatment Market Revenue Million Forecast, by Geography 2019 & 2032
- Table 102: Global MEA Diabetes Treatment Market Volume K Unit Forecast, by Geography 2019 & 2032
- Table 103: Global MEA Diabetes Treatment Market Revenue Million Forecast, by Country 2019 & 2032
- Table 104: Global MEA Diabetes Treatment Market Volume K Unit Forecast, by Country 2019 & 2032
- Table 105: Global MEA Diabetes Treatment Market Revenue Million Forecast, by Product 2019 & 2032
- Table 106: Global MEA Diabetes Treatment Market Volume K Unit Forecast, by Product 2019 & 2032
- Table 107: Global MEA Diabetes Treatment Market Revenue Million Forecast, by Geography 2019 & 2032
- Table 108: Global MEA Diabetes Treatment Market Volume K Unit Forecast, by Geography 2019 & 2032
- Table 109: Global MEA Diabetes Treatment Market Revenue Million Forecast, by Country 2019 & 2032
- Table 110: Global MEA Diabetes Treatment Market Volume K Unit Forecast, by Country 2019 & 2032
- Table 111: Global MEA Diabetes Treatment Market Revenue Million Forecast, by Product 2019 & 2032
- Table 112: Global MEA Diabetes Treatment Market Volume K Unit Forecast, by Product 2019 & 2032
- Table 113: Global MEA Diabetes Treatment Market Revenue Million Forecast, by Geography 2019 & 2032
- Table 114: Global MEA Diabetes Treatment Market Volume K Unit Forecast, by Geography 2019 & 2032
- Table 115: Global MEA Diabetes Treatment Market Revenue Million Forecast, by Country 2019 & 2032
- Table 116: Global MEA Diabetes Treatment Market Volume K Unit Forecast, by Country 2019 & 2032
- Table 117: Global MEA Diabetes Treatment Market Revenue Million Forecast, by Product 2019 & 2032
- Table 118: Global MEA Diabetes Treatment Market Volume K Unit Forecast, by Product 2019 & 2032
- Table 119: Global MEA Diabetes Treatment Market Revenue Million Forecast, by Geography 2019 & 2032
- Table 120: Global MEA Diabetes Treatment Market Volume K Unit Forecast, by Geography 2019 & 2032
- Table 121: Global MEA Diabetes Treatment Market Revenue Million Forecast, by Country 2019 & 2032
- Table 122: Global MEA Diabetes Treatment Market Volume K Unit Forecast, by Country 2019 & 2032
- Table 123: Global MEA Diabetes Treatment Market Revenue Million Forecast, by Product 2019 & 2032
- Table 124: Global MEA Diabetes Treatment Market Volume K Unit Forecast, by Product 2019 & 2032
- Table 125: Global MEA Diabetes Treatment Market Revenue Million Forecast, by Geography 2019 & 2032
- Table 126: Global MEA Diabetes Treatment Market Volume K Unit Forecast, by Geography 2019 & 2032
- Table 127: Global MEA Diabetes Treatment Market Revenue Million Forecast, by Country 2019 & 2032
- Table 128: Global MEA Diabetes Treatment Market Volume K Unit Forecast, by Country 2019 & 2032
- Table 129: Global MEA Diabetes Treatment Market Revenue Million Forecast, by Product 2019 & 2032
- Table 130: Global MEA Diabetes Treatment Market Volume K Unit Forecast, by Product 2019 & 2032
- Table 131: Global MEA Diabetes Treatment Market Revenue Million Forecast, by Geography 2019 & 2032
- Table 132: Global MEA Diabetes Treatment Market Volume K Unit Forecast, by Geography 2019 & 2032
- Table 133: Global MEA Diabetes Treatment Market Revenue Million Forecast, by Country 2019 & 2032
- Table 134: Global MEA Diabetes Treatment Market Volume K Unit Forecast, by Country 2019 & 2032
Frequently Asked Questions
1. What is the projected Compound Annual Growth Rate (CAGR) of the MEA Diabetes Treatment Market?
The projected CAGR is approximately 3.78%.
2. Which companies are prominent players in the MEA Diabetes Treatment Market?
Key companies in the market include Pfizer, Novo Nordisk AS, SEDICO, Julphar, Wockhardt, Eli Lilly, Exir, Eli Lilly and Company, Sanofi Aventis, Biocon, Novo Nordisk, Other Company Share Analyse.
3. What are the main segments of the MEA Diabetes Treatment Market?
The market segments include Product, Geography.
4. Can you provide details about the market size?
The market size is estimated to be USD 1.62 Million as of 2022.
5. What are some drivers contributing to market growth?
; The Rise in Global Prevalence of Cases of Obesity due to Modern Sedentary Lifestyles; Rise in Awareness and Disposable Income in Developed Economies.
6. What are the notable trends driving market growth?
Biosimilar Insulin Segment Holds Highest Market Share in Middle-East and Africa Human Insulin Market..
7. Are there any restraints impacting market growth?
; Highly Cost of Branded Products in Emerging Countries; Severe Adverse Associated with Medication Including Seizures. Suicidal Attempts and Even Death; Adoption of Traditional Yoga and Herbal Products.
8. Can you provide examples of recent developments in the market?
February 2023: South Korea-based EOFlow, a provider of wearable drug delivery solutions, received certification from the United Arab Emirate (UAE) Ministry of Health and Prevention (MOHAP) to commercialize its wearable insulin pump 'EOPatch' and its controller 'ADM' as well as its smartphone app 'Narsha'. EOFlow said that this UAE launch marks the first entry of EOPatches in the Middle East. The UAE is EOFlow's second overseas sales region after Europe. It was expected to serve as a bridgehead for exporting wearable insulin pump solutions to Middle East and North Africa (MENA) countries.
9. What pricing options are available for accessing the report?
Pricing options include single-user, multi-user, and enterprise licenses priced at USD 4750, USD 5250, and USD 8750 respectively.
10. Is the market size provided in terms of value or volume?
The market size is provided in terms of value, measured in Million and volume, measured in K Unit.
11. Are there any specific market keywords associated with the report?
Yes, the market keyword associated with the report is "MEA Diabetes Treatment Market," which aids in identifying and referencing the specific market segment covered.
12. How do I determine which pricing option suits my needs best?
The pricing options vary based on user requirements and access needs. Individual users may opt for single-user licenses, while businesses requiring broader access may choose multi-user or enterprise licenses for cost-effective access to the report.
13. Are there any additional resources or data provided in the MEA Diabetes Treatment Market report?
While the report offers comprehensive insights, it's advisable to review the specific contents or supplementary materials provided to ascertain if additional resources or data are available.
14. How can I stay updated on further developments or reports in the MEA Diabetes Treatment Market?
To stay informed about further developments, trends, and reports in the MEA Diabetes Treatment Market, consider subscribing to industry newsletters, following relevant companies and organizations, or regularly checking reputable industry news sources and publications.
Methodology
Step 1 - Identification of Relevant Samples Size from Population Database


Step 2 - Approaches for Defining Global Market Size (Value, Volume* & Price*)

Note*: In applicable scenarios
Step 3 - Data Sources
Primary Research
- Web Analytics
- Survey Reports
- Research Institute
- Latest Research Reports
- Opinion Leaders
Secondary Research
- Annual Reports
- White Paper
- Latest Press Release
- Industry Association
- Paid Database
- Investor Presentations

Step 4 - Data Triangulation
Involves using different sources of information in order to increase the validity of a study
These sources are likely to be stakeholders in a program - participants, other researchers, program staff, other community members, and so on.
Then we put all data in single framework & apply various statistical tools to find out the dynamic on the market.
During the analysis stage, feedback from the stakeholder groups would be compared to determine areas of agreement as well as areas of divergence


