
Key Insights
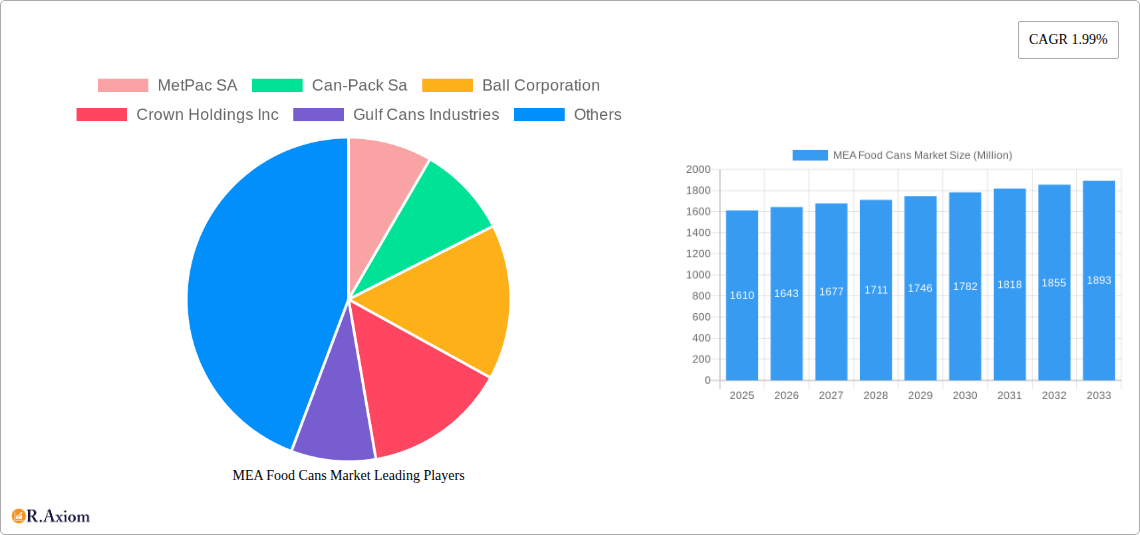
The Middle East and Africa (MEA) food cans market, valued at $1.61 billion in 2025, is projected to experience steady growth, driven by several key factors. The rising demand for convenient ready-to-eat meals and processed foods, particularly in urban areas, is a significant catalyst. Increasing consumer preference for extended shelf-life products and the growing popularity of pet food are further boosting market expansion. The region's burgeoning food processing industry, coupled with investments in advanced can manufacturing technologies, contributes to the market's positive outlook. While aluminum cans dominate the material segment due to their lightweight nature and recyclability, steel cans maintain a presence, catering to specific product requirements. Growth is expected across diverse applications, including ready meals, fish and seafood, fruits and vegetables, and pet food. Saudi Arabia and the UAE represent the largest national markets, reflecting their higher levels of disposable income and established food processing sectors. South Africa's growing economy also contributes significantly to regional demand. However, fluctuating raw material prices and potential environmental concerns related to can disposal could present challenges to market expansion in the coming years. The market’s 1.99% CAGR suggests a moderate, yet sustainable growth trajectory for the forecast period (2025-2033). This growth will be fueled by continued urbanization, rising disposable incomes, and increasing consumer awareness of food safety and preservation. Specific market segmentation will be influenced by local dietary habits and infrastructure development within individual countries across the MEA region.
The forecast period (2025-2033) will witness a continuation of these trends, with a projected expansion influenced by factors such as population growth, evolving consumer preferences, and infrastructural developments within the food processing and packaging industries of MEA. The market segmentation by application (ready meals, powder products, etc.) and country (Saudi Arabia, UAE, South Africa, etc.) will remain relevant, with possible shifts reflecting changing consumer behaviours and economic conditions. The competitive landscape, encompassing both regional and international players, is expected to remain dynamic, with companies focusing on innovation, product diversification, and efficient supply chain management. Sustainable practices and environmentally friendly packaging solutions will become increasingly important in shaping the long-term growth of this market.
MEA Food Cans Market: A Comprehensive Report (2019-2033)
This in-depth report provides a comprehensive analysis of the Middle East and Africa (MEA) food cans market, offering valuable insights for industry stakeholders, investors, and strategic decision-makers. The study covers the period from 2019 to 2033, with a focus on the forecast period 2025-2033 and a base year of 2025. The report leverages rigorous research methodologies to deliver actionable intelligence on market size, segmentation, growth drivers, challenges, and emerging opportunities. The total market value in 2025 is estimated at xx Million. Expect significant growth throughout the forecast period.
MEA Food Cans Market Concentration & Innovation
This section analyzes the competitive landscape of the MEA food cans market, exploring market concentration, innovation drivers, regulatory frameworks, product substitutes, end-user trends, and mergers and acquisitions (M&A) activities.
The MEA food cans market exhibits a moderately concentrated structure, with key players like Ball Corporation and Crown Holdings Inc holding significant market share. However, several regional players also contribute substantially, leading to a dynamic competitive environment. Market share data for 2025 suggests Ball Corporation holds approximately xx% of the market, followed by Crown Holdings Inc at xx%, while MetPac SA, Can-Pack SA and other regional players share the remaining xx%.
Innovation Drivers:
- Growing demand for convenient and shelf-stable food products.
- Technological advancements in can manufacturing and materials.
- Increased focus on sustainable and eco-friendly packaging solutions.
Regulatory Frameworks:
- Food safety regulations influence material selection and manufacturing processes.
- Environmental regulations drive adoption of recyclable and sustainable cans.
Product Substitutes:
- Flexible packaging materials like pouches and plastic containers pose competition.
- However, metal cans maintain an edge due to their superior barrier properties and recyclability.
End-User Trends:
- Rising disposable incomes and changing lifestyles contribute to greater demand for canned foods.
- Consumer preference for healthier and more convenient food options influences product development.
M&A Activities:
While precise M&A deal values are unavailable for the period studied, there is evidence of strategic partnerships and collaborations aimed at expanding production capacity and market reach. The frequency of these activities indicates a strong level of industry consolidation.
MEA Food Cans Market Industry Trends & Insights
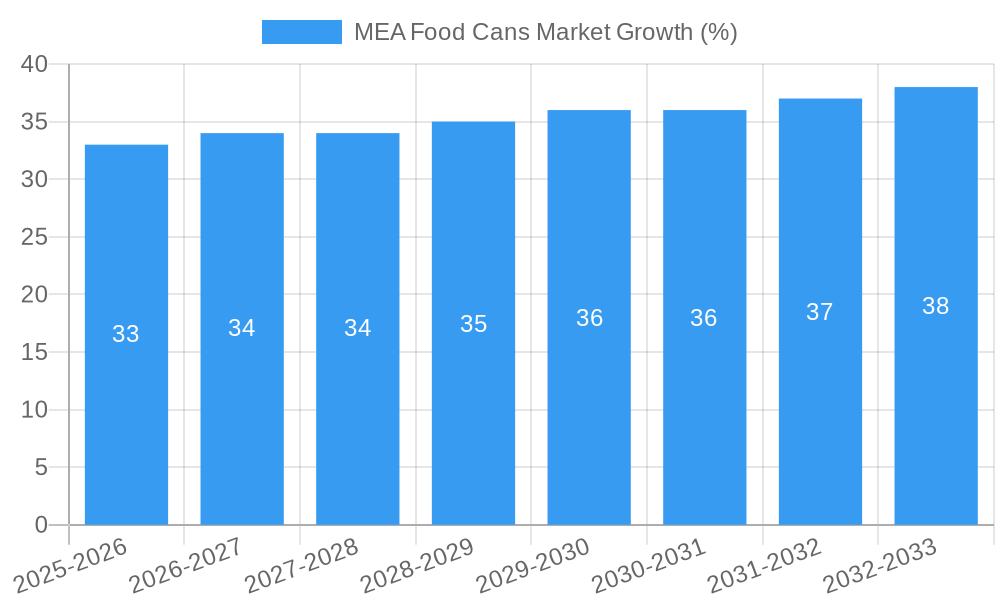
This section delves into the key trends shaping the MEA food cans market's trajectory. The market is expected to register a Compound Annual Growth Rate (CAGR) of xx% during the forecast period (2025-2033). Market penetration, currently at approximately xx% in key segments, is anticipated to increase significantly, driven by several factors.
Market growth is primarily fueled by the rising popularity of ready-to-eat meals, expanding retail infrastructure, and increasing urbanization across the MEA region. Technological advancements, including improved can manufacturing techniques and the introduction of innovative materials, further enhance market growth. Consumer preferences for convenient, shelf-stable food products are also driving demand, particularly in urban areas with busy lifestyles. Furthermore, the food processing sector is investing heavily in canned goods for efficient preservation, storage, and transportation of diverse products.
Competitive dynamics are largely influenced by price competitiveness, product differentiation, and brand loyalty. Major players are actively investing in research and development to improve product quality and expand their product offerings.
Dominant Markets & Segments in MEA Food Cans Market
This section highlights the leading regions, countries, and segments within the MEA food cans market.
By Country:
Saudi Arabia: Holds the largest market share driven by strong economic growth, expanding food processing industry, and high consumer demand for canned goods. Key drivers include robust infrastructure, favorable government policies supporting the food processing sector, and a growing population with increasing disposable income.
United Arab Emirates: The UAE exhibits strong growth due to its thriving tourism sector, substantial food imports, and preference for convenient food options. Factors such as robust logistics and supply chain networks, high standards of living, and a cosmopolitan population contribute to market expansion.
South Africa: South Africa presents a substantial market for canned goods, supported by its established food processing industry and significant agricultural production. Government initiatives promoting food security and infrastructure development further boost the market.
By Application:
Ready Meals: The ready-meals segment is experiencing the highest growth, driven by busy lifestyles and the increasing preference for convenient and affordable meal solutions.
Fruits and Vegetables: Demand for canned fruits and vegetables remains significant, driven by the desire for long shelf-life and preservation of nutritional value.
Fish and Seafood: The canned fish and seafood sector is another significant segment, driven by the availability of fresh catches and growing demand for protein-rich foods.
By Material Type:
Aluminum Cans: Aluminum cans are dominant due to their lightweight nature, recyclability, and excellent barrier properties.
Steel Cans: Steel cans hold a substantial market share, particularly in the food processing industry, owing to their durability and cost-effectiveness.
MEA Food Cans Market Product Developments
Recent product innovations focus on improved can designs for enhanced functionality and sustainability. This includes lightweighting for cost-effective transportation and the use of recyclable materials to meet environmental concerns. Advancements in printing technology allow for attractive and informative labels, enhancing brand appeal. The introduction of innovative can sizes and shapes caters to evolving consumer needs and product offerings.
Report Scope & Segmentation Analysis
This report provides a detailed analysis of the MEA food cans market segmented by application (ready meals, powder products, fish and seafood, fruits and vegetables, processed food, pet food, other applications), country (Saudi Arabia, United Arab Emirates, South Africa), and material type (aluminum cans, steel cans). Growth projections for each segment are provided, highlighting market sizes and competitive dynamics for each segment based on factors already addressed in previous sections.
Key Drivers of MEA Food Cans Market Growth
The MEA food cans market growth is driven by rising disposable incomes, increasing urbanization, growing demand for convenient and shelf-stable food, and technological advancements in can manufacturing. Government initiatives supporting the food processing industry and favorable economic policies also play a crucial role. The growing tourism industry and related increase in food service also drive the market.
Challenges in the MEA Food Cans Market Sector
Challenges include fluctuating raw material prices, stringent food safety regulations, and intense competition among manufacturers. Supply chain disruptions and logistical complexities can also affect market growth. The market also faces the challenge of managing waste and promoting the recycling of aluminum and steel cans. These challenges, if not effectively mitigated, could limit growth potential.
Emerging Opportunities in MEA Food Cans Market
Emerging opportunities lie in the growing demand for sustainable and eco-friendly packaging solutions, the expansion of e-commerce, and the increasing popularity of ready-to-eat meals and convenient food products. Innovations in can design, material usage, and printing technologies present further opportunities for growth.
Leading Players in the MEA Food Cans Market Market
- MetPac SA
- Can-Pack SA
- Ball Corporation
- Crown Holdings Inc
- Gulf Cans Industries
- Sapin UAE
- Arabian Can Industr
- Middle East Metal Can LLC (Trinity Holdings)
- Emirates Metallic Industries Company Limited (EMIC)
- Amopack Can Manufacturers
Key Developments in MEA Food Cans Market Industry
June 2023: Ball Corporation showcased its latest aluminum can and bottle portfolio at the BevNET Live Summer 2023, highlighting new "slim" can capabilities and supply locations. This indicates a focus on meeting diverse consumer preferences and expanding production capacity.
July 2022: Launch of Oyetty Meals, a West African ready meals brand, driving demand for food cans within the ready-meal segment. This signifies the expanding market for convenient and culturally relevant food products.
Strategic Outlook for MEA Food Cans Market Market
The MEA food cans market presents significant growth potential, driven by several factors including sustained economic growth, urbanization, changing consumer lifestyles, and increasing demand for convenient and shelf-stable food options. Strategic investments in sustainable packaging solutions, technological innovation, and supply chain optimization will be crucial for success in this dynamic market. The market is expected to continue its expansion, presenting attractive opportunities for both established players and new entrants.
MEA Food Cans Market Segmentation
-
1. Material Type
- 1.1. Aluminium Cans
- 1.2. Steel Cans
-
2. Application
- 2.1. Ready Meals
- 2.2. Powder Products
- 2.3. Fish and Seafood
- 2.4. Fruits and Vegetables
- 2.5. Processed Food
- 2.6. Pet Food
- 2.7. Other Applications
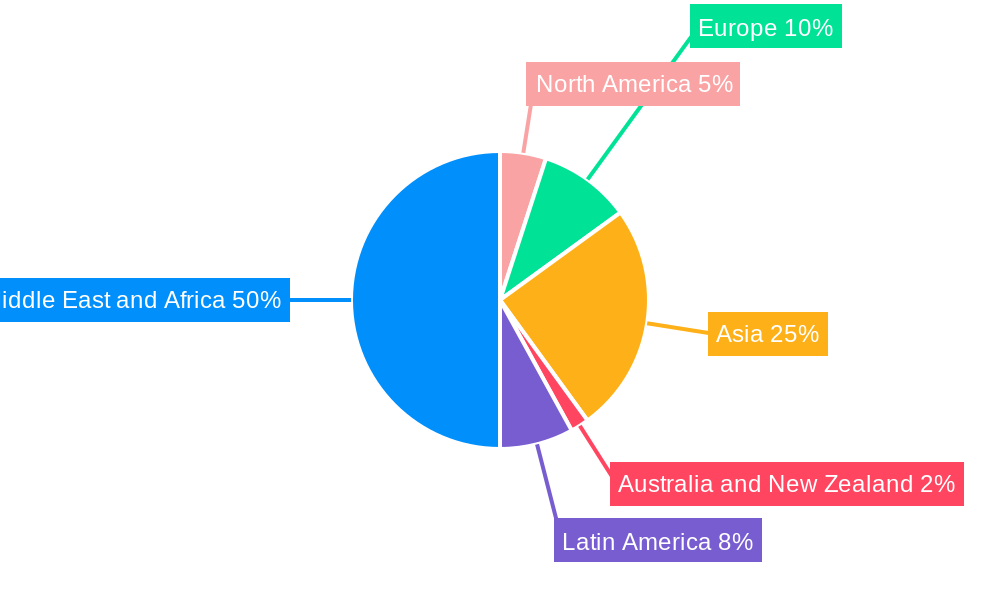
MEA Food Cans Market Segmentation By Geography
-
1. North America
- 1.1. United States
- 1.2. Canada
- 1.3. Mexico
-
2. South America
- 2.1. Brazil
- 2.2. Argentina
- 2.3. Rest of South America
-
3. Europe
- 3.1. United Kingdom
- 3.2. Germany
- 3.3. France
- 3.4. Italy
- 3.5. Spain
- 3.6. Russia
- 3.7. Benelux
- 3.8. Nordics
- 3.9. Rest of Europe
-
4. Middle East & Africa
- 4.1. Turkey
- 4.2. Israel
- 4.3. GCC
- 4.4. North Africa
- 4.5. South Africa
- 4.6. Rest of Middle East & Africa
-
5. Asia Pacific
- 5.1. China
- 5.2. India
- 5.3. Japan
- 5.4. South Korea
- 5.5. ASEAN
- 5.6. Oceania
- 5.7. Rest of Asia Pacific
MEA Food Cans Market REPORT HIGHLIGHTS
| Aspects | Details |
|---|---|
| Study Period | 2019-2033 |
| Base Year | 2024 |
| Estimated Year | 2025 |
| Forecast Period | 2025-2033 |
| Historical Period | 2019-2024 |
| Growth Rate | CAGR of 1.99% from 2019-2033 |
| Segmentation |
|
Table of Contents
- 1. Introduction
- 1.1. Research Scope
- 1.2. Market Segmentation
- 1.3. Research Methodology
- 1.4. Definitions and Assumptions
- 2. Executive Summary
- 2.1. Introduction
- 3. Market Dynamics
- 3.1. Introduction
- 3.2. Market Drivers
- 3.2.1. Rising Disposable Income and Urbanization; Growth in E-commerce Industry is Expected to Drive the Market
- 3.3. Market Restrains
- 3.3.1. Lower Costs of Substitute Products Might Affect the Market
- 3.4. Market Trends
- 3.4.1. Aluminum Cans Expected to Gain Largest Market in the Region
- 4. Market Factor Analysis
- 4.1. Porters Five Forces
- 4.2. Supply/Value Chain
- 4.3. PESTEL analysis
- 4.4. Market Entropy
- 4.5. Patent/Trademark Analysis
- 5. Global MEA Food Cans Market Analysis, Insights and Forecast, 2019-2031
- 5.1. Market Analysis, Insights and Forecast - by Material Type
- 5.1.1. Aluminium Cans
- 5.1.2. Steel Cans
- 5.2. Market Analysis, Insights and Forecast - by Application
- 5.2.1. Ready Meals
- 5.2.2. Powder Products
- 5.2.3. Fish and Seafood
- 5.2.4. Fruits and Vegetables
- 5.2.5. Processed Food
- 5.2.6. Pet Food
- 5.2.7. Other Applications
- 5.3. Market Analysis, Insights and Forecast - by Region
- 5.3.1. North America
- 5.3.2. South America
- 5.3.3. Europe
- 5.3.4. Middle East & Africa
- 5.3.5. Asia Pacific
- 5.1. Market Analysis, Insights and Forecast - by Material Type
- 6. North America MEA Food Cans Market Analysis, Insights and Forecast, 2019-2031
- 6.1. Market Analysis, Insights and Forecast - by Material Type
- 6.1.1. Aluminium Cans
- 6.1.2. Steel Cans
- 6.2. Market Analysis, Insights and Forecast - by Application
- 6.2.1. Ready Meals
- 6.2.2. Powder Products
- 6.2.3. Fish and Seafood
- 6.2.4. Fruits and Vegetables
- 6.2.5. Processed Food
- 6.2.6. Pet Food
- 6.2.7. Other Applications
- 6.1. Market Analysis, Insights and Forecast - by Material Type
- 7. South America MEA Food Cans Market Analysis, Insights and Forecast, 2019-2031
- 7.1. Market Analysis, Insights and Forecast - by Material Type
- 7.1.1. Aluminium Cans
- 7.1.2. Steel Cans
- 7.2. Market Analysis, Insights and Forecast - by Application
- 7.2.1. Ready Meals
- 7.2.2. Powder Products
- 7.2.3. Fish and Seafood
- 7.2.4. Fruits and Vegetables
- 7.2.5. Processed Food
- 7.2.6. Pet Food
- 7.2.7. Other Applications
- 7.1. Market Analysis, Insights and Forecast - by Material Type
- 8. Europe MEA Food Cans Market Analysis, Insights and Forecast, 2019-2031
- 8.1. Market Analysis, Insights and Forecast - by Material Type
- 8.1.1. Aluminium Cans
- 8.1.2. Steel Cans
- 8.2. Market Analysis, Insights and Forecast - by Application
- 8.2.1. Ready Meals
- 8.2.2. Powder Products
- 8.2.3. Fish and Seafood
- 8.2.4. Fruits and Vegetables
- 8.2.5. Processed Food
- 8.2.6. Pet Food
- 8.2.7. Other Applications
- 8.1. Market Analysis, Insights and Forecast - by Material Type
- 9. Middle East & Africa MEA Food Cans Market Analysis, Insights and Forecast, 2019-2031
- 9.1. Market Analysis, Insights and Forecast - by Material Type
- 9.1.1. Aluminium Cans
- 9.1.2. Steel Cans
- 9.2. Market Analysis, Insights and Forecast - by Application
- 9.2.1. Ready Meals
- 9.2.2. Powder Products
- 9.2.3. Fish and Seafood
- 9.2.4. Fruits and Vegetables
- 9.2.5. Processed Food
- 9.2.6. Pet Food
- 9.2.7. Other Applications
- 9.1. Market Analysis, Insights and Forecast - by Material Type
- 10. Asia Pacific MEA Food Cans Market Analysis, Insights and Forecast, 2019-2031
- 10.1. Market Analysis, Insights and Forecast - by Material Type
- 10.1.1. Aluminium Cans
- 10.1.2. Steel Cans
- 10.2. Market Analysis, Insights and Forecast - by Application
- 10.2.1. Ready Meals
- 10.2.2. Powder Products
- 10.2.3. Fish and Seafood
- 10.2.4. Fruits and Vegetables
- 10.2.5. Processed Food
- 10.2.6. Pet Food
- 10.2.7. Other Applications
- 10.1. Market Analysis, Insights and Forecast - by Material Type
- 11. North America MEA Food Cans Market Analysis, Insights and Forecast, 2019-2031
- 11.1. Market Analysis, Insights and Forecast - By Country/Sub-region
- 11.1.1.
- 12. Europe MEA Food Cans Market Analysis, Insights and Forecast, 2019-2031
- 12.1. Market Analysis, Insights and Forecast - By Country/Sub-region
- 12.1.1.
- 13. Asia MEA Food Cans Market Analysis, Insights and Forecast, 2019-2031
- 13.1. Market Analysis, Insights and Forecast - By Country/Sub-region
- 13.1.1.
- 14. Australia and New Zealand MEA Food Cans Market Analysis, Insights and Forecast, 2019-2031
- 14.1. Market Analysis, Insights and Forecast - By Country/Sub-region
- 14.1.1.
- 15. Latin America MEA Food Cans Market Analysis, Insights and Forecast, 2019-2031
- 15.1. Market Analysis, Insights and Forecast - By Country/Sub-region
- 15.1.1.
- 16. Middle East and Africa MEA Food Cans Market Analysis, Insights and Forecast, 2019-2031
- 16.1. Market Analysis, Insights and Forecast - By Country/Sub-region
- 16.1.1.
- 17. Competitive Analysis
- 17.1. Global Market Share Analysis 2024
- 17.2. Company Profiles
- 17.2.1 MetPac SA
- 17.2.1.1. Overview
- 17.2.1.2. Products
- 17.2.1.3. SWOT Analysis
- 17.2.1.4. Recent Developments
- 17.2.1.5. Financials (Based on Availability)
- 17.2.2 Can-Pack Sa
- 17.2.2.1. Overview
- 17.2.2.2. Products
- 17.2.2.3. SWOT Analysis
- 17.2.2.4. Recent Developments
- 17.2.2.5. Financials (Based on Availability)
- 17.2.3 Ball Corporation
- 17.2.3.1. Overview
- 17.2.3.2. Products
- 17.2.3.3. SWOT Analysis
- 17.2.3.4. Recent Developments
- 17.2.3.5. Financials (Based on Availability)
- 17.2.4 Crown Holdings Inc
- 17.2.4.1. Overview
- 17.2.4.2. Products
- 17.2.4.3. SWOT Analysis
- 17.2.4.4. Recent Developments
- 17.2.4.5. Financials (Based on Availability)
- 17.2.5 Gulf Cans Industries
- 17.2.5.1. Overview
- 17.2.5.2. Products
- 17.2.5.3. SWOT Analysis
- 17.2.5.4. Recent Developments
- 17.2.5.5. Financials (Based on Availability)
- 17.2.6 Sapin UAE
- 17.2.6.1. Overview
- 17.2.6.2. Products
- 17.2.6.3. SWOT Analysis
- 17.2.6.4. Recent Developments
- 17.2.6.5. Financials (Based on Availability)
- 17.2.7 Arabian Can Industr
- 17.2.7.1. Overview
- 17.2.7.2. Products
- 17.2.7.3. SWOT Analysis
- 17.2.7.4. Recent Developments
- 17.2.7.5. Financials (Based on Availability)
- 17.2.8 Middle East Metal Can LLC (Trinity Holdings)
- 17.2.8.1. Overview
- 17.2.8.2. Products
- 17.2.8.3. SWOT Analysis
- 17.2.8.4. Recent Developments
- 17.2.8.5. Financials (Based on Availability)
- 17.2.9 Emirates Metallic Industries Company Limited (EMIC)
- 17.2.9.1. Overview
- 17.2.9.2. Products
- 17.2.9.3. SWOT Analysis
- 17.2.9.4. Recent Developments
- 17.2.9.5. Financials (Based on Availability)
- 17.2.10 Amopack Can Manufacturers
- 17.2.10.1. Overview
- 17.2.10.2. Products
- 17.2.10.3. SWOT Analysis
- 17.2.10.4. Recent Developments
- 17.2.10.5. Financials (Based on Availability)
- 17.2.1 MetPac SA
List of Figures
- Figure 1: Global MEA Food Cans Market Revenue Breakdown (Million, %) by Region 2024 & 2032
- Figure 2: North America MEA Food Cans Market Revenue (Million), by Country 2024 & 2032
- Figure 3: North America MEA Food Cans Market Revenue Share (%), by Country 2024 & 2032
- Figure 4: Europe MEA Food Cans Market Revenue (Million), by Country 2024 & 2032
- Figure 5: Europe MEA Food Cans Market Revenue Share (%), by Country 2024 & 2032
- Figure 6: Asia MEA Food Cans Market Revenue (Million), by Country 2024 & 2032
- Figure 7: Asia MEA Food Cans Market Revenue Share (%), by Country 2024 & 2032
- Figure 8: Australia and New Zealand MEA Food Cans Market Revenue (Million), by Country 2024 & 2032
- Figure 9: Australia and New Zealand MEA Food Cans Market Revenue Share (%), by Country 2024 & 2032
- Figure 10: Latin America MEA Food Cans Market Revenue (Million), by Country 2024 & 2032
- Figure 11: Latin America MEA Food Cans Market Revenue Share (%), by Country 2024 & 2032
- Figure 12: Middle East and Africa MEA Food Cans Market Revenue (Million), by Country 2024 & 2032
- Figure 13: Middle East and Africa MEA Food Cans Market Revenue Share (%), by Country 2024 & 2032
- Figure 14: North America MEA Food Cans Market Revenue (Million), by Material Type 2024 & 2032
- Figure 15: North America MEA Food Cans Market Revenue Share (%), by Material Type 2024 & 2032
- Figure 16: North America MEA Food Cans Market Revenue (Million), by Application 2024 & 2032
- Figure 17: North America MEA Food Cans Market Revenue Share (%), by Application 2024 & 2032
- Figure 18: North America MEA Food Cans Market Revenue (Million), by Country 2024 & 2032
- Figure 19: North America MEA Food Cans Market Revenue Share (%), by Country 2024 & 2032
- Figure 20: South America MEA Food Cans Market Revenue (Million), by Material Type 2024 & 2032
- Figure 21: South America MEA Food Cans Market Revenue Share (%), by Material Type 2024 & 2032
- Figure 22: South America MEA Food Cans Market Revenue (Million), by Application 2024 & 2032
- Figure 23: South America MEA Food Cans Market Revenue Share (%), by Application 2024 & 2032
- Figure 24: South America MEA Food Cans Market Revenue (Million), by Country 2024 & 2032
- Figure 25: South America MEA Food Cans Market Revenue Share (%), by Country 2024 & 2032
- Figure 26: Europe MEA Food Cans Market Revenue (Million), by Material Type 2024 & 2032
- Figure 27: Europe MEA Food Cans Market Revenue Share (%), by Material Type 2024 & 2032
- Figure 28: Europe MEA Food Cans Market Revenue (Million), by Application 2024 & 2032
- Figure 29: Europe MEA Food Cans Market Revenue Share (%), by Application 2024 & 2032
- Figure 30: Europe MEA Food Cans Market Revenue (Million), by Country 2024 & 2032
- Figure 31: Europe MEA Food Cans Market Revenue Share (%), by Country 2024 & 2032
- Figure 32: Middle East & Africa MEA Food Cans Market Revenue (Million), by Material Type 2024 & 2032
- Figure 33: Middle East & Africa MEA Food Cans Market Revenue Share (%), by Material Type 2024 & 2032
- Figure 34: Middle East & Africa MEA Food Cans Market Revenue (Million), by Application 2024 & 2032
- Figure 35: Middle East & Africa MEA Food Cans Market Revenue Share (%), by Application 2024 & 2032
- Figure 36: Middle East & Africa MEA Food Cans Market Revenue (Million), by Country 2024 & 2032
- Figure 37: Middle East & Africa MEA Food Cans Market Revenue Share (%), by Country 2024 & 2032
- Figure 38: Asia Pacific MEA Food Cans Market Revenue (Million), by Material Type 2024 & 2032
- Figure 39: Asia Pacific MEA Food Cans Market Revenue Share (%), by Material Type 2024 & 2032
- Figure 40: Asia Pacific MEA Food Cans Market Revenue (Million), by Application 2024 & 2032
- Figure 41: Asia Pacific MEA Food Cans Market Revenue Share (%), by Application 2024 & 2032
- Figure 42: Asia Pacific MEA Food Cans Market Revenue (Million), by Country 2024 & 2032
- Figure 43: Asia Pacific MEA Food Cans Market Revenue Share (%), by Country 2024 & 2032
List of Tables
- Table 1: Global MEA Food Cans Market Revenue Million Forecast, by Region 2019 & 2032
- Table 2: Global MEA Food Cans Market Revenue Million Forecast, by Material Type 2019 & 2032
- Table 3: Global MEA Food Cans Market Revenue Million Forecast, by Application 2019 & 2032
- Table 4: Global MEA Food Cans Market Revenue Million Forecast, by Region 2019 & 2032
- Table 5: Global MEA Food Cans Market Revenue Million Forecast, by Country 2019 & 2032
- Table 6: MEA Food Cans Market Revenue (Million) Forecast, by Application 2019 & 2032
- Table 7: Global MEA Food Cans Market Revenue Million Forecast, by Country 2019 & 2032
- Table 8: MEA Food Cans Market Revenue (Million) Forecast, by Application 2019 & 2032
- Table 9: Global MEA Food Cans Market Revenue Million Forecast, by Country 2019 & 2032
- Table 10: MEA Food Cans Market Revenue (Million) Forecast, by Application 2019 & 2032
- Table 11: Global MEA Food Cans Market Revenue Million Forecast, by Country 2019 & 2032
- Table 12: MEA Food Cans Market Revenue (Million) Forecast, by Application 2019 & 2032
- Table 13: Global MEA Food Cans Market Revenue Million Forecast, by Country 2019 & 2032
- Table 14: MEA Food Cans Market Revenue (Million) Forecast, by Application 2019 & 2032
- Table 15: Global MEA Food Cans Market Revenue Million Forecast, by Country 2019 & 2032
- Table 16: MEA Food Cans Market Revenue (Million) Forecast, by Application 2019 & 2032
- Table 17: Global MEA Food Cans Market Revenue Million Forecast, by Material Type 2019 & 2032
- Table 18: Global MEA Food Cans Market Revenue Million Forecast, by Application 2019 & 2032
- Table 19: Global MEA Food Cans Market Revenue Million Forecast, by Country 2019 & 2032
- Table 20: United States MEA Food Cans Market Revenue (Million) Forecast, by Application 2019 & 2032
- Table 21: Canada MEA Food Cans Market Revenue (Million) Forecast, by Application 2019 & 2032
- Table 22: Mexico MEA Food Cans Market Revenue (Million) Forecast, by Application 2019 & 2032
- Table 23: Global MEA Food Cans Market Revenue Million Forecast, by Material Type 2019 & 2032
- Table 24: Global MEA Food Cans Market Revenue Million Forecast, by Application 2019 & 2032
- Table 25: Global MEA Food Cans Market Revenue Million Forecast, by Country 2019 & 2032
- Table 26: Brazil MEA Food Cans Market Revenue (Million) Forecast, by Application 2019 & 2032
- Table 27: Argentina MEA Food Cans Market Revenue (Million) Forecast, by Application 2019 & 2032
- Table 28: Rest of South America MEA Food Cans Market Revenue (Million) Forecast, by Application 2019 & 2032
- Table 29: Global MEA Food Cans Market Revenue Million Forecast, by Material Type 2019 & 2032
- Table 30: Global MEA Food Cans Market Revenue Million Forecast, by Application 2019 & 2032
- Table 31: Global MEA Food Cans Market Revenue Million Forecast, by Country 2019 & 2032
- Table 32: United Kingdom MEA Food Cans Market Revenue (Million) Forecast, by Application 2019 & 2032
- Table 33: Germany MEA Food Cans Market Revenue (Million) Forecast, by Application 2019 & 2032
- Table 34: France MEA Food Cans Market Revenue (Million) Forecast, by Application 2019 & 2032
- Table 35: Italy MEA Food Cans Market Revenue (Million) Forecast, by Application 2019 & 2032
- Table 36: Spain MEA Food Cans Market Revenue (Million) Forecast, by Application 2019 & 2032
- Table 37: Russia MEA Food Cans Market Revenue (Million) Forecast, by Application 2019 & 2032
- Table 38: Benelux MEA Food Cans Market Revenue (Million) Forecast, by Application 2019 & 2032
- Table 39: Nordics MEA Food Cans Market Revenue (Million) Forecast, by Application 2019 & 2032
- Table 40: Rest of Europe MEA Food Cans Market Revenue (Million) Forecast, by Application 2019 & 2032
- Table 41: Global MEA Food Cans Market Revenue Million Forecast, by Material Type 2019 & 2032
- Table 42: Global MEA Food Cans Market Revenue Million Forecast, by Application 2019 & 2032
- Table 43: Global MEA Food Cans Market Revenue Million Forecast, by Country 2019 & 2032
- Table 44: Turkey MEA Food Cans Market Revenue (Million) Forecast, by Application 2019 & 2032
- Table 45: Israel MEA Food Cans Market Revenue (Million) Forecast, by Application 2019 & 2032
- Table 46: GCC MEA Food Cans Market Revenue (Million) Forecast, by Application 2019 & 2032
- Table 47: North Africa MEA Food Cans Market Revenue (Million) Forecast, by Application 2019 & 2032
- Table 48: South Africa MEA Food Cans Market Revenue (Million) Forecast, by Application 2019 & 2032
- Table 49: Rest of Middle East & Africa MEA Food Cans Market Revenue (Million) Forecast, by Application 2019 & 2032
- Table 50: Global MEA Food Cans Market Revenue Million Forecast, by Material Type 2019 & 2032
- Table 51: Global MEA Food Cans Market Revenue Million Forecast, by Application 2019 & 2032
- Table 52: Global MEA Food Cans Market Revenue Million Forecast, by Country 2019 & 2032
- Table 53: China MEA Food Cans Market Revenue (Million) Forecast, by Application 2019 & 2032
- Table 54: India MEA Food Cans Market Revenue (Million) Forecast, by Application 2019 & 2032
- Table 55: Japan MEA Food Cans Market Revenue (Million) Forecast, by Application 2019 & 2032
- Table 56: South Korea MEA Food Cans Market Revenue (Million) Forecast, by Application 2019 & 2032
- Table 57: ASEAN MEA Food Cans Market Revenue (Million) Forecast, by Application 2019 & 2032
- Table 58: Oceania MEA Food Cans Market Revenue (Million) Forecast, by Application 2019 & 2032
- Table 59: Rest of Asia Pacific MEA Food Cans Market Revenue (Million) Forecast, by Application 2019 & 2032
Frequently Asked Questions
1. What is the projected Compound Annual Growth Rate (CAGR) of the MEA Food Cans Market?
The projected CAGR is approximately 1.99%.
2. Which companies are prominent players in the MEA Food Cans Market?
Key companies in the market include MetPac SA, Can-Pack Sa, Ball Corporation, Crown Holdings Inc, Gulf Cans Industries, Sapin UAE, Arabian Can Industr, Middle East Metal Can LLC (Trinity Holdings), Emirates Metallic Industries Company Limited (EMIC), Amopack Can Manufacturers.
3. What are the main segments of the MEA Food Cans Market?
The market segments include Material Type, Application.
4. Can you provide details about the market size?
The market size is estimated to be USD 1.61 Million as of 2022.
5. What are some drivers contributing to market growth?
Rising Disposable Income and Urbanization; Growth in E-commerce Industry is Expected to Drive the Market.
6. What are the notable trends driving market growth?
Aluminum Cans Expected to Gain Largest Market in the Region.
7. Are there any restraints impacting market growth?
Lower Costs of Substitute Products Might Affect the Market.
8. Can you provide examples of recent developments in the market?
June 2023 - Ball Corporation showcased its latest aluminum can and bottle portfolio at the BevNET Live Summer 2023. Attendees for BevNET Live will learn about Ball's range of "slim" can capabilities, including new supply locations for the 5.5oz, 6.8oz, 8.4oz, and 250mL can sizes.
9. What pricing options are available for accessing the report?
Pricing options include single-user, multi-user, and enterprise licenses priced at USD 4750, USD 4950, and USD 6800 respectively.
10. Is the market size provided in terms of value or volume?
The market size is provided in terms of value, measured in Million.
11. Are there any specific market keywords associated with the report?
Yes, the market keyword associated with the report is "MEA Food Cans Market," which aids in identifying and referencing the specific market segment covered.
12. How do I determine which pricing option suits my needs best?
The pricing options vary based on user requirements and access needs. Individual users may opt for single-user licenses, while businesses requiring broader access may choose multi-user or enterprise licenses for cost-effective access to the report.
13. Are there any additional resources or data provided in the MEA Food Cans Market report?
While the report offers comprehensive insights, it's advisable to review the specific contents or supplementary materials provided to ascertain if additional resources or data are available.
14. How can I stay updated on further developments or reports in the MEA Food Cans Market?
To stay informed about further developments, trends, and reports in the MEA Food Cans Market, consider subscribing to industry newsletters, following relevant companies and organizations, or regularly checking reputable industry news sources and publications.
Methodology
Step 1 - Identification of Relevant Samples Size from Population Database


Step 2 - Approaches for Defining Global Market Size (Value, Volume* & Price*)

Note*: In applicable scenarios
Step 3 - Data Sources
Primary Research
- Web Analytics
- Survey Reports
- Research Institute
- Latest Research Reports
- Opinion Leaders
Secondary Research
- Annual Reports
- White Paper
- Latest Press Release
- Industry Association
- Paid Database
- Investor Presentations

Step 4 - Data Triangulation
Involves using different sources of information in order to increase the validity of a study
These sources are likely to be stakeholders in a program - participants, other researchers, program staff, other community members, and so on.
Then we put all data in single framework & apply various statistical tools to find out the dynamic on the market.
During the analysis stage, feedback from the stakeholder groups would be compared to determine areas of agreement as well as areas of divergence


