
Key Insights
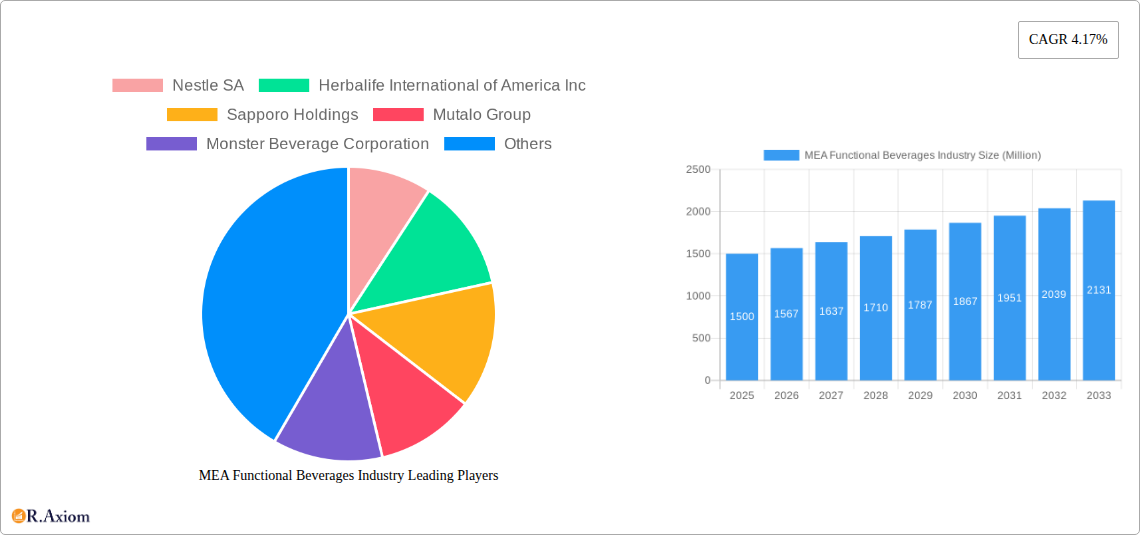
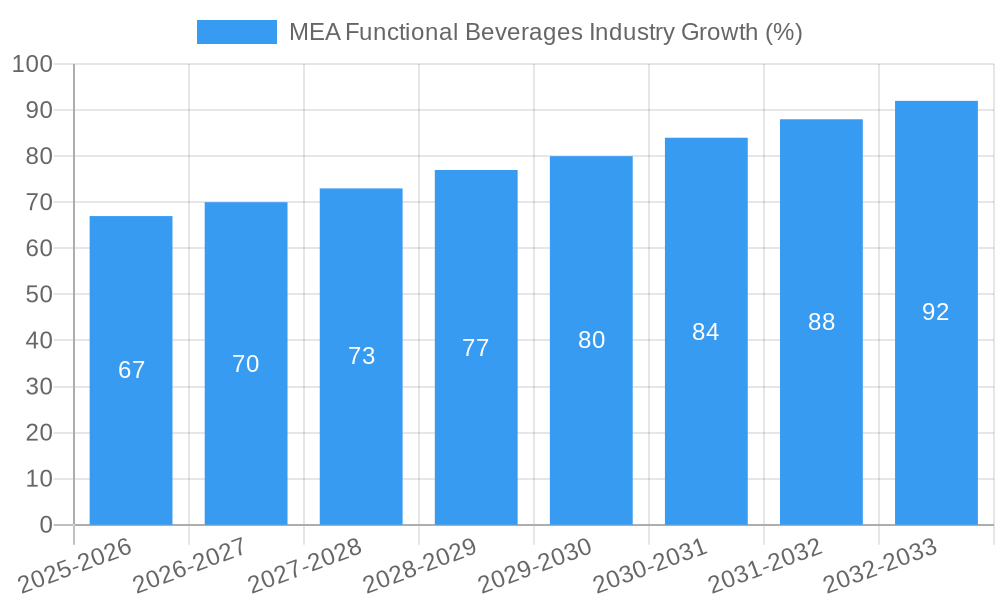
The MEA Functional Beverages market, while smaller than established regions like North America or Europe, exhibits significant growth potential. Driven by increasing health consciousness, rising disposable incomes, and a young, active population, the market is projected to expand steadily over the forecast period (2025-2033). The CAGR of 4.17% observed globally suggests a similar, if not slightly higher, growth trajectory for MEA, potentially boosted by increasing urbanization and the adoption of Western lifestyles. Key segments within the MEA functional beverage market include energy drinks, fortified juices, and sports drinks, catering to the region's diverse consumer needs. While the distribution channels are diversified, including supermarkets, pharmacies, convenience stores, and online retail platforms, growth is particularly promising within the online sector given increasing internet penetration. However, challenges remain, including the relatively high cost of some functional beverages, potentially limiting accessibility for lower-income consumers. Furthermore, regulatory hurdles and consumer awareness about the health benefits of different functional beverages will influence market performance. Strong competition from established global players like Coca-Cola and PepsiCo, alongside regional players, adds another layer of complexity. Nevertheless, the long-term outlook for the MEA functional beverages market remains positive, underpinned by evolving consumer preferences and the region's demographic trends.
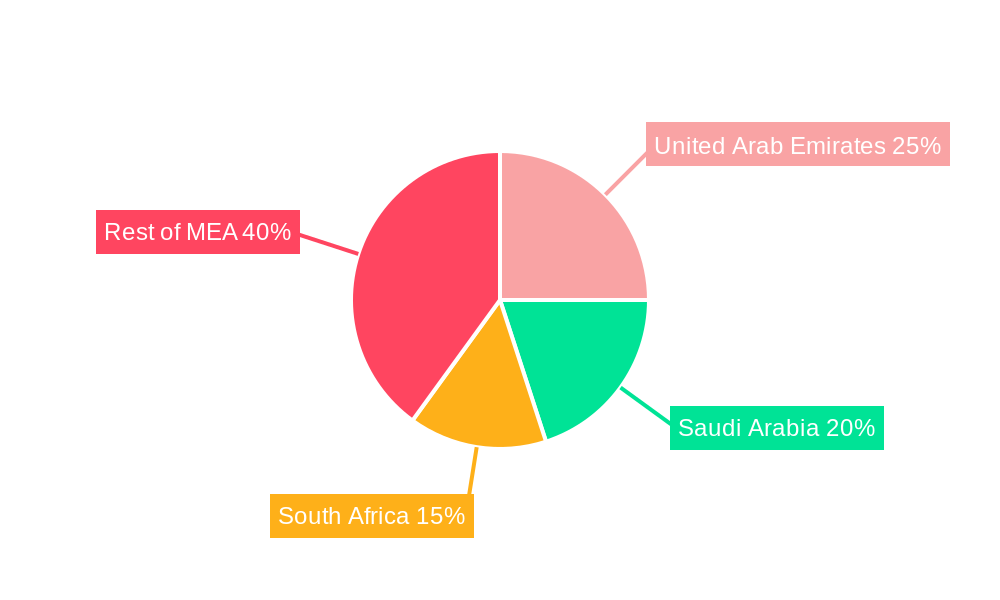
The specific regional performance within MEA will be influenced by varying economic conditions and consumer preferences across countries. Countries like the United Arab Emirates and Saudi Arabia, with higher per capita incomes, are expected to show stronger growth compared to others. Strategic partnerships with local distributors and tailored marketing campaigns addressing cultural sensitivities will be crucial for success. The emergence of innovative product offerings, catering to local taste preferences and incorporating natural ingredients, also present significant opportunities. The market's growth will be further shaped by government initiatives promoting healthy lifestyles and regulations related to food and beverage safety. By addressing the challenges and capitalizing on the opportunities, players in the MEA functional beverages market can effectively position themselves for sustainable growth.
MEA Functional Beverages Industry: A Comprehensive Market Report (2019-2033)
This comprehensive report provides a detailed analysis of the Middle East and Africa (MEA) functional beverages industry, covering the period 2019-2033. It offers in-depth insights into market dynamics, growth drivers, challenges, opportunities, and competitive landscapes, equipping stakeholders with actionable intelligence to navigate this dynamic sector. The report incorporates a meticulous analysis of key players, product segments, distribution channels, and emerging trends, forecasting substantial growth potential within the MEA region.
MEA Functional Beverages Industry Market Concentration & Innovation
This section analyzes the MEA functional beverage market's concentration, innovation drivers, regulatory landscape, product substitutes, end-user trends, and mergers and acquisitions (M&A) activity. The market is characterized by a mix of multinational corporations and regional players, with a few dominant players holding significant market share. Nestle SA, The Coca-Cola Company, and PepsiCo Inc. command substantial market presence, though their exact market share fluctuates annually (xx% for Nestle in 2025, xx% for Coca-Cola in 2025, xx% for PepsiCo in 2025).
- Market Concentration: The MEA functional beverage market exhibits moderate concentration, with a few large players controlling a significant portion. Smaller regional players often focus on niche segments.
- Innovation Drivers: Health and wellness trends, increasing consumer demand for functional benefits, and product diversification drive innovation. This includes the development of low-sugar, organic, and naturally-sourced functional drinks.
- Regulatory Framework: Varying regulatory frameworks across different MEA countries influence product formulation, labeling, and marketing claims. Stricter regulations on sugar content and added substances are influencing industry shifts.
- Product Substitutes: The market faces competition from other beverage categories, including carbonated soft drinks and juices. However, the increasing demand for healthy and functional beverages limits this threat.
- End-User Trends: Growing health consciousness, rising disposable incomes, and changing lifestyles are shaping consumer preferences towards functional beverages. Demand for convenience and portability is also prominent.
- M&A Activities: The MEA functional beverage market has witnessed several M&A deals in recent years (xx Million in total deal value for the period 2019-2024). These transactions aim to expand market reach, enhance product portfolios, and strengthen competitive positioning.
MEA Functional Beverages Industry Industry Trends & Insights
The MEA functional beverage market is experiencing robust growth, driven by several key factors. The Compound Annual Growth Rate (CAGR) for the forecast period (2025-2033) is projected at xx%. Market penetration varies significantly across different segments, with energy drinks showing higher penetration compared to other categories, like fortified juices.
- Market Growth Drivers: Rising health awareness, changing consumer lifestyles, increasing disposable incomes in key markets, and the expansion of organized retail channels are driving market growth. The youth population's growth and their increasing preference for healthier options contribute significantly.
- Technological Disruptions: Technological advancements in product formulation, packaging, and distribution are streamlining the industry. E-commerce growth and efficient supply chain management are impacting the sector.
- Consumer Preferences: Consumers exhibit increasing preferences for natural ingredients, low-sugar options, and functional benefits (e.g., enhanced immunity, increased energy). Demand for convenient packaging formats is also increasing.
- Competitive Dynamics: The market is characterized by intense competition between international and regional players. Companies are employing aggressive marketing strategies, including product innovation and brand building, to gain market share.
Dominant Markets & Segments in MEA Functional Beverages Industry
The MEA functional beverage market presents diverse growth opportunities across various regions, countries, and product segments. The UAE, Saudi Arabia, and Egypt represent the largest markets. Within the product segments, energy drinks maintain the dominant position, followed by sports drinks and fortified juices.
- Leading Regions/Countries: The UAE and Saudi Arabia lead due to high disposable incomes and a young, health-conscious population. Egypt's growing economy and large population base also contribute.
- Dominant Distribution Channel: Supermarket/Hypermarkets account for a significant portion of the market, followed by convenience stores and online retail stores. Pharmacies and health stores represent a niche segment. The ease of access and wide distribution networks of supermarkets contribute to their dominance.
- Dominant Product Type: Energy drinks capture the largest market share due to high consumer demand for energy boosters. Sports drinks and fortified juices are experiencing robust growth, driven by increased health consciousness.
- Key Drivers: Factors driving the dominance of specific markets and segments include economic growth, government policies supporting healthy lifestyles, robust retail infrastructure, and increased marketing & distribution efforts by leading players.
MEA Functional Beverages Industry Product Developments
Recent product developments reflect the industry's focus on catering to evolving consumer preferences for healthier and more functional beverages. This includes innovations in low-sugar, organic, and natural formulations, along with increased usage of functional ingredients. Companies are also focusing on enhancing the nutritional profile of their products by adding vitamins, minerals, and other beneficial ingredients. Innovative packaging formats, including convenient single-serve options, are also gaining popularity.
Report Scope & Segmentation Analysis
This report segments the MEA functional beverage market by distribution channel (Supermarket/Hypermarket, Pharmacies and Health Stores, Convenience Stores, Online Retail Stores, Other Distribution Channels) and product type (Energy Drinks, Fortified Juice, Sports Drinks, Dairy-based Drinks, Other Product Types). Each segment's market size, growth projection, and competitive dynamics are analyzed comprehensively. The report provides detailed market size values in millions for the base year (2025) and offers forecasts until 2033. Detailed CAGR projections are provided for each segment.
Key Drivers of MEA Functional Beverages Industry Growth
The MEA functional beverage market is propelled by several key growth drivers. The rising health consciousness among consumers, coupled with a growing preference for convenient and healthier alternatives to traditional beverages, is driving demand. Economic growth and rising disposable incomes in several MEA countries also contribute significantly. Moreover, favorable government policies promoting healthy lifestyles and supportive regulatory frameworks are further boosting market growth.
Challenges in the MEA Functional Beverages Industry Sector
Several challenges hinder the growth of the MEA functional beverage market. Stringent regulations and varying standards across different countries can increase the complexity of product launches and marketing efforts. Supply chain disruptions and logistics challenges impact product availability and pricing. Finally, intense competition among established and emerging players requires companies to invest heavily in marketing and brand building to maintain market share. The impact of these factors on overall market growth is estimated at xx%.
Emerging Opportunities in MEA Functional Beverages Industry
The MEA functional beverage market presents significant opportunities for growth. The expanding e-commerce sector provides a new avenue for reaching consumers. The increasing popularity of functional ingredients, such as probiotics and botanical extracts, presents opportunities for innovative product development. Furthermore, tapping into the demand for sustainably sourced and ethically produced functional beverages represents another emerging opportunity.
Leading Players in the MEA Functional Beverages Industry Market
- Nestle SA
- Herbalife International of America Inc
- Sapporo Holdings
- Mutalo Group
- Monster Beverage Corporation
- PepsiCo Inc
- Dr Pepper Snapple
- Viju Industries Nigeria Ltd
- iPRO Sport Distribution Limited
- Red Bull GmbH
- The Coca-Cola Company
Key Developments in MEA Functional Beverages Industry Industry
- October 2022: iPRO launched a range of sports drinks in Carrefour stores across the UAE, highlighting the growing popularity of vitamin-enhanced beverages.
- February 2022: PepsiCo's launch of Rockstar Energy hemp-based drinks signals the market's embrace of novel ingredients and caters to evolving consumer preferences.
- March 2021: Perrier's entry into the carbonated energy beverage market with Perrier Energize signifies the expansion of product categories and caters to consumer demand for low-calorie, organic options.
Strategic Outlook for MEA Functional Beverages Industry Market
The MEA functional beverage market exhibits robust growth potential, driven by escalating health awareness and evolving consumer preferences. Future opportunities lie in the development of innovative products catering to specific health needs, leveraging technology for enhanced production efficiency and distribution, and focusing on sustainable and ethical sourcing practices. The continued expansion of organized retail and the growth of e-commerce platforms will also play a significant role in shaping the future of the industry.
MEA Functional Beverages Industry Segmentation
-
1. Product Type
- 1.1. Energy Drinks
- 1.2. Fortified Juice
- 1.3. Sports Drinks
- 1.4. Dairy-based Drinks
- 1.5. Other Product Types
-
2. Distribution Channel
- 2.1. Supermarket/Hypermarket
- 2.2. Pharmacies and Health Stores
- 2.3. Convenience Stores
- 2.4. Online Retail Stores
- 2.5. Other Distribution Channels
-
3. Geography
- 3.1. South Africa
- 3.2. Saudi Arabia
- 3.3. Rest of Middle-East and Africa
MEA Functional Beverages Industry Segmentation By Geography
- 1. South Africa
- 2. Saudi Arabia
- 3. Rest of Middle East and Africa
MEA Functional Beverages Industry REPORT HIGHLIGHTS
| Aspects | Details |
|---|---|
| Study Period | 2019-2033 |
| Base Year | 2024 |
| Estimated Year | 2025 |
| Forecast Period | 2025-2033 |
| Historical Period | 2019-2024 |
| Growth Rate | CAGR of 4.17% from 2019-2033 |
| Segmentation |
|
Table of Contents
- 1. Introduction
- 1.1. Research Scope
- 1.2. Market Segmentation
- 1.3. Research Methodology
- 1.4. Definitions and Assumptions
- 2. Executive Summary
- 2.1. Introduction
- 3. Market Dynamics
- 3.1. Introduction
- 3.2. Market Drivers
- 3.2.1. Preference for Plant-based and Clean-label RTD Products; Consumer Inclination Toward Sugar-Free Drinks
- 3.3. Market Restrains
- 3.3.1. Concerns Over Health Issues Associated With Beverages
- 3.4. Market Trends
- 3.4.1. Growing Demand for Plant-based and Lactose-free Products
- 4. Market Factor Analysis
- 4.1. Porters Five Forces
- 4.2. Supply/Value Chain
- 4.3. PESTEL analysis
- 4.4. Market Entropy
- 4.5. Patent/Trademark Analysis
- 5. Global MEA Functional Beverages Industry Analysis, Insights and Forecast, 2019-2031
- 5.1. Market Analysis, Insights and Forecast - by Product Type
- 5.1.1. Energy Drinks
- 5.1.2. Fortified Juice
- 5.1.3. Sports Drinks
- 5.1.4. Dairy-based Drinks
- 5.1.5. Other Product Types
- 5.2. Market Analysis, Insights and Forecast - by Distribution Channel
- 5.2.1. Supermarket/Hypermarket
- 5.2.2. Pharmacies and Health Stores
- 5.2.3. Convenience Stores
- 5.2.4. Online Retail Stores
- 5.2.5. Other Distribution Channels
- 5.3. Market Analysis, Insights and Forecast - by Geography
- 5.3.1. South Africa
- 5.3.2. Saudi Arabia
- 5.3.3. Rest of Middle-East and Africa
- 5.4. Market Analysis, Insights and Forecast - by Region
- 5.4.1. South Africa
- 5.4.2. Saudi Arabia
- 5.4.3. Rest of Middle East and Africa
- 5.1. Market Analysis, Insights and Forecast - by Product Type
- 6. South Africa MEA Functional Beverages Industry Analysis, Insights and Forecast, 2019-2031
- 6.1. Market Analysis, Insights and Forecast - by Product Type
- 6.1.1. Energy Drinks
- 6.1.2. Fortified Juice
- 6.1.3. Sports Drinks
- 6.1.4. Dairy-based Drinks
- 6.1.5. Other Product Types
- 6.2. Market Analysis, Insights and Forecast - by Distribution Channel
- 6.2.1. Supermarket/Hypermarket
- 6.2.2. Pharmacies and Health Stores
- 6.2.3. Convenience Stores
- 6.2.4. Online Retail Stores
- 6.2.5. Other Distribution Channels
- 6.3. Market Analysis, Insights and Forecast - by Geography
- 6.3.1. South Africa
- 6.3.2. Saudi Arabia
- 6.3.3. Rest of Middle-East and Africa
- 6.1. Market Analysis, Insights and Forecast - by Product Type
- 7. Saudi Arabia MEA Functional Beverages Industry Analysis, Insights and Forecast, 2019-2031
- 7.1. Market Analysis, Insights and Forecast - by Product Type
- 7.1.1. Energy Drinks
- 7.1.2. Fortified Juice
- 7.1.3. Sports Drinks
- 7.1.4. Dairy-based Drinks
- 7.1.5. Other Product Types
- 7.2. Market Analysis, Insights and Forecast - by Distribution Channel
- 7.2.1. Supermarket/Hypermarket
- 7.2.2. Pharmacies and Health Stores
- 7.2.3. Convenience Stores
- 7.2.4. Online Retail Stores
- 7.2.5. Other Distribution Channels
- 7.3. Market Analysis, Insights and Forecast - by Geography
- 7.3.1. South Africa
- 7.3.2. Saudi Arabia
- 7.3.3. Rest of Middle-East and Africa
- 7.1. Market Analysis, Insights and Forecast - by Product Type
- 8. Rest of Middle East and Africa MEA Functional Beverages Industry Analysis, Insights and Forecast, 2019-2031
- 8.1. Market Analysis, Insights and Forecast - by Product Type
- 8.1.1. Energy Drinks
- 8.1.2. Fortified Juice
- 8.1.3. Sports Drinks
- 8.1.4. Dairy-based Drinks
- 8.1.5. Other Product Types
- 8.2. Market Analysis, Insights and Forecast - by Distribution Channel
- 8.2.1. Supermarket/Hypermarket
- 8.2.2. Pharmacies and Health Stores
- 8.2.3. Convenience Stores
- 8.2.4. Online Retail Stores
- 8.2.5. Other Distribution Channels
- 8.3. Market Analysis, Insights and Forecast - by Geography
- 8.3.1. South Africa
- 8.3.2. Saudi Arabia
- 8.3.3. Rest of Middle-East and Africa
- 8.1. Market Analysis, Insights and Forecast - by Product Type
- 9. North America MEA Functional Beverages Industry Analysis, Insights and Forecast, 2019-2031
- 9.1. Market Analysis, Insights and Forecast - By Country/Sub-region
- 9.1.1 United States
- 9.1.2 Canada
- 9.1.3 Mexico
- 10. Europe MEA Functional Beverages Industry Analysis, Insights and Forecast, 2019-2031
- 10.1. Market Analysis, Insights and Forecast - By Country/Sub-region
- 10.1.1 Germany
- 10.1.2 United Kingdom
- 10.1.3 France
- 10.1.4 Spain
- 10.1.5 Italy
- 10.1.6 Spain
- 10.1.7 Belgium
- 10.1.8 Netherland
- 10.1.9 Nordics
- 10.1.10 Rest of Europe
- 11. Asia Pacific MEA Functional Beverages Industry Analysis, Insights and Forecast, 2019-2031
- 11.1. Market Analysis, Insights and Forecast - By Country/Sub-region
- 11.1.1 China
- 11.1.2 Japan
- 11.1.3 India
- 11.1.4 South Korea
- 11.1.5 Southeast Asia
- 11.1.6 Australia
- 11.1.7 Indonesia
- 11.1.8 Phillipes
- 11.1.9 Singapore
- 11.1.10 Thailandc
- 11.1.11 Rest of Asia Pacific
- 12. South America MEA Functional Beverages Industry Analysis, Insights and Forecast, 2019-2031
- 12.1. Market Analysis, Insights and Forecast - By Country/Sub-region
- 12.1.1 Brazil
- 12.1.2 Argentina
- 12.1.3 Peru
- 12.1.4 Chile
- 12.1.5 Colombia
- 12.1.6 Ecuador
- 12.1.7 Venezuela
- 12.1.8 Rest of South America
- 13. North America MEA Functional Beverages Industry Analysis, Insights and Forecast, 2019-2031
- 13.1. Market Analysis, Insights and Forecast - By Country/Sub-region
- 13.1.1 United States
- 13.1.2 Canada
- 13.1.3 Mexico
- 14. MEA MEA Functional Beverages Industry Analysis, Insights and Forecast, 2019-2031
- 14.1. Market Analysis, Insights and Forecast - By Country/Sub-region
- 14.1.1 United Arab Emirates
- 14.1.2 Saudi Arabia
- 14.1.3 South Africa
- 14.1.4 Rest of Middle East and Africa
- 15. Competitive Analysis
- 15.1. Global Market Share Analysis 2024
- 15.2. Company Profiles
- 15.2.1 Nestle SA
- 15.2.1.1. Overview
- 15.2.1.2. Products
- 15.2.1.3. SWOT Analysis
- 15.2.1.4. Recent Developments
- 15.2.1.5. Financials (Based on Availability)
- 15.2.2 Herbalife International of America Inc
- 15.2.2.1. Overview
- 15.2.2.2. Products
- 15.2.2.3. SWOT Analysis
- 15.2.2.4. Recent Developments
- 15.2.2.5. Financials (Based on Availability)
- 15.2.3 Sapporo Holdings
- 15.2.3.1. Overview
- 15.2.3.2. Products
- 15.2.3.3. SWOT Analysis
- 15.2.3.4. Recent Developments
- 15.2.3.5. Financials (Based on Availability)
- 15.2.4 Mutalo Group
- 15.2.4.1. Overview
- 15.2.4.2. Products
- 15.2.4.3. SWOT Analysis
- 15.2.4.4. Recent Developments
- 15.2.4.5. Financials (Based on Availability)
- 15.2.5 Monster Beverage Corporation
- 15.2.5.1. Overview
- 15.2.5.2. Products
- 15.2.5.3. SWOT Analysis
- 15.2.5.4. Recent Developments
- 15.2.5.5. Financials (Based on Availability)
- 15.2.6 PepsiCo Inc
- 15.2.6.1. Overview
- 15.2.6.2. Products
- 15.2.6.3. SWOT Analysis
- 15.2.6.4. Recent Developments
- 15.2.6.5. Financials (Based on Availability)
- 15.2.7 Dr Pepper Snapple
- 15.2.7.1. Overview
- 15.2.7.2. Products
- 15.2.7.3. SWOT Analysis
- 15.2.7.4. Recent Developments
- 15.2.7.5. Financials (Based on Availability)
- 15.2.8 Viju Industries Nigeria Ltd
- 15.2.8.1. Overview
- 15.2.8.2. Products
- 15.2.8.3. SWOT Analysis
- 15.2.8.4. Recent Developments
- 15.2.8.5. Financials (Based on Availability)
- 15.2.9 iPRO Sport Distribution Limited*List Not Exhaustive
- 15.2.9.1. Overview
- 15.2.9.2. Products
- 15.2.9.3. SWOT Analysis
- 15.2.9.4. Recent Developments
- 15.2.9.5. Financials (Based on Availability)
- 15.2.10 Red Bull GmbH
- 15.2.10.1. Overview
- 15.2.10.2. Products
- 15.2.10.3. SWOT Analysis
- 15.2.10.4. Recent Developments
- 15.2.10.5. Financials (Based on Availability)
- 15.2.11 The Coca-Cola Company
- 15.2.11.1. Overview
- 15.2.11.2. Products
- 15.2.11.3. SWOT Analysis
- 15.2.11.4. Recent Developments
- 15.2.11.5. Financials (Based on Availability)
- 15.2.1 Nestle SA
List of Figures
- Figure 1: Global MEA Functional Beverages Industry Revenue Breakdown (Million, %) by Region 2024 & 2032
- Figure 2: North America MEA Functional Beverages Industry Revenue (Million), by Country 2024 & 2032
- Figure 3: North America MEA Functional Beverages Industry Revenue Share (%), by Country 2024 & 2032
- Figure 4: Europe MEA Functional Beverages Industry Revenue (Million), by Country 2024 & 2032
- Figure 5: Europe MEA Functional Beverages Industry Revenue Share (%), by Country 2024 & 2032
- Figure 6: Asia Pacific MEA Functional Beverages Industry Revenue (Million), by Country 2024 & 2032
- Figure 7: Asia Pacific MEA Functional Beverages Industry Revenue Share (%), by Country 2024 & 2032
- Figure 8: South America MEA Functional Beverages Industry Revenue (Million), by Country 2024 & 2032
- Figure 9: South America MEA Functional Beverages Industry Revenue Share (%), by Country 2024 & 2032
- Figure 10: North America MEA Functional Beverages Industry Revenue (Million), by Country 2024 & 2032
- Figure 11: North America MEA Functional Beverages Industry Revenue Share (%), by Country 2024 & 2032
- Figure 12: MEA MEA Functional Beverages Industry Revenue (Million), by Country 2024 & 2032
- Figure 13: MEA MEA Functional Beverages Industry Revenue Share (%), by Country 2024 & 2032
- Figure 14: South Africa MEA Functional Beverages Industry Revenue (Million), by Product Type 2024 & 2032
- Figure 15: South Africa MEA Functional Beverages Industry Revenue Share (%), by Product Type 2024 & 2032
- Figure 16: South Africa MEA Functional Beverages Industry Revenue (Million), by Distribution Channel 2024 & 2032
- Figure 17: South Africa MEA Functional Beverages Industry Revenue Share (%), by Distribution Channel 2024 & 2032
- Figure 18: South Africa MEA Functional Beverages Industry Revenue (Million), by Geography 2024 & 2032
- Figure 19: South Africa MEA Functional Beverages Industry Revenue Share (%), by Geography 2024 & 2032
- Figure 20: South Africa MEA Functional Beverages Industry Revenue (Million), by Country 2024 & 2032
- Figure 21: South Africa MEA Functional Beverages Industry Revenue Share (%), by Country 2024 & 2032
- Figure 22: Saudi Arabia MEA Functional Beverages Industry Revenue (Million), by Product Type 2024 & 2032
- Figure 23: Saudi Arabia MEA Functional Beverages Industry Revenue Share (%), by Product Type 2024 & 2032
- Figure 24: Saudi Arabia MEA Functional Beverages Industry Revenue (Million), by Distribution Channel 2024 & 2032
- Figure 25: Saudi Arabia MEA Functional Beverages Industry Revenue Share (%), by Distribution Channel 2024 & 2032
- Figure 26: Saudi Arabia MEA Functional Beverages Industry Revenue (Million), by Geography 2024 & 2032
- Figure 27: Saudi Arabia MEA Functional Beverages Industry Revenue Share (%), by Geography 2024 & 2032
- Figure 28: Saudi Arabia MEA Functional Beverages Industry Revenue (Million), by Country 2024 & 2032
- Figure 29: Saudi Arabia MEA Functional Beverages Industry Revenue Share (%), by Country 2024 & 2032
- Figure 30: Rest of Middle East and Africa MEA Functional Beverages Industry Revenue (Million), by Product Type 2024 & 2032
- Figure 31: Rest of Middle East and Africa MEA Functional Beverages Industry Revenue Share (%), by Product Type 2024 & 2032
- Figure 32: Rest of Middle East and Africa MEA Functional Beverages Industry Revenue (Million), by Distribution Channel 2024 & 2032
- Figure 33: Rest of Middle East and Africa MEA Functional Beverages Industry Revenue Share (%), by Distribution Channel 2024 & 2032
- Figure 34: Rest of Middle East and Africa MEA Functional Beverages Industry Revenue (Million), by Geography 2024 & 2032
- Figure 35: Rest of Middle East and Africa MEA Functional Beverages Industry Revenue Share (%), by Geography 2024 & 2032
- Figure 36: Rest of Middle East and Africa MEA Functional Beverages Industry Revenue (Million), by Country 2024 & 2032
- Figure 37: Rest of Middle East and Africa MEA Functional Beverages Industry Revenue Share (%), by Country 2024 & 2032
List of Tables
- Table 1: Global MEA Functional Beverages Industry Revenue Million Forecast, by Region 2019 & 2032
- Table 2: Global MEA Functional Beverages Industry Revenue Million Forecast, by Product Type 2019 & 2032
- Table 3: Global MEA Functional Beverages Industry Revenue Million Forecast, by Distribution Channel 2019 & 2032
- Table 4: Global MEA Functional Beverages Industry Revenue Million Forecast, by Geography 2019 & 2032
- Table 5: Global MEA Functional Beverages Industry Revenue Million Forecast, by Region 2019 & 2032
- Table 6: Global MEA Functional Beverages Industry Revenue Million Forecast, by Country 2019 & 2032
- Table 7: United States MEA Functional Beverages Industry Revenue (Million) Forecast, by Application 2019 & 2032
- Table 8: Canada MEA Functional Beverages Industry Revenue (Million) Forecast, by Application 2019 & 2032
- Table 9: Mexico MEA Functional Beverages Industry Revenue (Million) Forecast, by Application 2019 & 2032
- Table 10: Global MEA Functional Beverages Industry Revenue Million Forecast, by Country 2019 & 2032
- Table 11: Germany MEA Functional Beverages Industry Revenue (Million) Forecast, by Application 2019 & 2032
- Table 12: United Kingdom MEA Functional Beverages Industry Revenue (Million) Forecast, by Application 2019 & 2032
- Table 13: France MEA Functional Beverages Industry Revenue (Million) Forecast, by Application 2019 & 2032
- Table 14: Spain MEA Functional Beverages Industry Revenue (Million) Forecast, by Application 2019 & 2032
- Table 15: Italy MEA Functional Beverages Industry Revenue (Million) Forecast, by Application 2019 & 2032
- Table 16: Spain MEA Functional Beverages Industry Revenue (Million) Forecast, by Application 2019 & 2032
- Table 17: Belgium MEA Functional Beverages Industry Revenue (Million) Forecast, by Application 2019 & 2032
- Table 18: Netherland MEA Functional Beverages Industry Revenue (Million) Forecast, by Application 2019 & 2032
- Table 19: Nordics MEA Functional Beverages Industry Revenue (Million) Forecast, by Application 2019 & 2032
- Table 20: Rest of Europe MEA Functional Beverages Industry Revenue (Million) Forecast, by Application 2019 & 2032
- Table 21: Global MEA Functional Beverages Industry Revenue Million Forecast, by Country 2019 & 2032
- Table 22: China MEA Functional Beverages Industry Revenue (Million) Forecast, by Application 2019 & 2032
- Table 23: Japan MEA Functional Beverages Industry Revenue (Million) Forecast, by Application 2019 & 2032
- Table 24: India MEA Functional Beverages Industry Revenue (Million) Forecast, by Application 2019 & 2032
- Table 25: South Korea MEA Functional Beverages Industry Revenue (Million) Forecast, by Application 2019 & 2032
- Table 26: Southeast Asia MEA Functional Beverages Industry Revenue (Million) Forecast, by Application 2019 & 2032
- Table 27: Australia MEA Functional Beverages Industry Revenue (Million) Forecast, by Application 2019 & 2032
- Table 28: Indonesia MEA Functional Beverages Industry Revenue (Million) Forecast, by Application 2019 & 2032
- Table 29: Phillipes MEA Functional Beverages Industry Revenue (Million) Forecast, by Application 2019 & 2032
- Table 30: Singapore MEA Functional Beverages Industry Revenue (Million) Forecast, by Application 2019 & 2032
- Table 31: Thailandc MEA Functional Beverages Industry Revenue (Million) Forecast, by Application 2019 & 2032
- Table 32: Rest of Asia Pacific MEA Functional Beverages Industry Revenue (Million) Forecast, by Application 2019 & 2032
- Table 33: Global MEA Functional Beverages Industry Revenue Million Forecast, by Country 2019 & 2032
- Table 34: Brazil MEA Functional Beverages Industry Revenue (Million) Forecast, by Application 2019 & 2032
- Table 35: Argentina MEA Functional Beverages Industry Revenue (Million) Forecast, by Application 2019 & 2032
- Table 36: Peru MEA Functional Beverages Industry Revenue (Million) Forecast, by Application 2019 & 2032
- Table 37: Chile MEA Functional Beverages Industry Revenue (Million) Forecast, by Application 2019 & 2032
- Table 38: Colombia MEA Functional Beverages Industry Revenue (Million) Forecast, by Application 2019 & 2032
- Table 39: Ecuador MEA Functional Beverages Industry Revenue (Million) Forecast, by Application 2019 & 2032
- Table 40: Venezuela MEA Functional Beverages Industry Revenue (Million) Forecast, by Application 2019 & 2032
- Table 41: Rest of South America MEA Functional Beverages Industry Revenue (Million) Forecast, by Application 2019 & 2032
- Table 42: Global MEA Functional Beverages Industry Revenue Million Forecast, by Country 2019 & 2032
- Table 43: United States MEA Functional Beverages Industry Revenue (Million) Forecast, by Application 2019 & 2032
- Table 44: Canada MEA Functional Beverages Industry Revenue (Million) Forecast, by Application 2019 & 2032
- Table 45: Mexico MEA Functional Beverages Industry Revenue (Million) Forecast, by Application 2019 & 2032
- Table 46: Global MEA Functional Beverages Industry Revenue Million Forecast, by Country 2019 & 2032
- Table 47: United Arab Emirates MEA Functional Beverages Industry Revenue (Million) Forecast, by Application 2019 & 2032
- Table 48: Saudi Arabia MEA Functional Beverages Industry Revenue (Million) Forecast, by Application 2019 & 2032
- Table 49: South Africa MEA Functional Beverages Industry Revenue (Million) Forecast, by Application 2019 & 2032
- Table 50: Rest of Middle East and Africa MEA Functional Beverages Industry Revenue (Million) Forecast, by Application 2019 & 2032
- Table 51: Global MEA Functional Beverages Industry Revenue Million Forecast, by Product Type 2019 & 2032
- Table 52: Global MEA Functional Beverages Industry Revenue Million Forecast, by Distribution Channel 2019 & 2032
- Table 53: Global MEA Functional Beverages Industry Revenue Million Forecast, by Geography 2019 & 2032
- Table 54: Global MEA Functional Beverages Industry Revenue Million Forecast, by Country 2019 & 2032
- Table 55: Global MEA Functional Beverages Industry Revenue Million Forecast, by Product Type 2019 & 2032
- Table 56: Global MEA Functional Beverages Industry Revenue Million Forecast, by Distribution Channel 2019 & 2032
- Table 57: Global MEA Functional Beverages Industry Revenue Million Forecast, by Geography 2019 & 2032
- Table 58: Global MEA Functional Beverages Industry Revenue Million Forecast, by Country 2019 & 2032
- Table 59: Global MEA Functional Beverages Industry Revenue Million Forecast, by Product Type 2019 & 2032
- Table 60: Global MEA Functional Beverages Industry Revenue Million Forecast, by Distribution Channel 2019 & 2032
- Table 61: Global MEA Functional Beverages Industry Revenue Million Forecast, by Geography 2019 & 2032
- Table 62: Global MEA Functional Beverages Industry Revenue Million Forecast, by Country 2019 & 2032
Frequently Asked Questions
1. What is the projected Compound Annual Growth Rate (CAGR) of the MEA Functional Beverages Industry?
The projected CAGR is approximately 4.17%.
2. Which companies are prominent players in the MEA Functional Beverages Industry?
Key companies in the market include Nestle SA, Herbalife International of America Inc, Sapporo Holdings, Mutalo Group, Monster Beverage Corporation, PepsiCo Inc, Dr Pepper Snapple, Viju Industries Nigeria Ltd, iPRO Sport Distribution Limited*List Not Exhaustive, Red Bull GmbH, The Coca-Cola Company.
3. What are the main segments of the MEA Functional Beverages Industry?
The market segments include Product Type, Distribution Channel, Geography.
4. Can you provide details about the market size?
The market size is estimated to be USD XX Million as of 2022.
5. What are some drivers contributing to market growth?
Preference for Plant-based and Clean-label RTD Products; Consumer Inclination Toward Sugar-Free Drinks.
6. What are the notable trends driving market growth?
Growing Demand for Plant-based and Lactose-free Products.
7. Are there any restraints impacting market growth?
Concerns Over Health Issues Associated With Beverages.
8. Can you provide examples of recent developments in the market?
October 2022: iPRO launched a range of sports drinks in Carrefour stores across the United Arab Emirates. The company claims that it contains 100% of the daily recommended vitamin C intake, along with added B vitamins.
9. What pricing options are available for accessing the report?
Pricing options include single-user, multi-user, and enterprise licenses priced at USD 4750, USD 5250, and USD 8750 respectively.
10. Is the market size provided in terms of value or volume?
The market size is provided in terms of value, measured in Million.
11. Are there any specific market keywords associated with the report?
Yes, the market keyword associated with the report is "MEA Functional Beverages Industry," which aids in identifying and referencing the specific market segment covered.
12. How do I determine which pricing option suits my needs best?
The pricing options vary based on user requirements and access needs. Individual users may opt for single-user licenses, while businesses requiring broader access may choose multi-user or enterprise licenses for cost-effective access to the report.
13. Are there any additional resources or data provided in the MEA Functional Beverages Industry report?
While the report offers comprehensive insights, it's advisable to review the specific contents or supplementary materials provided to ascertain if additional resources or data are available.
14. How can I stay updated on further developments or reports in the MEA Functional Beverages Industry?
To stay informed about further developments, trends, and reports in the MEA Functional Beverages Industry, consider subscribing to industry newsletters, following relevant companies and organizations, or regularly checking reputable industry news sources and publications.
Methodology
Step 1 - Identification of Relevant Samples Size from Population Database


Step 2 - Approaches for Defining Global Market Size (Value, Volume* & Price*)

Note*: In applicable scenarios
Step 3 - Data Sources
Primary Research
- Web Analytics
- Survey Reports
- Research Institute
- Latest Research Reports
- Opinion Leaders
Secondary Research
- Annual Reports
- White Paper
- Latest Press Release
- Industry Association
- Paid Database
- Investor Presentations

Step 4 - Data Triangulation
Involves using different sources of information in order to increase the validity of a study
These sources are likely to be stakeholders in a program - participants, other researchers, program staff, other community members, and so on.
Then we put all data in single framework & apply various statistical tools to find out the dynamic on the market.
During the analysis stage, feedback from the stakeholder groups would be compared to determine areas of agreement as well as areas of divergence


