
Key Insights
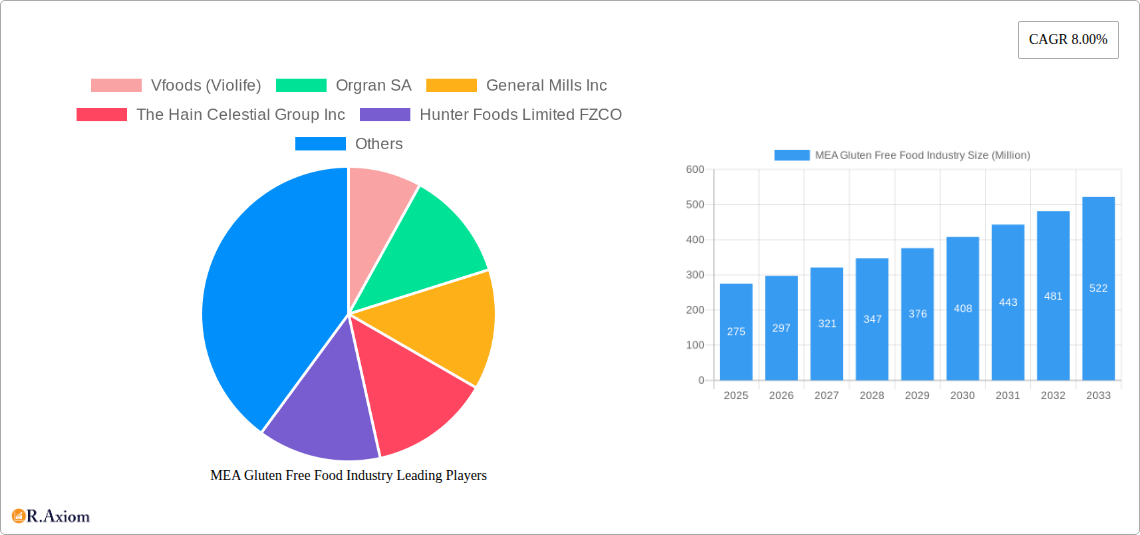
The Middle East and Africa (MEA) gluten-free food market presents a significant growth opportunity, driven by rising health consciousness, increasing prevalence of celiac disease and gluten intolerance, and a growing awareness of the health benefits of gluten-free diets. The market is segmented by product type (gluten-free bread, pasta, snacks, etc.), end-product (bakery, confectionery, dairy-free foods), distribution channel (supermarkets, online retail), and country (South Africa, UAE, Saudi Arabia, etc.). While precise market size data for MEA in 2025 is unavailable, a reasonable estimate can be derived. Considering the global CAGR of 8% and the significant growth in health-conscious consumerism across the MEA region, a conservative estimate for the 2025 MEA gluten-free food market size might be in the range of $250-300 million USD. This estimate reflects a considerable increase from previous years, driven by expanding distribution networks, increased product availability, and a shift in consumer preferences. Factors such as rising disposable incomes in certain segments of the population and increased urbanization are further fueling market expansion. However, challenges such as the relatively high cost of gluten-free products compared to conventional alternatives and limited product variety in certain areas remain constraints to overall market penetration. The market's future growth will hinge on overcoming these challenges through increased product innovation, improved supply chains, and targeted marketing campaigns promoting the benefits of gluten-free diets to a broader consumer base.
The market's future trajectory will be significantly influenced by factors such as government initiatives supporting healthier food choices, the introduction of new gluten-free food products catering to diverse dietary preferences and cultural tastes, and strategic partnerships between manufacturers and retailers to improve product availability. Furthermore, the increasing use of online retail channels will offer greater convenience and accessibility for consumers, thus contributing to the market's sustained growth. A key trend shaping the market is the move towards healthier, more natural, and ethically sourced ingredients, influencing product formulation and consumer purchasing decisions. Competitive landscape analysis shows a mix of international players and regional businesses, indicating potential for both established brands and new entrants to thrive in this growing market. Growth will likely be concentrated in urban areas with higher levels of disposable income and health awareness.
MEA Gluten Free Food Industry: A Comprehensive Market Report (2019-2033)
This comprehensive report provides an in-depth analysis of the Middle East and Africa (MEA) gluten-free food industry, offering valuable insights for industry stakeholders, investors, and businesses seeking to navigate this rapidly expanding market. The report covers the period from 2019 to 2033, with 2025 serving as the base and estimated year. The forecast period spans 2025-2033, while the historical period encompasses 2019-2024. The market is segmented by type, end product, distribution channel, and country, providing a granular understanding of market dynamics. Key players analyzed include Vfoods (Violife), Orgran SA, General Mills Inc, The Hain Celestial Group Inc, Hunter Foods Limited FZCO, Dr Schar AG / SPA, Danone S A, and Probios S p A, although this list is not exhaustive. The total market size is estimated at $xx Million in 2025.
MEA Gluten Free Food Industry Market Concentration & Innovation
This section analyzes the MEA gluten-free food market's concentration, innovation drivers, regulatory landscape, product substitutes, end-user trends, and mergers & acquisitions (M&A) activities. The market is moderately concentrated, with the top 5 players holding an estimated xx% market share in 2025. Innovation is driven by increasing demand for healthier food options, rising prevalence of celiac disease and gluten intolerance, and advancements in gluten-free ingredient technology.
- Market Concentration: The Herfindahl-Hirschman Index (HHI) is estimated at xx in 2025.
- Innovation Drivers: Development of novel gluten-free ingredients, improved taste and texture of gluten-free products, and expansion into new product categories.
- Regulatory Framework: Varying regulations across MEA countries regarding labeling and food safety standards influence market dynamics.
- Product Substitutes: Traditional foods and other allergen-free alternatives pose competition.
- End-User Trends: Growing health consciousness and increasing disposable incomes are key drivers of market growth.
- M&A Activities: The report includes an analysis of significant M&A deals in the MEA gluten-free food industry during the historical period, with a total deal value estimated at $xx Million.
MEA Gluten Free Food Industry Industry Trends & Insights
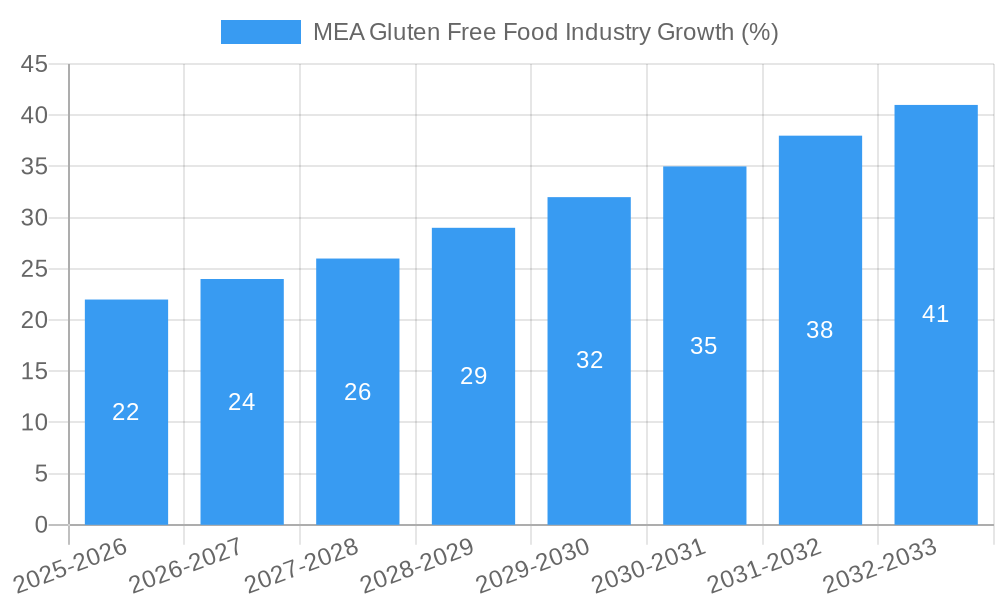
The MEA gluten-free food industry is experiencing robust growth, driven by several factors. The market is projected to witness a Compound Annual Growth Rate (CAGR) of xx% during the forecast period (2025-2033). This growth is fueled by the increasing prevalence of celiac disease and gluten intolerance, rising health awareness among consumers, increasing demand for convenient and ready-to-eat gluten-free products, and the growing adoption of online grocery shopping. Technological advancements in gluten-free food processing and ingredient development also contribute to market expansion. Competitive dynamics are shaped by new entrants, product differentiation, and pricing strategies. Market penetration for gluten-free products in the MEA region is steadily increasing, with an estimated xx% of the population actively seeking gluten-free alternatives in 2025.
Dominant Markets & Segments in MEA Gluten Free Food Industry
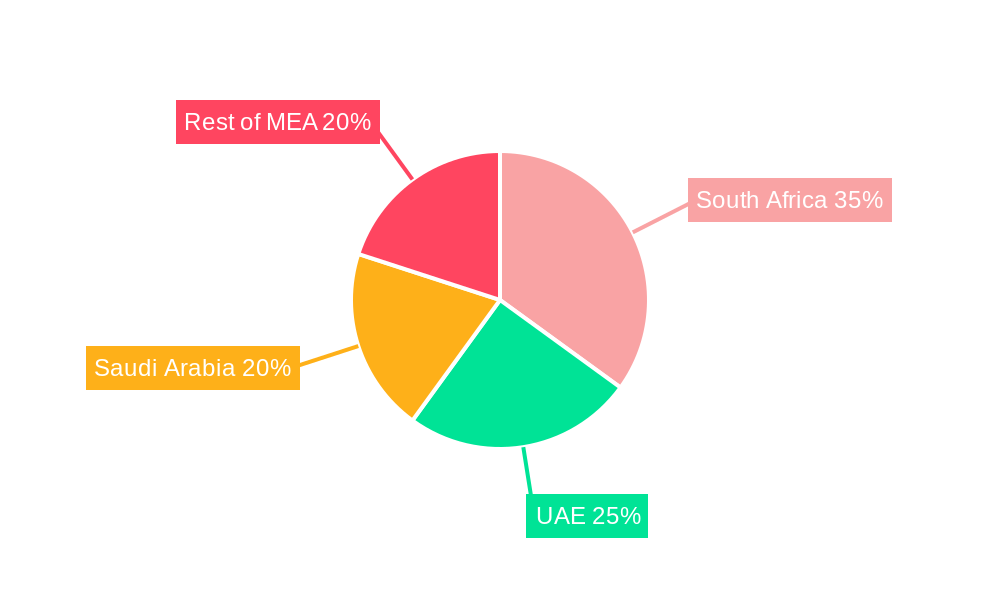
The United Arab Emirates (UAE) holds the largest market share within the MEA region, followed by Saudi Arabia and South Africa. This dominance is attributed to several factors:
- UAE: High disposable incomes, a large expatriate population with diverse dietary needs, and a strong focus on health and wellness.
- Saudi Arabia: Growing health consciousness and government initiatives promoting healthy eating habits.
- South Africa: Significant prevalence of celiac disease and gluten intolerance, combined with a growing middle class.
Dominant Segments:
- By Type: The gluten-free segment dominates, followed by dairy-free and allergen-free products.
- By End Product: Bakery and confectionery products hold the largest market share, followed by dairy-free foods and snacks.
- By Distribution Channel: Supermarkets/hypermarkets constitute the primary distribution channel, followed by online retail stores.
MEA Gluten Free Food Industry Product Developments
The MEA gluten-free food industry is witnessing significant product innovation, with companies focusing on improving the taste, texture, and nutritional value of gluten-free products. Technological advancements, such as the use of advanced processing techniques and novel gluten-free ingredients, are driving product diversification. Companies are also launching gluten-free versions of popular traditional foods to cater to growing consumer demand and expand market reach. This focus on product innovation enhances competitive advantage and caters to evolving consumer preferences.
Report Scope & Segmentation Analysis
This report provides a comprehensive segmentation analysis of the MEA gluten-free food industry across various parameters:
- By Type: Gluten-free, Dairy-free, Allergen-free, Other Types (Market size and growth projections for each type are included).
- By End Product: Bakery and Confectionery, Dairy-Free Foods, Snacks, Beverages, Other End Products (Market size and competitive dynamics for each end product are detailed).
- By Distribution Channel: Supermarkets/Hypermarkets, Online Retail Stores, Convenience Stores, Other Distribution Channels (Growth projections and market share for each distribution channel are provided).
- By Country: South Africa, United Arab Emirates, Saudi Arabia, Rest of Middle East and Africa (Detailed country-specific analysis, including market size and growth drivers).
Key Drivers of MEA Gluten Free Food Industry Growth
Several key factors drive the growth of the MEA gluten-free food industry. These include:
- Rising prevalence of celiac disease and gluten intolerance: A growing number of people are diagnosed with these conditions, increasing demand for gluten-free products.
- Increasing health awareness: Consumers are becoming more conscious of their dietary choices and are actively seeking healthier food options.
- Technological advancements: Innovations in gluten-free ingredient technology and food processing enhance product quality and expand product variety.
- Government initiatives and regulations: Policies supporting the development of the food industry and promoting healthy eating habits contribute to market growth.
Challenges in the MEA Gluten Free Food Industry Sector
Despite strong growth potential, the MEA gluten-free food industry faces challenges, including:
- High production costs: Gluten-free ingredients are often more expensive than their conventional counterparts, leading to higher product prices.
- Limited availability of raw materials: Sourcing high-quality gluten-free ingredients can be challenging in some MEA countries.
- Stringent regulations: Compliance with food safety and labeling regulations can be complex and costly.
- Intense competition: The market is becoming increasingly competitive, with both established players and new entrants vying for market share.
Emerging Opportunities in MEA Gluten Free Food Industry
The MEA gluten-free food industry presents significant opportunities for growth.
- Expansion into new product categories: Developing innovative gluten-free products tailored to specific dietary needs.
- Growth of online retail: Leveraging e-commerce platforms to reach a wider customer base.
- Focus on functional foods: Developing gluten-free products with added health benefits.
- Product diversification: Offering a wider range of gluten-free products to meet diverse consumer preferences.
Leading Players in the MEA Gluten Free Food Industry Market
- Vfoods (Violife)
- Orgran SA
- General Mills Inc
- The Hain Celestial Group Inc
- Hunter Foods Limited FZCO
- Dr Schar AG / SPA
- Danone S A
- Probios S p A
Key Developments in MEA Gluten Free Food Industry Industry
- 2022 Q4: Launch of a new line of gluten-free snacks by a major food company in the UAE.
- 2023 Q1: Acquisition of a regional gluten-free bakery by a multinational food conglomerate.
- 2023 Q3: Introduction of stricter labeling regulations for gluten-free products in Saudi Arabia.
Strategic Outlook for MEA Gluten Free Food Industry Market
The MEA gluten-free food market is poised for continued growth, driven by increasing consumer demand and favorable market dynamics. Opportunities for expansion exist in untapped markets, product diversification, and strategic partnerships. Companies that embrace innovation, adapt to evolving consumer preferences, and strategically navigate regulatory frameworks will be well-positioned for success in this dynamic market. The forecast projects a substantial market expansion over the next decade, representing significant potential for both established players and new entrants.
MEA Gluten Free Food Industry Segmentation
-
1. Type
- 1.1. Gluten Free
- 1.2. Dairy Free
- 1.3. Allergen Free
- 1.4. Other Types
-
2. End Product
- 2.1. Bakery and Confectionery
- 2.2. Dairy Free Foods
- 2.3. Snacks
- 2.4. Beverages
- 2.5. Other End Products
-
3. Distribution Channel
- 3.1. Supermarkets/Hypermarkets
- 3.2. Online Retail Stores
- 3.3. Convenience Stores
- 3.4. Other Distribution Channels
MEA Gluten Free Food Industry Segmentation By Geography
-
1. North America
- 1.1. United States
- 1.2. Canada
- 1.3. Mexico
-
2. South America
- 2.1. Brazil
- 2.2. Argentina
- 2.3. Rest of South America
-
3. Europe
- 3.1. United Kingdom
- 3.2. Germany
- 3.3. France
- 3.4. Italy
- 3.5. Spain
- 3.6. Russia
- 3.7. Benelux
- 3.8. Nordics
- 3.9. Rest of Europe
-
4. Middle East & Africa
- 4.1. Turkey
- 4.2. Israel
- 4.3. GCC
- 4.4. North Africa
- 4.5. South Africa
- 4.6. Rest of Middle East & Africa
-
5. Asia Pacific
- 5.1. China
- 5.2. India
- 5.3. Japan
- 5.4. South Korea
- 5.5. ASEAN
- 5.6. Oceania
- 5.7. Rest of Asia Pacific
MEA Gluten Free Food Industry REPORT HIGHLIGHTS
| Aspects | Details |
|---|---|
| Study Period | 2019-2033 |
| Base Year | 2024 |
| Estimated Year | 2025 |
| Forecast Period | 2025-2033 |
| Historical Period | 2019-2024 |
| Growth Rate | CAGR of 8.00% from 2019-2033 |
| Segmentation |
|
Table of Contents
- 1. Introduction
- 1.1. Research Scope
- 1.2. Market Segmentation
- 1.3. Research Methodology
- 1.4. Definitions and Assumptions
- 2. Executive Summary
- 2.1. Introduction
- 3. Market Dynamics
- 3.1. Introduction
- 3.2. Market Drivers
- 3.2.1. Increasing Health Concerns are Supporting the Market's Growth; Growing Consumer Preference for Convenience Seafood
- 3.3. Market Restrains
- 3.3.1. Rising Concern About Quality and Safety Standards of Canned Tuna
- 3.4. Market Trends
- 3.4.1. Rising Awareness on Clean Labeling in Africa
- 4. Market Factor Analysis
- 4.1. Porters Five Forces
- 4.2. Supply/Value Chain
- 4.3. PESTEL analysis
- 4.4. Market Entropy
- 4.5. Patent/Trademark Analysis
- 5. Global MEA Gluten Free Food Industry Analysis, Insights and Forecast, 2019-2031
- 5.1. Market Analysis, Insights and Forecast - by Type
- 5.1.1. Gluten Free
- 5.1.2. Dairy Free
- 5.1.3. Allergen Free
- 5.1.4. Other Types
- 5.2. Market Analysis, Insights and Forecast - by End Product
- 5.2.1. Bakery and Confectionery
- 5.2.2. Dairy Free Foods
- 5.2.3. Snacks
- 5.2.4. Beverages
- 5.2.5. Other End Products
- 5.3. Market Analysis, Insights and Forecast - by Distribution Channel
- 5.3.1. Supermarkets/Hypermarkets
- 5.3.2. Online Retail Stores
- 5.3.3. Convenience Stores
- 5.3.4. Other Distribution Channels
- 5.4. Market Analysis, Insights and Forecast - by Region
- 5.4.1. North America
- 5.4.2. South America
- 5.4.3. Europe
- 5.4.4. Middle East & Africa
- 5.4.5. Asia Pacific
- 5.1. Market Analysis, Insights and Forecast - by Type
- 6. North America MEA Gluten Free Food Industry Analysis, Insights and Forecast, 2019-2031
- 6.1. Market Analysis, Insights and Forecast - by Type
- 6.1.1. Gluten Free
- 6.1.2. Dairy Free
- 6.1.3. Allergen Free
- 6.1.4. Other Types
- 6.2. Market Analysis, Insights and Forecast - by End Product
- 6.2.1. Bakery and Confectionery
- 6.2.2. Dairy Free Foods
- 6.2.3. Snacks
- 6.2.4. Beverages
- 6.2.5. Other End Products
- 6.3. Market Analysis, Insights and Forecast - by Distribution Channel
- 6.3.1. Supermarkets/Hypermarkets
- 6.3.2. Online Retail Stores
- 6.3.3. Convenience Stores
- 6.3.4. Other Distribution Channels
- 6.1. Market Analysis, Insights and Forecast - by Type
- 7. South America MEA Gluten Free Food Industry Analysis, Insights and Forecast, 2019-2031
- 7.1. Market Analysis, Insights and Forecast - by Type
- 7.1.1. Gluten Free
- 7.1.2. Dairy Free
- 7.1.3. Allergen Free
- 7.1.4. Other Types
- 7.2. Market Analysis, Insights and Forecast - by End Product
- 7.2.1. Bakery and Confectionery
- 7.2.2. Dairy Free Foods
- 7.2.3. Snacks
- 7.2.4. Beverages
- 7.2.5. Other End Products
- 7.3. Market Analysis, Insights and Forecast - by Distribution Channel
- 7.3.1. Supermarkets/Hypermarkets
- 7.3.2. Online Retail Stores
- 7.3.3. Convenience Stores
- 7.3.4. Other Distribution Channels
- 7.1. Market Analysis, Insights and Forecast - by Type
- 8. Europe MEA Gluten Free Food Industry Analysis, Insights and Forecast, 2019-2031
- 8.1. Market Analysis, Insights and Forecast - by Type
- 8.1.1. Gluten Free
- 8.1.2. Dairy Free
- 8.1.3. Allergen Free
- 8.1.4. Other Types
- 8.2. Market Analysis, Insights and Forecast - by End Product
- 8.2.1. Bakery and Confectionery
- 8.2.2. Dairy Free Foods
- 8.2.3. Snacks
- 8.2.4. Beverages
- 8.2.5. Other End Products
- 8.3. Market Analysis, Insights and Forecast - by Distribution Channel
- 8.3.1. Supermarkets/Hypermarkets
- 8.3.2. Online Retail Stores
- 8.3.3. Convenience Stores
- 8.3.4. Other Distribution Channels
- 8.1. Market Analysis, Insights and Forecast - by Type
- 9. Middle East & Africa MEA Gluten Free Food Industry Analysis, Insights and Forecast, 2019-2031
- 9.1. Market Analysis, Insights and Forecast - by Type
- 9.1.1. Gluten Free
- 9.1.2. Dairy Free
- 9.1.3. Allergen Free
- 9.1.4. Other Types
- 9.2. Market Analysis, Insights and Forecast - by End Product
- 9.2.1. Bakery and Confectionery
- 9.2.2. Dairy Free Foods
- 9.2.3. Snacks
- 9.2.4. Beverages
- 9.2.5. Other End Products
- 9.3. Market Analysis, Insights and Forecast - by Distribution Channel
- 9.3.1. Supermarkets/Hypermarkets
- 9.3.2. Online Retail Stores
- 9.3.3. Convenience Stores
- 9.3.4. Other Distribution Channels
- 9.1. Market Analysis, Insights and Forecast - by Type
- 10. Asia Pacific MEA Gluten Free Food Industry Analysis, Insights and Forecast, 2019-2031
- 10.1. Market Analysis, Insights and Forecast - by Type
- 10.1.1. Gluten Free
- 10.1.2. Dairy Free
- 10.1.3. Allergen Free
- 10.1.4. Other Types
- 10.2. Market Analysis, Insights and Forecast - by End Product
- 10.2.1. Bakery and Confectionery
- 10.2.2. Dairy Free Foods
- 10.2.3. Snacks
- 10.2.4. Beverages
- 10.2.5. Other End Products
- 10.3. Market Analysis, Insights and Forecast - by Distribution Channel
- 10.3.1. Supermarkets/Hypermarkets
- 10.3.2. Online Retail Stores
- 10.3.3. Convenience Stores
- 10.3.4. Other Distribution Channels
- 10.1. Market Analysis, Insights and Forecast - by Type
- 11. North America MEA Gluten Free Food Industry Analysis, Insights and Forecast, 2019-2031
- 11.1. Market Analysis, Insights and Forecast - By Country/Sub-region
- 11.1.1 United States
- 11.1.2 Canada
- 11.1.3 Mexico
- 12. Europe MEA Gluten Free Food Industry Analysis, Insights and Forecast, 2019-2031
- 12.1. Market Analysis, Insights and Forecast - By Country/Sub-region
- 12.1.1 Germany
- 12.1.2 United Kingdom
- 12.1.3 France
- 12.1.4 Spain
- 12.1.5 Italy
- 12.1.6 Spain
- 12.1.7 Belgium
- 12.1.8 Netherland
- 12.1.9 Nordics
- 12.1.10 Rest of Europe
- 13. Asia Pacific MEA Gluten Free Food Industry Analysis, Insights and Forecast, 2019-2031
- 13.1. Market Analysis, Insights and Forecast - By Country/Sub-region
- 13.1.1 China
- 13.1.2 Japan
- 13.1.3 India
- 13.1.4 South Korea
- 13.1.5 Southeast Asia
- 13.1.6 Australia
- 13.1.7 Indonesia
- 13.1.8 Phillipes
- 13.1.9 Singapore
- 13.1.10 Thailandc
- 13.1.11 Rest of Asia Pacific
- 14. South America MEA Gluten Free Food Industry Analysis, Insights and Forecast, 2019-2031
- 14.1. Market Analysis, Insights and Forecast - By Country/Sub-region
- 14.1.1 Brazil
- 14.1.2 Argentina
- 14.1.3 Peru
- 14.1.4 Chile
- 14.1.5 Colombia
- 14.1.6 Ecuador
- 14.1.7 Venezuela
- 14.1.8 Rest of South America
- 15. North America MEA Gluten Free Food Industry Analysis, Insights and Forecast, 2019-2031
- 15.1. Market Analysis, Insights and Forecast - By Country/Sub-region
- 15.1.1 United States
- 15.1.2 Canada
- 15.1.3 Mexico
- 16. MEA MEA Gluten Free Food Industry Analysis, Insights and Forecast, 2019-2031
- 16.1. Market Analysis, Insights and Forecast - By Country/Sub-region
- 16.1.1 United Arab Emirates
- 16.1.2 Saudi Arabia
- 16.1.3 South Africa
- 16.1.4 Rest of Middle East and Africa
- 17. Competitive Analysis
- 17.1. Global Market Share Analysis 2024
- 17.2. Company Profiles
- 17.2.1 Vfoods (Violife)
- 17.2.1.1. Overview
- 17.2.1.2. Products
- 17.2.1.3. SWOT Analysis
- 17.2.1.4. Recent Developments
- 17.2.1.5. Financials (Based on Availability)
- 17.2.2 Orgran SA
- 17.2.2.1. Overview
- 17.2.2.2. Products
- 17.2.2.3. SWOT Analysis
- 17.2.2.4. Recent Developments
- 17.2.2.5. Financials (Based on Availability)
- 17.2.3 General Mills Inc
- 17.2.3.1. Overview
- 17.2.3.2. Products
- 17.2.3.3. SWOT Analysis
- 17.2.3.4. Recent Developments
- 17.2.3.5. Financials (Based on Availability)
- 17.2.4 The Hain Celestial Group Inc
- 17.2.4.1. Overview
- 17.2.4.2. Products
- 17.2.4.3. SWOT Analysis
- 17.2.4.4. Recent Developments
- 17.2.4.5. Financials (Based on Availability)
- 17.2.5 Hunter Foods Limited FZCO
- 17.2.5.1. Overview
- 17.2.5.2. Products
- 17.2.5.3. SWOT Analysis
- 17.2.5.4. Recent Developments
- 17.2.5.5. Financials (Based on Availability)
- 17.2.6 Dr Schar AG / SPA
- 17.2.6.1. Overview
- 17.2.6.2. Products
- 17.2.6.3. SWOT Analysis
- 17.2.6.4. Recent Developments
- 17.2.6.5. Financials (Based on Availability)
- 17.2.7 Danone S A
- 17.2.7.1. Overview
- 17.2.7.2. Products
- 17.2.7.3. SWOT Analysis
- 17.2.7.4. Recent Developments
- 17.2.7.5. Financials (Based on Availability)
- 17.2.8 Probios S p Aa*List Not Exhaustive
- 17.2.8.1. Overview
- 17.2.8.2. Products
- 17.2.8.3. SWOT Analysis
- 17.2.8.4. Recent Developments
- 17.2.8.5. Financials (Based on Availability)
- 17.2.1 Vfoods (Violife)
List of Figures
- Figure 1: Global MEA Gluten Free Food Industry Revenue Breakdown (Million, %) by Region 2024 & 2032
- Figure 2: North America MEA Gluten Free Food Industry Revenue (Million), by Country 2024 & 2032
- Figure 3: North America MEA Gluten Free Food Industry Revenue Share (%), by Country 2024 & 2032
- Figure 4: Europe MEA Gluten Free Food Industry Revenue (Million), by Country 2024 & 2032
- Figure 5: Europe MEA Gluten Free Food Industry Revenue Share (%), by Country 2024 & 2032
- Figure 6: Asia Pacific MEA Gluten Free Food Industry Revenue (Million), by Country 2024 & 2032
- Figure 7: Asia Pacific MEA Gluten Free Food Industry Revenue Share (%), by Country 2024 & 2032
- Figure 8: South America MEA Gluten Free Food Industry Revenue (Million), by Country 2024 & 2032
- Figure 9: South America MEA Gluten Free Food Industry Revenue Share (%), by Country 2024 & 2032
- Figure 10: North America MEA Gluten Free Food Industry Revenue (Million), by Country 2024 & 2032
- Figure 11: North America MEA Gluten Free Food Industry Revenue Share (%), by Country 2024 & 2032
- Figure 12: MEA MEA Gluten Free Food Industry Revenue (Million), by Country 2024 & 2032
- Figure 13: MEA MEA Gluten Free Food Industry Revenue Share (%), by Country 2024 & 2032
- Figure 14: North America MEA Gluten Free Food Industry Revenue (Million), by Type 2024 & 2032
- Figure 15: North America MEA Gluten Free Food Industry Revenue Share (%), by Type 2024 & 2032
- Figure 16: North America MEA Gluten Free Food Industry Revenue (Million), by End Product 2024 & 2032
- Figure 17: North America MEA Gluten Free Food Industry Revenue Share (%), by End Product 2024 & 2032
- Figure 18: North America MEA Gluten Free Food Industry Revenue (Million), by Distribution Channel 2024 & 2032
- Figure 19: North America MEA Gluten Free Food Industry Revenue Share (%), by Distribution Channel 2024 & 2032
- Figure 20: North America MEA Gluten Free Food Industry Revenue (Million), by Country 2024 & 2032
- Figure 21: North America MEA Gluten Free Food Industry Revenue Share (%), by Country 2024 & 2032
- Figure 22: South America MEA Gluten Free Food Industry Revenue (Million), by Type 2024 & 2032
- Figure 23: South America MEA Gluten Free Food Industry Revenue Share (%), by Type 2024 & 2032
- Figure 24: South America MEA Gluten Free Food Industry Revenue (Million), by End Product 2024 & 2032
- Figure 25: South America MEA Gluten Free Food Industry Revenue Share (%), by End Product 2024 & 2032
- Figure 26: South America MEA Gluten Free Food Industry Revenue (Million), by Distribution Channel 2024 & 2032
- Figure 27: South America MEA Gluten Free Food Industry Revenue Share (%), by Distribution Channel 2024 & 2032
- Figure 28: South America MEA Gluten Free Food Industry Revenue (Million), by Country 2024 & 2032
- Figure 29: South America MEA Gluten Free Food Industry Revenue Share (%), by Country 2024 & 2032
- Figure 30: Europe MEA Gluten Free Food Industry Revenue (Million), by Type 2024 & 2032
- Figure 31: Europe MEA Gluten Free Food Industry Revenue Share (%), by Type 2024 & 2032
- Figure 32: Europe MEA Gluten Free Food Industry Revenue (Million), by End Product 2024 & 2032
- Figure 33: Europe MEA Gluten Free Food Industry Revenue Share (%), by End Product 2024 & 2032
- Figure 34: Europe MEA Gluten Free Food Industry Revenue (Million), by Distribution Channel 2024 & 2032
- Figure 35: Europe MEA Gluten Free Food Industry Revenue Share (%), by Distribution Channel 2024 & 2032
- Figure 36: Europe MEA Gluten Free Food Industry Revenue (Million), by Country 2024 & 2032
- Figure 37: Europe MEA Gluten Free Food Industry Revenue Share (%), by Country 2024 & 2032
- Figure 38: Middle East & Africa MEA Gluten Free Food Industry Revenue (Million), by Type 2024 & 2032
- Figure 39: Middle East & Africa MEA Gluten Free Food Industry Revenue Share (%), by Type 2024 & 2032
- Figure 40: Middle East & Africa MEA Gluten Free Food Industry Revenue (Million), by End Product 2024 & 2032
- Figure 41: Middle East & Africa MEA Gluten Free Food Industry Revenue Share (%), by End Product 2024 & 2032
- Figure 42: Middle East & Africa MEA Gluten Free Food Industry Revenue (Million), by Distribution Channel 2024 & 2032
- Figure 43: Middle East & Africa MEA Gluten Free Food Industry Revenue Share (%), by Distribution Channel 2024 & 2032
- Figure 44: Middle East & Africa MEA Gluten Free Food Industry Revenue (Million), by Country 2024 & 2032
- Figure 45: Middle East & Africa MEA Gluten Free Food Industry Revenue Share (%), by Country 2024 & 2032
- Figure 46: Asia Pacific MEA Gluten Free Food Industry Revenue (Million), by Type 2024 & 2032
- Figure 47: Asia Pacific MEA Gluten Free Food Industry Revenue Share (%), by Type 2024 & 2032
- Figure 48: Asia Pacific MEA Gluten Free Food Industry Revenue (Million), by End Product 2024 & 2032
- Figure 49: Asia Pacific MEA Gluten Free Food Industry Revenue Share (%), by End Product 2024 & 2032
- Figure 50: Asia Pacific MEA Gluten Free Food Industry Revenue (Million), by Distribution Channel 2024 & 2032
- Figure 51: Asia Pacific MEA Gluten Free Food Industry Revenue Share (%), by Distribution Channel 2024 & 2032
- Figure 52: Asia Pacific MEA Gluten Free Food Industry Revenue (Million), by Country 2024 & 2032
- Figure 53: Asia Pacific MEA Gluten Free Food Industry Revenue Share (%), by Country 2024 & 2032
List of Tables
- Table 1: Global MEA Gluten Free Food Industry Revenue Million Forecast, by Region 2019 & 2032
- Table 2: Global MEA Gluten Free Food Industry Revenue Million Forecast, by Type 2019 & 2032
- Table 3: Global MEA Gluten Free Food Industry Revenue Million Forecast, by End Product 2019 & 2032
- Table 4: Global MEA Gluten Free Food Industry Revenue Million Forecast, by Distribution Channel 2019 & 2032
- Table 5: Global MEA Gluten Free Food Industry Revenue Million Forecast, by Region 2019 & 2032
- Table 6: Global MEA Gluten Free Food Industry Revenue Million Forecast, by Country 2019 & 2032
- Table 7: United States MEA Gluten Free Food Industry Revenue (Million) Forecast, by Application 2019 & 2032
- Table 8: Canada MEA Gluten Free Food Industry Revenue (Million) Forecast, by Application 2019 & 2032
- Table 9: Mexico MEA Gluten Free Food Industry Revenue (Million) Forecast, by Application 2019 & 2032
- Table 10: Global MEA Gluten Free Food Industry Revenue Million Forecast, by Country 2019 & 2032
- Table 11: Germany MEA Gluten Free Food Industry Revenue (Million) Forecast, by Application 2019 & 2032
- Table 12: United Kingdom MEA Gluten Free Food Industry Revenue (Million) Forecast, by Application 2019 & 2032
- Table 13: France MEA Gluten Free Food Industry Revenue (Million) Forecast, by Application 2019 & 2032
- Table 14: Spain MEA Gluten Free Food Industry Revenue (Million) Forecast, by Application 2019 & 2032
- Table 15: Italy MEA Gluten Free Food Industry Revenue (Million) Forecast, by Application 2019 & 2032
- Table 16: Spain MEA Gluten Free Food Industry Revenue (Million) Forecast, by Application 2019 & 2032
- Table 17: Belgium MEA Gluten Free Food Industry Revenue (Million) Forecast, by Application 2019 & 2032
- Table 18: Netherland MEA Gluten Free Food Industry Revenue (Million) Forecast, by Application 2019 & 2032
- Table 19: Nordics MEA Gluten Free Food Industry Revenue (Million) Forecast, by Application 2019 & 2032
- Table 20: Rest of Europe MEA Gluten Free Food Industry Revenue (Million) Forecast, by Application 2019 & 2032
- Table 21: Global MEA Gluten Free Food Industry Revenue Million Forecast, by Country 2019 & 2032
- Table 22: China MEA Gluten Free Food Industry Revenue (Million) Forecast, by Application 2019 & 2032
- Table 23: Japan MEA Gluten Free Food Industry Revenue (Million) Forecast, by Application 2019 & 2032
- Table 24: India MEA Gluten Free Food Industry Revenue (Million) Forecast, by Application 2019 & 2032
- Table 25: South Korea MEA Gluten Free Food Industry Revenue (Million) Forecast, by Application 2019 & 2032
- Table 26: Southeast Asia MEA Gluten Free Food Industry Revenue (Million) Forecast, by Application 2019 & 2032
- Table 27: Australia MEA Gluten Free Food Industry Revenue (Million) Forecast, by Application 2019 & 2032
- Table 28: Indonesia MEA Gluten Free Food Industry Revenue (Million) Forecast, by Application 2019 & 2032
- Table 29: Phillipes MEA Gluten Free Food Industry Revenue (Million) Forecast, by Application 2019 & 2032
- Table 30: Singapore MEA Gluten Free Food Industry Revenue (Million) Forecast, by Application 2019 & 2032
- Table 31: Thailandc MEA Gluten Free Food Industry Revenue (Million) Forecast, by Application 2019 & 2032
- Table 32: Rest of Asia Pacific MEA Gluten Free Food Industry Revenue (Million) Forecast, by Application 2019 & 2032
- Table 33: Global MEA Gluten Free Food Industry Revenue Million Forecast, by Country 2019 & 2032
- Table 34: Brazil MEA Gluten Free Food Industry Revenue (Million) Forecast, by Application 2019 & 2032
- Table 35: Argentina MEA Gluten Free Food Industry Revenue (Million) Forecast, by Application 2019 & 2032
- Table 36: Peru MEA Gluten Free Food Industry Revenue (Million) Forecast, by Application 2019 & 2032
- Table 37: Chile MEA Gluten Free Food Industry Revenue (Million) Forecast, by Application 2019 & 2032
- Table 38: Colombia MEA Gluten Free Food Industry Revenue (Million) Forecast, by Application 2019 & 2032
- Table 39: Ecuador MEA Gluten Free Food Industry Revenue (Million) Forecast, by Application 2019 & 2032
- Table 40: Venezuela MEA Gluten Free Food Industry Revenue (Million) Forecast, by Application 2019 & 2032
- Table 41: Rest of South America MEA Gluten Free Food Industry Revenue (Million) Forecast, by Application 2019 & 2032
- Table 42: Global MEA Gluten Free Food Industry Revenue Million Forecast, by Country 2019 & 2032
- Table 43: United States MEA Gluten Free Food Industry Revenue (Million) Forecast, by Application 2019 & 2032
- Table 44: Canada MEA Gluten Free Food Industry Revenue (Million) Forecast, by Application 2019 & 2032
- Table 45: Mexico MEA Gluten Free Food Industry Revenue (Million) Forecast, by Application 2019 & 2032
- Table 46: Global MEA Gluten Free Food Industry Revenue Million Forecast, by Country 2019 & 2032
- Table 47: United Arab Emirates MEA Gluten Free Food Industry Revenue (Million) Forecast, by Application 2019 & 2032
- Table 48: Saudi Arabia MEA Gluten Free Food Industry Revenue (Million) Forecast, by Application 2019 & 2032
- Table 49: South Africa MEA Gluten Free Food Industry Revenue (Million) Forecast, by Application 2019 & 2032
- Table 50: Rest of Middle East and Africa MEA Gluten Free Food Industry Revenue (Million) Forecast, by Application 2019 & 2032
- Table 51: Global MEA Gluten Free Food Industry Revenue Million Forecast, by Type 2019 & 2032
- Table 52: Global MEA Gluten Free Food Industry Revenue Million Forecast, by End Product 2019 & 2032
- Table 53: Global MEA Gluten Free Food Industry Revenue Million Forecast, by Distribution Channel 2019 & 2032
- Table 54: Global MEA Gluten Free Food Industry Revenue Million Forecast, by Country 2019 & 2032
- Table 55: United States MEA Gluten Free Food Industry Revenue (Million) Forecast, by Application 2019 & 2032
- Table 56: Canada MEA Gluten Free Food Industry Revenue (Million) Forecast, by Application 2019 & 2032
- Table 57: Mexico MEA Gluten Free Food Industry Revenue (Million) Forecast, by Application 2019 & 2032
- Table 58: Global MEA Gluten Free Food Industry Revenue Million Forecast, by Type 2019 & 2032
- Table 59: Global MEA Gluten Free Food Industry Revenue Million Forecast, by End Product 2019 & 2032
- Table 60: Global MEA Gluten Free Food Industry Revenue Million Forecast, by Distribution Channel 2019 & 2032
- Table 61: Global MEA Gluten Free Food Industry Revenue Million Forecast, by Country 2019 & 2032
- Table 62: Brazil MEA Gluten Free Food Industry Revenue (Million) Forecast, by Application 2019 & 2032
- Table 63: Argentina MEA Gluten Free Food Industry Revenue (Million) Forecast, by Application 2019 & 2032
- Table 64: Rest of South America MEA Gluten Free Food Industry Revenue (Million) Forecast, by Application 2019 & 2032
- Table 65: Global MEA Gluten Free Food Industry Revenue Million Forecast, by Type 2019 & 2032
- Table 66: Global MEA Gluten Free Food Industry Revenue Million Forecast, by End Product 2019 & 2032
- Table 67: Global MEA Gluten Free Food Industry Revenue Million Forecast, by Distribution Channel 2019 & 2032
- Table 68: Global MEA Gluten Free Food Industry Revenue Million Forecast, by Country 2019 & 2032
- Table 69: United Kingdom MEA Gluten Free Food Industry Revenue (Million) Forecast, by Application 2019 & 2032
- Table 70: Germany MEA Gluten Free Food Industry Revenue (Million) Forecast, by Application 2019 & 2032
- Table 71: France MEA Gluten Free Food Industry Revenue (Million) Forecast, by Application 2019 & 2032
- Table 72: Italy MEA Gluten Free Food Industry Revenue (Million) Forecast, by Application 2019 & 2032
- Table 73: Spain MEA Gluten Free Food Industry Revenue (Million) Forecast, by Application 2019 & 2032
- Table 74: Russia MEA Gluten Free Food Industry Revenue (Million) Forecast, by Application 2019 & 2032
- Table 75: Benelux MEA Gluten Free Food Industry Revenue (Million) Forecast, by Application 2019 & 2032
- Table 76: Nordics MEA Gluten Free Food Industry Revenue (Million) Forecast, by Application 2019 & 2032
- Table 77: Rest of Europe MEA Gluten Free Food Industry Revenue (Million) Forecast, by Application 2019 & 2032
- Table 78: Global MEA Gluten Free Food Industry Revenue Million Forecast, by Type 2019 & 2032
- Table 79: Global MEA Gluten Free Food Industry Revenue Million Forecast, by End Product 2019 & 2032
- Table 80: Global MEA Gluten Free Food Industry Revenue Million Forecast, by Distribution Channel 2019 & 2032
- Table 81: Global MEA Gluten Free Food Industry Revenue Million Forecast, by Country 2019 & 2032
- Table 82: Turkey MEA Gluten Free Food Industry Revenue (Million) Forecast, by Application 2019 & 2032
- Table 83: Israel MEA Gluten Free Food Industry Revenue (Million) Forecast, by Application 2019 & 2032
- Table 84: GCC MEA Gluten Free Food Industry Revenue (Million) Forecast, by Application 2019 & 2032
- Table 85: North Africa MEA Gluten Free Food Industry Revenue (Million) Forecast, by Application 2019 & 2032
- Table 86: South Africa MEA Gluten Free Food Industry Revenue (Million) Forecast, by Application 2019 & 2032
- Table 87: Rest of Middle East & Africa MEA Gluten Free Food Industry Revenue (Million) Forecast, by Application 2019 & 2032
- Table 88: Global MEA Gluten Free Food Industry Revenue Million Forecast, by Type 2019 & 2032
- Table 89: Global MEA Gluten Free Food Industry Revenue Million Forecast, by End Product 2019 & 2032
- Table 90: Global MEA Gluten Free Food Industry Revenue Million Forecast, by Distribution Channel 2019 & 2032
- Table 91: Global MEA Gluten Free Food Industry Revenue Million Forecast, by Country 2019 & 2032
- Table 92: China MEA Gluten Free Food Industry Revenue (Million) Forecast, by Application 2019 & 2032
- Table 93: India MEA Gluten Free Food Industry Revenue (Million) Forecast, by Application 2019 & 2032
- Table 94: Japan MEA Gluten Free Food Industry Revenue (Million) Forecast, by Application 2019 & 2032
- Table 95: South Korea MEA Gluten Free Food Industry Revenue (Million) Forecast, by Application 2019 & 2032
- Table 96: ASEAN MEA Gluten Free Food Industry Revenue (Million) Forecast, by Application 2019 & 2032
- Table 97: Oceania MEA Gluten Free Food Industry Revenue (Million) Forecast, by Application 2019 & 2032
- Table 98: Rest of Asia Pacific MEA Gluten Free Food Industry Revenue (Million) Forecast, by Application 2019 & 2032
Frequently Asked Questions
1. What is the projected Compound Annual Growth Rate (CAGR) of the MEA Gluten Free Food Industry?
The projected CAGR is approximately 8.00%.
2. Which companies are prominent players in the MEA Gluten Free Food Industry?
Key companies in the market include Vfoods (Violife), Orgran SA, General Mills Inc, The Hain Celestial Group Inc, Hunter Foods Limited FZCO, Dr Schar AG / SPA, Danone S A, Probios S p Aa*List Not Exhaustive.
3. What are the main segments of the MEA Gluten Free Food Industry?
The market segments include Type, End Product, Distribution Channel.
4. Can you provide details about the market size?
The market size is estimated to be USD XX Million as of 2022.
5. What are some drivers contributing to market growth?
Increasing Health Concerns are Supporting the Market's Growth; Growing Consumer Preference for Convenience Seafood.
6. What are the notable trends driving market growth?
Rising Awareness on Clean Labeling in Africa.
7. Are there any restraints impacting market growth?
Rising Concern About Quality and Safety Standards of Canned Tuna.
8. Can you provide examples of recent developments in the market?
N/A
9. What pricing options are available for accessing the report?
Pricing options include single-user, multi-user, and enterprise licenses priced at USD 4750, USD 5250, and USD 8750 respectively.
10. Is the market size provided in terms of value or volume?
The market size is provided in terms of value, measured in Million.
11. Are there any specific market keywords associated with the report?
Yes, the market keyword associated with the report is "MEA Gluten Free Food Industry," which aids in identifying and referencing the specific market segment covered.
12. How do I determine which pricing option suits my needs best?
The pricing options vary based on user requirements and access needs. Individual users may opt for single-user licenses, while businesses requiring broader access may choose multi-user or enterprise licenses for cost-effective access to the report.
13. Are there any additional resources or data provided in the MEA Gluten Free Food Industry report?
While the report offers comprehensive insights, it's advisable to review the specific contents or supplementary materials provided to ascertain if additional resources or data are available.
14. How can I stay updated on further developments or reports in the MEA Gluten Free Food Industry?
To stay informed about further developments, trends, and reports in the MEA Gluten Free Food Industry, consider subscribing to industry newsletters, following relevant companies and organizations, or regularly checking reputable industry news sources and publications.
Methodology
Step 1 - Identification of Relevant Samples Size from Population Database


Step 2 - Approaches for Defining Global Market Size (Value, Volume* & Price*)

Note*: In applicable scenarios
Step 3 - Data Sources
Primary Research
- Web Analytics
- Survey Reports
- Research Institute
- Latest Research Reports
- Opinion Leaders
Secondary Research
- Annual Reports
- White Paper
- Latest Press Release
- Industry Association
- Paid Database
- Investor Presentations

Step 4 - Data Triangulation
Involves using different sources of information in order to increase the validity of a study
These sources are likely to be stakeholders in a program - participants, other researchers, program staff, other community members, and so on.
Then we put all data in single framework & apply various statistical tools to find out the dynamic on the market.
During the analysis stage, feedback from the stakeholder groups would be compared to determine areas of agreement as well as areas of divergence


