

Key Insights
The Middle East and Africa (MEA) Membrane Water Treatment Chemicals market is poised for substantial growth, fueled by escalating water scarcity, stringent environmental mandates, and the expansion of desalination and industrial sectors across the region. Projections indicate a Compound Annual Growth Rate (CAGR) of 6.1%, underscoring a significant upward trend. Key growth drivers include a burgeoning population, rapid industrialization, and increasing demand for potable water in water-stressed nations. Government initiatives promoting water conservation and desalination further propel market expansion. Growth is expected in pretreatment chemicals, vital for membrane performance and longevity, and biological controllers addressing biofouling. Major end-users include the food and beverage processing, desalination, and power generation industries, highlighting the market's diverse applications. While challenges such as fluctuating raw material costs and continuous investment in technological advancements exist, the market outlook remains robust, supported by the increasing adoption of advanced membrane technologies and sustainable water management practices.
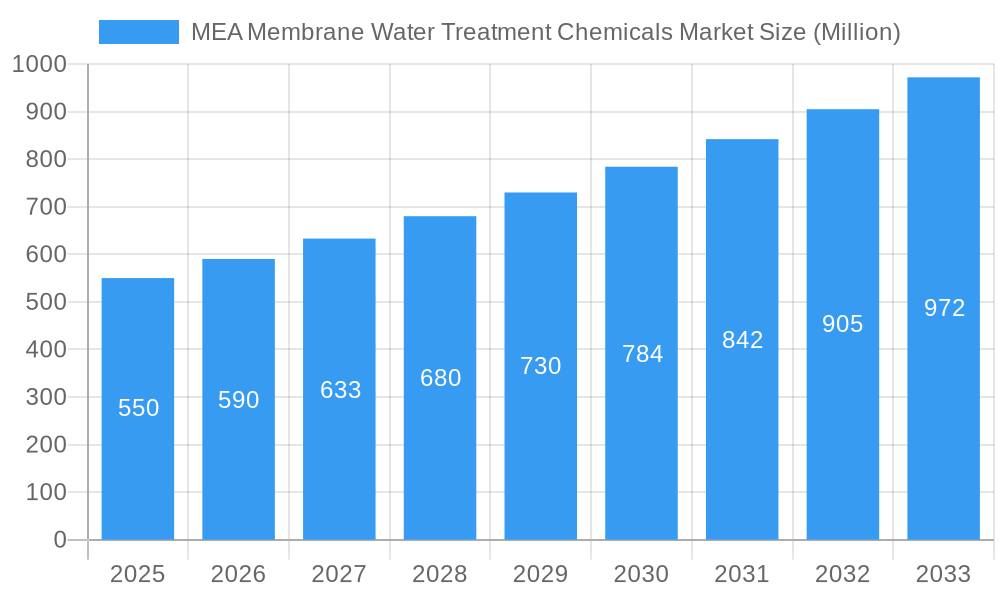
MEA Membrane Water Treatment Chemicals Market Market Size (In Billion)
The competitive arena comprises global leaders such as Ecolab, Dow, and Solenis, alongside specialized regional players. Companies are prioritizing the development of innovative, cost-effective, and eco-friendly water treatment solutions. Future expansion will be influenced by advancements in membrane materials and cleaning agents, the growing integration of automation and digitalization in water treatment facilities, and governmental support for sustainable water solutions. This market presents significant opportunities for companies offering high-performance chemicals, tailored solutions, and sustainable technologies. Further granular analysis of specific MEA countries will provide deeper insights into regional growth dynamics and market penetration strategies. The MEA Membrane Water Treatment Chemicals market is estimated at $2.4 billion in 2025 and is anticipated to experience robust expansion through 2033.
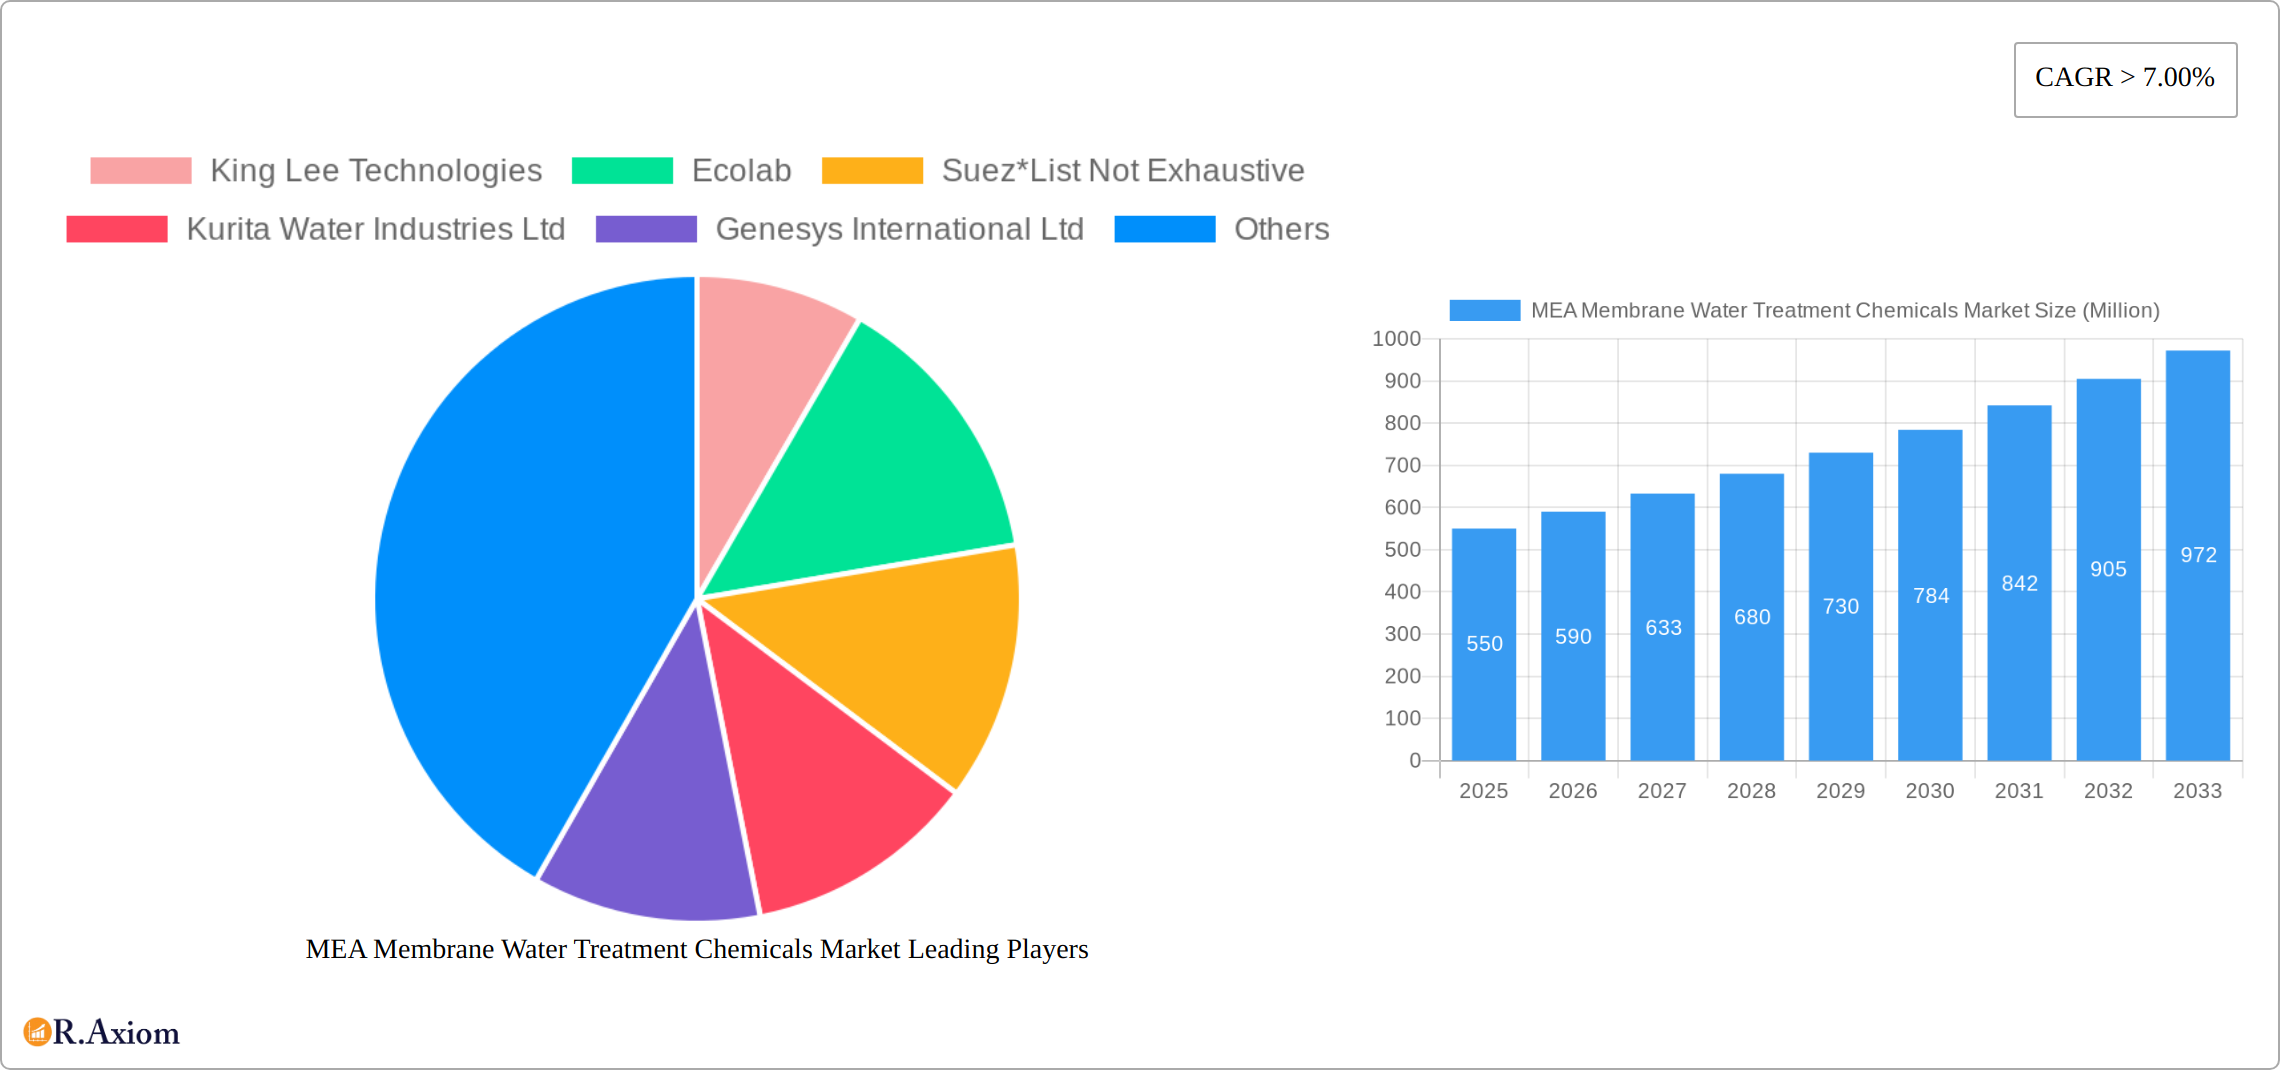
MEA Membrane Water Treatment Chemicals Market Company Market Share
MEA Membrane Water Treatment Chemicals Market: A Comprehensive Report (2019-2033)
This in-depth report provides a comprehensive analysis of the MEA Membrane Water Treatment Chemicals Market, covering market size, growth drivers, challenges, opportunities, and key players. The report utilizes data from the historical period (2019-2024), base year (2025), and projects growth until 2033, offering valuable insights for stakeholders across the water treatment industry. The market is segmented by chemical type (Pre-treatment, Biological Controllers, Other Chemical Types) and end-user industry (Food and Beverage Processing, Desalination, Healthcare, Municipal, Chemicals, Power, Other End-user Industries).
MEA Membrane Water Treatment Chemicals Market Concentration & Innovation
The MEA membrane water treatment chemicals market exhibits a moderately concentrated structure, with a few major players holding significant market share. Key players like Ecolab, Suez, Kurita Water Industries Ltd, and Dow collectively account for approximately xx% of the market in 2025. However, the presence of several smaller, specialized companies contributes to a dynamic competitive landscape. Innovation in this market is driven by the need for more efficient, sustainable, and cost-effective water treatment solutions. This is reflected in the development of advanced chemical formulations with enhanced performance characteristics, such as improved biofouling control and reduced chemical consumption. Regulatory frameworks, particularly those focused on water quality and environmental protection, significantly influence market dynamics. Stringent regulations are driving the adoption of eco-friendly chemicals and sustainable practices. The market also witnesses continuous development of product substitutes, such as alternative membrane technologies and advanced oxidation processes, impacting the demand for certain chemical types. End-user trends, characterized by increasing demand for high-quality water in various sectors, coupled with the growing adoption of membrane-based water treatment, present a significant growth opportunity. The market also witnesses consistent M&A activity; a notable example being the USD 5.25 billion acquisition of Solenis by Platinum Equity in November 2021, significantly reshaping the competitive dynamics and expanding the global reach of Solenis. Further, consolidation and strategic partnerships are expected to continue influencing market concentration and innovation in the forecast period.
MEA Membrane Water Treatment Chemicals Market Industry Trends & Insights
The MEA membrane water treatment chemicals market is experiencing robust growth, fueled by the escalating demand for clean and safe water across diverse sectors. Key drivers include the burgeoning needs of desalination plants, food and beverage processing facilities, and power generation industries. Stringent environmental regulations, coupled with growing awareness of water scarcity, are further accelerating market expansion. Significant advancements in membrane technology and chemical formulations are enhancing treatment efficiency and driving higher adoption rates. A notable trend is the increasing shift towards eco-friendly and sustainable chemical solutions, reflecting global environmental concerns and stricter regulations. This sustainability focus is complemented by growing consumer preference for environmentally responsible products. The competitive landscape is dynamic, featuring intense rivalry among established players and the emergence of innovative companies offering specialized solutions. Market penetration varies across end-user segments, with desalination and power generation leading in adoption. We project a compound annual growth rate (CAGR) of xx% for the market during the forecast period (2025-2033), driven by increased investment in water infrastructure projects and ongoing technological advancements. This growth trajectory is further supported by government initiatives promoting water security and sustainable water management practices.
Dominant Markets & Segments in MEA Membrane Water Treatment Chemicals Market
The MEA region presents a diverse market landscape for membrane water treatment chemicals. While specific data on regional dominance requires further analysis, the desalination segment within the end-user industry is expected to hold the largest market share due to increasing water scarcity and the growing investments in desalination plants across the region. Countries with high population density, water stress, and significant industrial activity will likely witness the highest market growth.
Key Drivers for Desalination Segment:
- Increasing water scarcity and arid climate conditions.
- Significant investments in desalination infrastructure projects.
- Growing demand for potable water in densely populated areas.
- Government initiatives promoting water security.
Key Drivers for Pre-treatment Chemicals Segment:
- Essential for optimizing membrane performance and extending lifespan.
- Increasing awareness of the importance of pre-treatment in water treatment processes.
- Development of advanced pre-treatment chemicals with enhanced efficiency.
Dominance analysis reveals that the pre-treatment chemical type segment holds a substantial market share, primarily driven by its crucial role in extending membrane life and enhancing overall treatment efficiency. Further, the food and beverage industry is another significant end-user segment, due to stringent quality standards and the need for purified water in processing. The municipal segment also shows promising growth potential, driven by increasing urbanization and the necessity for reliable water supply for public use. Each segment's growth is influenced by specific economic policies, infrastructure development, and regulatory frameworks.
MEA Membrane Water Treatment Chemicals Market Product Developments
Recent product innovations in the MEA membrane water treatment chemicals market prioritize enhanced efficacy, sustainability, and cost-effectiveness. This includes the development of advanced biocides with a minimized environmental footprint, novel antiscalants demonstrating superior performance at higher temperatures and salinities, and cleaning agents optimized for specific membrane types. These advancements directly address concerns regarding environmental sustainability and operational efficiency. A key trend is the customization of chemical solutions to meet the unique needs of diverse water sources and membrane systems. This tailored approach enhances treatment effectiveness, optimizes chemical usage, and improves overall operational efficiency, contributing to reduced operational costs and a smaller environmental impact.
Report Scope & Segmentation Analysis
This report comprehensively analyzes the MEA membrane water treatment chemicals market, segmented by chemical type and end-user industry. The Chemical Type segment includes Pre-treatment chemicals (e.g., coagulants, flocculants), Biological Controllers (e.g., biocides, disinfectants), and Other Chemical Types (e.g., antiscalants, cleaning agents). Each segment offers unique growth projections based on its specific applications and market dynamics. The End-user Industry segment encompasses Food and Beverage Processing, Desalination, Healthcare, Municipal, Chemicals, Power, and Other End-user Industries. Market size and competitive dynamics are analyzed for each segment, providing a detailed understanding of the market's structure and growth potential. The analysis includes growth projections, market sizes, and competitive dynamics for each segment, providing a granular view of the market.
Key Drivers of MEA Membrane Water Treatment Chemicals Market Growth
The MEA membrane water treatment chemicals market is propelled by several factors. Increasing water scarcity and stringent environmental regulations are major drivers, pushing for more efficient and sustainable water treatment solutions. The growing demand for high-quality water across various industries, particularly in desalination, food processing, and power generation, fuels market expansion. Government initiatives promoting water infrastructure development and investments in water treatment projects further stimulate market growth. Technological advancements in membrane technology and chemical formulations, resulting in enhanced efficiency and reduced chemical consumption, also contribute significantly.
Challenges in the MEA Membrane Water Treatment Chemicals Market Sector
The MEA membrane water treatment chemicals market faces several challenges. Fluctuations in raw material prices and supply chain disruptions can impact production costs and profitability. Stringent regulatory compliance requirements necessitate investments in compliance and testing, adding to operational expenses. Intense competition among established and emerging players creates pricing pressure and necessitates continuous innovation to maintain a competitive edge. The high capital expenditure required for setting up water treatment plants can deter smaller players and restrict market expansion in certain regions. Further, the adoption rate of new technologies varies across the region and market segments, presenting challenges in achieving widespread market penetration.
Emerging Opportunities in MEA Membrane Water Treatment Chemicals Market
The MEA membrane water treatment chemicals market presents significant emerging opportunities. The increasing adoption of advanced oxidation processes (AOPs) and membrane bioreactors (MBRs) creates a demand for specialized chemical solutions. The strong preference for sustainable and environmentally friendly chemicals offers manufacturers a compelling opportunity to develop and market eco-conscious products. Expansion into underserved markets within rapidly developing regions holds significant growth potential. Furthermore, developing innovative chemical formulations targeted at specific membrane types and water quality challenges offers substantial growth prospects. Strategic collaborations with membrane manufacturers can significantly enhance market reach and penetration, creating mutually beneficial partnerships and accelerating market adoption.
Key Developments in MEA Membrane Water Treatment Chemicals Market Industry
- November 2021: Platinum Equity acquired Solenis for USD 5.25 billion, significantly impacting market consolidation and expanding Solenis's global reach. This acquisition involved the merger with Sigura Water, broadening Solenis's product portfolio into residential and commercial pool water treatment.
Strategic Outlook for MEA Membrane Water Treatment Chemicals Market
The MEA membrane water treatment chemicals market exhibits immense growth potential, driven by factors such as escalating water scarcity, stringent environmental regulations, and robust industrial expansion. Future market expansion will be significantly influenced by technological innovations, the adoption of sustainable practices, and strategic partnerships. Companies prioritizing the development of eco-friendly, high-performance chemicals and establishing efficient distribution networks are poised to gain a substantial competitive advantage. The market is projected to experience sustained growth, propelled by increased investments in water infrastructure projects and a rising regional awareness of water conservation. This positive outlook is further reinforced by government policies supporting sustainable water management and water security initiatives.
MEA Membrane Water Treatment Chemicals Market Segmentation
-
1. Chemical Type
- 1.1. Pre-treatment
- 1.2. Biological Controllers
- 1.3. Other Chemical Types
-
2. End-user Industry
- 2.1. Food and Beverage Processing
- 2.2. Desalination
- 2.3. Healthcare
- 2.4. Municipal
- 2.5. Chemicals
- 2.6. Power
- 2.7. Other End-user Industries
-
3. Geography
- 3.1. Saudi Arabia
- 3.2. South Africa
- 3.3. Qatar
- 3.4. United Arab Emirates
- 3.5. Egypt
- 3.6. Rest of Middle-East and Africa
MEA Membrane Water Treatment Chemicals Market Segmentation By Geography
- 1. Saudi Arabia
- 2. South Africa
- 3. Qatar
- 4. United Arab Emirates
- 5. Egypt
- 6. Rest of Middle East and Africa
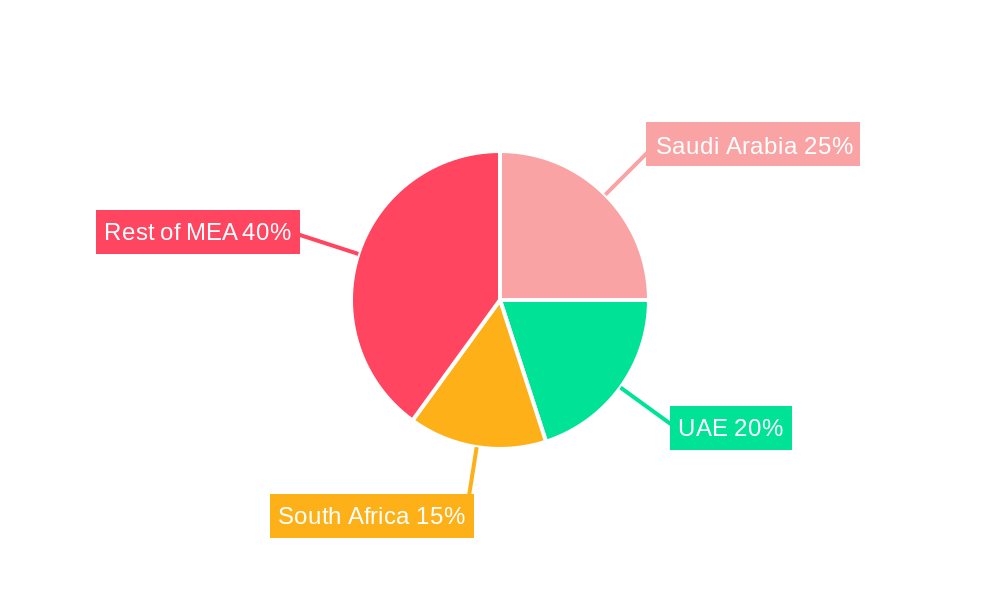
MEA Membrane Water Treatment Chemicals Market Regional Market Share
Geographic Coverage of MEA Membrane Water Treatment Chemicals Market
MEA Membrane Water Treatment Chemicals Market REPORT HIGHLIGHTS
| Aspects | Details |
|---|---|
| Study Period | 2020-2034 |
| Base Year | 2025 |
| Estimated Year | 2026 |
| Forecast Period | 2026-2034 |
| Historical Period | 2020-2025 |
| Growth Rate | CAGR of 6.1% from 2020-2034 |
| Segmentation |
|
Table of Contents
- 1. Introduction
- 1.1. Research Scope
- 1.2. Market Segmentation
- 1.3. Research Objective
- 1.4. Definitions and Assumptions
- 2. Executive Summary
- 2.1. Market Snapshot
- 3. Market Dynamics
- 3.1. Market Drivers
- 3.2. Market Restrains
- 3.3. Market Trends
- 3.4. Market Opportunities
- 4. Market Factor Analysis
- 4.1. Porters Five Forces
- 4.1.1. Bargaining Power of Suppliers
- 4.1.2. Bargaining Power of Buyers
- 4.1.3. Threat of New Entrants
- 4.1.4. Threat of Substitutes
- 4.1.5. Competitive Rivalry
- 4.2. PESTEL analysis
- 4.3. BCG Analysis
- 4.3.1. Stars (High Growth, High Market Share)
- 4.3.2. Cash Cows (Low Growth, High Market Share)
- 4.3.3. Question Mark (High Growth, Low Market Share)
- 4.3.4. Dogs (Low Growth, Low Market Share)
- 4.4. Ansoff Matrix Analysis
- 4.5. Supply Chain Analysis
- 4.6. Regulatory Landscape
- 4.7. Current Market Potential and Opportunity Assessment (TAM–SAM–SOM Framework)
- 4.8. RAX Analyst Note
- 4.1. Porters Five Forces
- 5. Market Analysis, Insights and Forecast 2021-2033
- 5.1. Market Analysis, Insights and Forecast - by Chemical Type
- 5.1.1. Pre-treatment
- 5.1.2. Biological Controllers
- 5.1.3. Other Chemical Types
- 5.2. Market Analysis, Insights and Forecast - by End-user Industry
- 5.2.1. Food and Beverage Processing
- 5.2.2. Desalination
- 5.2.3. Healthcare
- 5.2.4. Municipal
- 5.2.5. Chemicals
- 5.2.6. Power
- 5.2.7. Other End-user Industries
- 5.3. Market Analysis, Insights and Forecast - by Geography
- 5.3.1. Saudi Arabia
- 5.3.2. South Africa
- 5.3.3. Qatar
- 5.3.4. United Arab Emirates
- 5.3.5. Egypt
- 5.3.6. Rest of Middle-East and Africa
- 5.4. Market Analysis, Insights and Forecast - by Region
- 5.4.1. Saudi Arabia
- 5.4.2. South Africa
- 5.4.3. Qatar
- 5.4.4. United Arab Emirates
- 5.4.5. Egypt
- 5.4.6. Rest of Middle East and Africa
- 5.1. Market Analysis, Insights and Forecast - by Chemical Type
- 6. Global MEA Membrane Water Treatment Chemicals Market Analysis, Insights and Forecast, 2021-2033
- 6.1. Market Analysis, Insights and Forecast - by Chemical Type
- 6.1.1. Pre-treatment
- 6.1.2. Biological Controllers
- 6.1.3. Other Chemical Types
- 6.2. Market Analysis, Insights and Forecast - by End-user Industry
- 6.2.1. Food and Beverage Processing
- 6.2.2. Desalination
- 6.2.3. Healthcare
- 6.2.4. Municipal
- 6.2.5. Chemicals
- 6.2.6. Power
- 6.2.7. Other End-user Industries
- 6.3. Market Analysis, Insights and Forecast - by Geography
- 6.3.1. Saudi Arabia
- 6.3.2. South Africa
- 6.3.3. Qatar
- 6.3.4. United Arab Emirates
- 6.3.5. Egypt
- 6.3.6. Rest of Middle-East and Africa
- 6.1. Market Analysis, Insights and Forecast - by Chemical Type
- 7. Saudi Arabia MEA Membrane Water Treatment Chemicals Market Analysis, Insights and Forecast, 2020-2032
- 7.1. Market Analysis, Insights and Forecast - by Chemical Type
- 7.1.1. Pre-treatment
- 7.1.2. Biological Controllers
- 7.1.3. Other Chemical Types
- 7.2. Market Analysis, Insights and Forecast - by End-user Industry
- 7.2.1. Food and Beverage Processing
- 7.2.2. Desalination
- 7.2.3. Healthcare
- 7.2.4. Municipal
- 7.2.5. Chemicals
- 7.2.6. Power
- 7.2.7. Other End-user Industries
- 7.3. Market Analysis, Insights and Forecast - by Geography
- 7.3.1. Saudi Arabia
- 7.3.2. South Africa
- 7.3.3. Qatar
- 7.3.4. United Arab Emirates
- 7.3.5. Egypt
- 7.3.6. Rest of Middle-East and Africa
- 7.1. Market Analysis, Insights and Forecast - by Chemical Type
- 8. South Africa MEA Membrane Water Treatment Chemicals Market Analysis, Insights and Forecast, 2020-2032
- 8.1. Market Analysis, Insights and Forecast - by Chemical Type
- 8.1.1. Pre-treatment
- 8.1.2. Biological Controllers
- 8.1.3. Other Chemical Types
- 8.2. Market Analysis, Insights and Forecast - by End-user Industry
- 8.2.1. Food and Beverage Processing
- 8.2.2. Desalination
- 8.2.3. Healthcare
- 8.2.4. Municipal
- 8.2.5. Chemicals
- 8.2.6. Power
- 8.2.7. Other End-user Industries
- 8.3. Market Analysis, Insights and Forecast - by Geography
- 8.3.1. Saudi Arabia
- 8.3.2. South Africa
- 8.3.3. Qatar
- 8.3.4. United Arab Emirates
- 8.3.5. Egypt
- 8.3.6. Rest of Middle-East and Africa
- 8.1. Market Analysis, Insights and Forecast - by Chemical Type
- 9. Qatar MEA Membrane Water Treatment Chemicals Market Analysis, Insights and Forecast, 2020-2032
- 9.1. Market Analysis, Insights and Forecast - by Chemical Type
- 9.1.1. Pre-treatment
- 9.1.2. Biological Controllers
- 9.1.3. Other Chemical Types
- 9.2. Market Analysis, Insights and Forecast - by End-user Industry
- 9.2.1. Food and Beverage Processing
- 9.2.2. Desalination
- 9.2.3. Healthcare
- 9.2.4. Municipal
- 9.2.5. Chemicals
- 9.2.6. Power
- 9.2.7. Other End-user Industries
- 9.3. Market Analysis, Insights and Forecast - by Geography
- 9.3.1. Saudi Arabia
- 9.3.2. South Africa
- 9.3.3. Qatar
- 9.3.4. United Arab Emirates
- 9.3.5. Egypt
- 9.3.6. Rest of Middle-East and Africa
- 9.1. Market Analysis, Insights and Forecast - by Chemical Type
- 10. United Arab Emirates MEA Membrane Water Treatment Chemicals Market Analysis, Insights and Forecast, 2020-2032
- 10.1. Market Analysis, Insights and Forecast - by Chemical Type
- 10.1.1. Pre-treatment
- 10.1.2. Biological Controllers
- 10.1.3. Other Chemical Types
- 10.2. Market Analysis, Insights and Forecast - by End-user Industry
- 10.2.1. Food and Beverage Processing
- 10.2.2. Desalination
- 10.2.3. Healthcare
- 10.2.4. Municipal
- 10.2.5. Chemicals
- 10.2.6. Power
- 10.2.7. Other End-user Industries
- 10.3. Market Analysis, Insights and Forecast - by Geography
- 10.3.1. Saudi Arabia
- 10.3.2. South Africa
- 10.3.3. Qatar
- 10.3.4. United Arab Emirates
- 10.3.5. Egypt
- 10.3.6. Rest of Middle-East and Africa
- 10.1. Market Analysis, Insights and Forecast - by Chemical Type
- 11. Egypt MEA Membrane Water Treatment Chemicals Market Analysis, Insights and Forecast, 2020-2032
- 11.1. Market Analysis, Insights and Forecast - by Chemical Type
- 11.1.1. Pre-treatment
- 11.1.2. Biological Controllers
- 11.1.3. Other Chemical Types
- 11.2. Market Analysis, Insights and Forecast - by End-user Industry
- 11.2.1. Food and Beverage Processing
- 11.2.2. Desalination
- 11.2.3. Healthcare
- 11.2.4. Municipal
- 11.2.5. Chemicals
- 11.2.6. Power
- 11.2.7. Other End-user Industries
- 11.3. Market Analysis, Insights and Forecast - by Geography
- 11.3.1. Saudi Arabia
- 11.3.2. South Africa
- 11.3.3. Qatar
- 11.3.4. United Arab Emirates
- 11.3.5. Egypt
- 11.3.6. Rest of Middle-East and Africa
- 11.1. Market Analysis, Insights and Forecast - by Chemical Type
- 12. Rest of Middle East and Africa MEA Membrane Water Treatment Chemicals Market Analysis, Insights and Forecast, 2020-2032
- 12.1. Market Analysis, Insights and Forecast - by Chemical Type
- 12.1.1. Pre-treatment
- 12.1.2. Biological Controllers
- 12.1.3. Other Chemical Types
- 12.2. Market Analysis, Insights and Forecast - by End-user Industry
- 12.2.1. Food and Beverage Processing
- 12.2.2. Desalination
- 12.2.3. Healthcare
- 12.2.4. Municipal
- 12.2.5. Chemicals
- 12.2.6. Power
- 12.2.7. Other End-user Industries
- 12.3. Market Analysis, Insights and Forecast - by Geography
- 12.3.1. Saudi Arabia
- 12.3.2. South Africa
- 12.3.3. Qatar
- 12.3.4. United Arab Emirates
- 12.3.5. Egypt
- 12.3.6. Rest of Middle-East and Africa
- 12.1. Market Analysis, Insights and Forecast - by Chemical Type
- 13. Competitive Analysis
- 13.1. Company Profiles
- 13.1.1 King Lee Technologies
- 13.1.1.1. Company Overview
- 13.1.1.2. Products
- 13.1.1.3. Company Financials
- 13.1.1.4. SWOT Analysis
- 13.1.2 Ecolab
- 13.1.2.1. Company Overview
- 13.1.2.2. Products
- 13.1.2.3. Company Financials
- 13.1.2.4. SWOT Analysis
- 13.1.3 Suez*List Not Exhaustive
- 13.1.3.1. Company Overview
- 13.1.3.2. Products
- 13.1.3.3. Company Financials
- 13.1.3.4. SWOT Analysis
- 13.1.4 Kurita Water Industries Ltd
- 13.1.4.1. Company Overview
- 13.1.4.2. Products
- 13.1.4.3. Company Financials
- 13.1.4.4. SWOT Analysis
- 13.1.5 Genesys International Ltd
- 13.1.5.1. Company Overview
- 13.1.5.2. Products
- 13.1.5.3. Company Financials
- 13.1.5.4. SWOT Analysis
- 13.1.6 Italmatch Chemicals SpA
- 13.1.6.1. Company Overview
- 13.1.6.2. Products
- 13.1.6.3. Company Financials
- 13.1.6.4. SWOT Analysis
- 13.1.7 Kemira
- 13.1.7.1. Company Overview
- 13.1.7.2. Products
- 13.1.7.3. Company Financials
- 13.1.7.4. SWOT Analysis
- 13.1.8 Dow
- 13.1.8.1. Company Overview
- 13.1.8.2. Products
- 13.1.8.3. Company Financials
- 13.1.8.4. SWOT Analysis
- 13.1.9 Solenis
- 13.1.9.1. Company Overview
- 13.1.9.2. Products
- 13.1.9.3. Company Financials
- 13.1.9.4. SWOT Analysis
- 13.1.10 AES Arabia Ltd
- 13.1.10.1. Company Overview
- 13.1.10.2. Products
- 13.1.10.3. Company Financials
- 13.1.10.4. SWOT Analysis
- 13.1.11 Toray
- 13.1.11.1. Company Overview
- 13.1.11.2. Products
- 13.1.11.3. Company Financials
- 13.1.11.4. SWOT Analysis
- 13.1.1 King Lee Technologies
- 13.2. Market Entropy
- 13.2.1 Company's Key Areas Served
- 13.2.2 Recent Developments
- 13.3. Company Market Share Analysis 2025
- 13.3.1 Top 5 Companies Market Share Analysis
- 13.3.2 Top 3 Companies Market Share Analysis
- 13.4. List of Potential Customers
- 14. Research Methodology
List of Figures
- Figure 1: Global MEA Membrane Water Treatment Chemicals Market Revenue Breakdown (billion, %) by Region 2025 & 2033
- Figure 2: Saudi Arabia MEA Membrane Water Treatment Chemicals Market Revenue (billion), by Chemical Type 2025 & 2033
- Figure 3: Saudi Arabia MEA Membrane Water Treatment Chemicals Market Revenue Share (%), by Chemical Type 2025 & 2033
- Figure 4: Saudi Arabia MEA Membrane Water Treatment Chemicals Market Revenue (billion), by End-user Industry 2025 & 2033
- Figure 5: Saudi Arabia MEA Membrane Water Treatment Chemicals Market Revenue Share (%), by End-user Industry 2025 & 2033
- Figure 6: Saudi Arabia MEA Membrane Water Treatment Chemicals Market Revenue (billion), by Geography 2025 & 2033
- Figure 7: Saudi Arabia MEA Membrane Water Treatment Chemicals Market Revenue Share (%), by Geography 2025 & 2033
- Figure 8: Saudi Arabia MEA Membrane Water Treatment Chemicals Market Revenue (billion), by Country 2025 & 2033
- Figure 9: Saudi Arabia MEA Membrane Water Treatment Chemicals Market Revenue Share (%), by Country 2025 & 2033
- Figure 10: South Africa MEA Membrane Water Treatment Chemicals Market Revenue (billion), by Chemical Type 2025 & 2033
- Figure 11: South Africa MEA Membrane Water Treatment Chemicals Market Revenue Share (%), by Chemical Type 2025 & 2033
- Figure 12: South Africa MEA Membrane Water Treatment Chemicals Market Revenue (billion), by End-user Industry 2025 & 2033
- Figure 13: South Africa MEA Membrane Water Treatment Chemicals Market Revenue Share (%), by End-user Industry 2025 & 2033
- Figure 14: South Africa MEA Membrane Water Treatment Chemicals Market Revenue (billion), by Geography 2025 & 2033
- Figure 15: South Africa MEA Membrane Water Treatment Chemicals Market Revenue Share (%), by Geography 2025 & 2033
- Figure 16: South Africa MEA Membrane Water Treatment Chemicals Market Revenue (billion), by Country 2025 & 2033
- Figure 17: South Africa MEA Membrane Water Treatment Chemicals Market Revenue Share (%), by Country 2025 & 2033
- Figure 18: Qatar MEA Membrane Water Treatment Chemicals Market Revenue (billion), by Chemical Type 2025 & 2033
- Figure 19: Qatar MEA Membrane Water Treatment Chemicals Market Revenue Share (%), by Chemical Type 2025 & 2033
- Figure 20: Qatar MEA Membrane Water Treatment Chemicals Market Revenue (billion), by End-user Industry 2025 & 2033
- Figure 21: Qatar MEA Membrane Water Treatment Chemicals Market Revenue Share (%), by End-user Industry 2025 & 2033
- Figure 22: Qatar MEA Membrane Water Treatment Chemicals Market Revenue (billion), by Geography 2025 & 2033
- Figure 23: Qatar MEA Membrane Water Treatment Chemicals Market Revenue Share (%), by Geography 2025 & 2033
- Figure 24: Qatar MEA Membrane Water Treatment Chemicals Market Revenue (billion), by Country 2025 & 2033
- Figure 25: Qatar MEA Membrane Water Treatment Chemicals Market Revenue Share (%), by Country 2025 & 2033
- Figure 26: United Arab Emirates MEA Membrane Water Treatment Chemicals Market Revenue (billion), by Chemical Type 2025 & 2033
- Figure 27: United Arab Emirates MEA Membrane Water Treatment Chemicals Market Revenue Share (%), by Chemical Type 2025 & 2033
- Figure 28: United Arab Emirates MEA Membrane Water Treatment Chemicals Market Revenue (billion), by End-user Industry 2025 & 2033
- Figure 29: United Arab Emirates MEA Membrane Water Treatment Chemicals Market Revenue Share (%), by End-user Industry 2025 & 2033
- Figure 30: United Arab Emirates MEA Membrane Water Treatment Chemicals Market Revenue (billion), by Geography 2025 & 2033
- Figure 31: United Arab Emirates MEA Membrane Water Treatment Chemicals Market Revenue Share (%), by Geography 2025 & 2033
- Figure 32: United Arab Emirates MEA Membrane Water Treatment Chemicals Market Revenue (billion), by Country 2025 & 2033
- Figure 33: United Arab Emirates MEA Membrane Water Treatment Chemicals Market Revenue Share (%), by Country 2025 & 2033
- Figure 34: Egypt MEA Membrane Water Treatment Chemicals Market Revenue (billion), by Chemical Type 2025 & 2033
- Figure 35: Egypt MEA Membrane Water Treatment Chemicals Market Revenue Share (%), by Chemical Type 2025 & 2033
- Figure 36: Egypt MEA Membrane Water Treatment Chemicals Market Revenue (billion), by End-user Industry 2025 & 2033
- Figure 37: Egypt MEA Membrane Water Treatment Chemicals Market Revenue Share (%), by End-user Industry 2025 & 2033
- Figure 38: Egypt MEA Membrane Water Treatment Chemicals Market Revenue (billion), by Geography 2025 & 2033
- Figure 39: Egypt MEA Membrane Water Treatment Chemicals Market Revenue Share (%), by Geography 2025 & 2033
- Figure 40: Egypt MEA Membrane Water Treatment Chemicals Market Revenue (billion), by Country 2025 & 2033
- Figure 41: Egypt MEA Membrane Water Treatment Chemicals Market Revenue Share (%), by Country 2025 & 2033
- Figure 42: Rest of Middle East and Africa MEA Membrane Water Treatment Chemicals Market Revenue (billion), by Chemical Type 2025 & 2033
- Figure 43: Rest of Middle East and Africa MEA Membrane Water Treatment Chemicals Market Revenue Share (%), by Chemical Type 2025 & 2033
- Figure 44: Rest of Middle East and Africa MEA Membrane Water Treatment Chemicals Market Revenue (billion), by End-user Industry 2025 & 2033
- Figure 45: Rest of Middle East and Africa MEA Membrane Water Treatment Chemicals Market Revenue Share (%), by End-user Industry 2025 & 2033
- Figure 46: Rest of Middle East and Africa MEA Membrane Water Treatment Chemicals Market Revenue (billion), by Geography 2025 & 2033
- Figure 47: Rest of Middle East and Africa MEA Membrane Water Treatment Chemicals Market Revenue Share (%), by Geography 2025 & 2033
- Figure 48: Rest of Middle East and Africa MEA Membrane Water Treatment Chemicals Market Revenue (billion), by Country 2025 & 2033
- Figure 49: Rest of Middle East and Africa MEA Membrane Water Treatment Chemicals Market Revenue Share (%), by Country 2025 & 2033
List of Tables
- Table 1: Global MEA Membrane Water Treatment Chemicals Market Revenue billion Forecast, by Chemical Type 2020 & 2033
- Table 2: Global MEA Membrane Water Treatment Chemicals Market Revenue billion Forecast, by End-user Industry 2020 & 2033
- Table 3: Global MEA Membrane Water Treatment Chemicals Market Revenue billion Forecast, by Geography 2020 & 2033
- Table 4: Global MEA Membrane Water Treatment Chemicals Market Revenue billion Forecast, by Region 2020 & 2033
- Table 5: Global MEA Membrane Water Treatment Chemicals Market Revenue billion Forecast, by Chemical Type 2020 & 2033
- Table 6: Global MEA Membrane Water Treatment Chemicals Market Revenue billion Forecast, by End-user Industry 2020 & 2033
- Table 7: Global MEA Membrane Water Treatment Chemicals Market Revenue billion Forecast, by Geography 2020 & 2033
- Table 8: Global MEA Membrane Water Treatment Chemicals Market Revenue billion Forecast, by Country 2020 & 2033
- Table 9: Global MEA Membrane Water Treatment Chemicals Market Revenue billion Forecast, by Chemical Type 2020 & 2033
- Table 10: Global MEA Membrane Water Treatment Chemicals Market Revenue billion Forecast, by End-user Industry 2020 & 2033
- Table 11: Global MEA Membrane Water Treatment Chemicals Market Revenue billion Forecast, by Geography 2020 & 2033
- Table 12: Global MEA Membrane Water Treatment Chemicals Market Revenue billion Forecast, by Country 2020 & 2033
- Table 13: Global MEA Membrane Water Treatment Chemicals Market Revenue billion Forecast, by Chemical Type 2020 & 2033
- Table 14: Global MEA Membrane Water Treatment Chemicals Market Revenue billion Forecast, by End-user Industry 2020 & 2033
- Table 15: Global MEA Membrane Water Treatment Chemicals Market Revenue billion Forecast, by Geography 2020 & 2033
- Table 16: Global MEA Membrane Water Treatment Chemicals Market Revenue billion Forecast, by Country 2020 & 2033
- Table 17: Global MEA Membrane Water Treatment Chemicals Market Revenue billion Forecast, by Chemical Type 2020 & 2033
- Table 18: Global MEA Membrane Water Treatment Chemicals Market Revenue billion Forecast, by End-user Industry 2020 & 2033
- Table 19: Global MEA Membrane Water Treatment Chemicals Market Revenue billion Forecast, by Geography 2020 & 2033
- Table 20: Global MEA Membrane Water Treatment Chemicals Market Revenue billion Forecast, by Country 2020 & 2033
- Table 21: Global MEA Membrane Water Treatment Chemicals Market Revenue billion Forecast, by Chemical Type 2020 & 2033
- Table 22: Global MEA Membrane Water Treatment Chemicals Market Revenue billion Forecast, by End-user Industry 2020 & 2033
- Table 23: Global MEA Membrane Water Treatment Chemicals Market Revenue billion Forecast, by Geography 2020 & 2033
- Table 24: Global MEA Membrane Water Treatment Chemicals Market Revenue billion Forecast, by Country 2020 & 2033
- Table 25: Global MEA Membrane Water Treatment Chemicals Market Revenue billion Forecast, by Chemical Type 2020 & 2033
- Table 26: Global MEA Membrane Water Treatment Chemicals Market Revenue billion Forecast, by End-user Industry 2020 & 2033
- Table 27: Global MEA Membrane Water Treatment Chemicals Market Revenue billion Forecast, by Geography 2020 & 2033
- Table 28: Global MEA Membrane Water Treatment Chemicals Market Revenue billion Forecast, by Country 2020 & 2033
Frequently Asked Questions
1. What is the projected Compound Annual Growth Rate (CAGR) of the MEA Membrane Water Treatment Chemicals Market?
The projected CAGR is approximately 6.1%.
2. Which companies are prominent players in the MEA Membrane Water Treatment Chemicals Market?
Key companies in the market include King Lee Technologies, Ecolab, Suez*List Not Exhaustive, Kurita Water Industries Ltd, Genesys International Ltd, Italmatch Chemicals SpA, Kemira, Dow, Solenis, AES Arabia Ltd, Toray.
3. What are the main segments of the MEA Membrane Water Treatment Chemicals Market?
The market segments include Chemical Type, End-user Industry, Geography.
4. Can you provide details about the market size?
The market size is estimated to be USD 2.4 billion as of 2022.
5. What are some drivers contributing to market growth?
Growing Demand for Freshwater; Other Drivers.
6. What are the notable trends driving market growth?
The Desalination Industry is Expected to Dominate the Market.
7. Are there any restraints impacting market growth?
High Capital Cost; Other Restraints.
8. Can you provide examples of recent developments in the market?
In November 2021, Platinum Equity bought Solenis, a prominent worldwide manufacturer of specialty chemicals, from Clayton, Dubilier & Rice (CD&R) and BASF in a USD 5.25 billion deal. Solenis has been fully exited by both CD&R and BASF. Solenis has amalgamated with Sigura Water, an existing Platinum Equity portfolio firm, as part of the transaction. Solenis is expanding its portfolio by acquiring Sigura's residential and commercial pool water and spa treatment sectors. As a result of the transaction, Solenis will now have a worldwide presence of 120 countries, 47 production locations, and over 6,000 people.
9. What pricing options are available for accessing the report?
Pricing options include single-user, multi-user, and enterprise licenses priced at USD 4750, USD 5250, and USD 8750 respectively.
10. Is the market size provided in terms of value or volume?
The market size is provided in terms of value, measured in billion.
11. Are there any specific market keywords associated with the report?
Yes, the market keyword associated with the report is "MEA Membrane Water Treatment Chemicals Market," which aids in identifying and referencing the specific market segment covered.
12. How do I determine which pricing option suits my needs best?
The pricing options vary based on user requirements and access needs. Individual users may opt for single-user licenses, while businesses requiring broader access may choose multi-user or enterprise licenses for cost-effective access to the report.
13. Are there any additional resources or data provided in the MEA Membrane Water Treatment Chemicals Market report?
While the report offers comprehensive insights, it's advisable to review the specific contents or supplementary materials provided to ascertain if additional resources or data are available.
14. How can I stay updated on further developments or reports in the MEA Membrane Water Treatment Chemicals Market?
To stay informed about further developments, trends, and reports in the MEA Membrane Water Treatment Chemicals Market, consider subscribing to industry newsletters, following relevant companies and organizations, or regularly checking reputable industry news sources and publications.
Methodology
Step 1 - Identification of Relevant Samples Size from Population Database


Step 2 - Approaches for Defining Global Market Size (Value, Volume* & Price*)

Note*: In applicable scenarios
Step 3 - Data Sources
Primary Research
- Web Analytics
- Survey Reports
- Research Institute
- Latest Research Reports
- Opinion Leaders
Secondary Research
- Annual Reports
- White Paper
- Latest Press Release
- Industry Association
- Paid Database
- Investor Presentations

Step 4 - Data Triangulation
Involves using different sources of information in order to increase the validity of a study
These sources are likely to be stakeholders in a program - participants, other researchers, program staff, other community members, and so on.
Then we put all data in single framework & apply various statistical tools to find out the dynamic on the market.
During the analysis stage, feedback from the stakeholder groups would be compared to determine areas of agreement as well as areas of divergence