
Key Insights
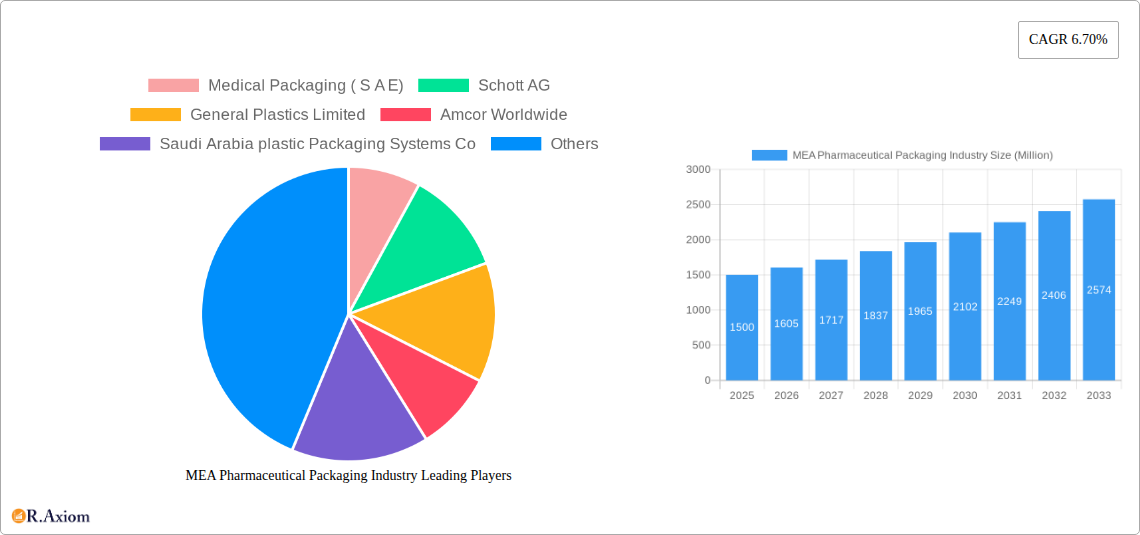
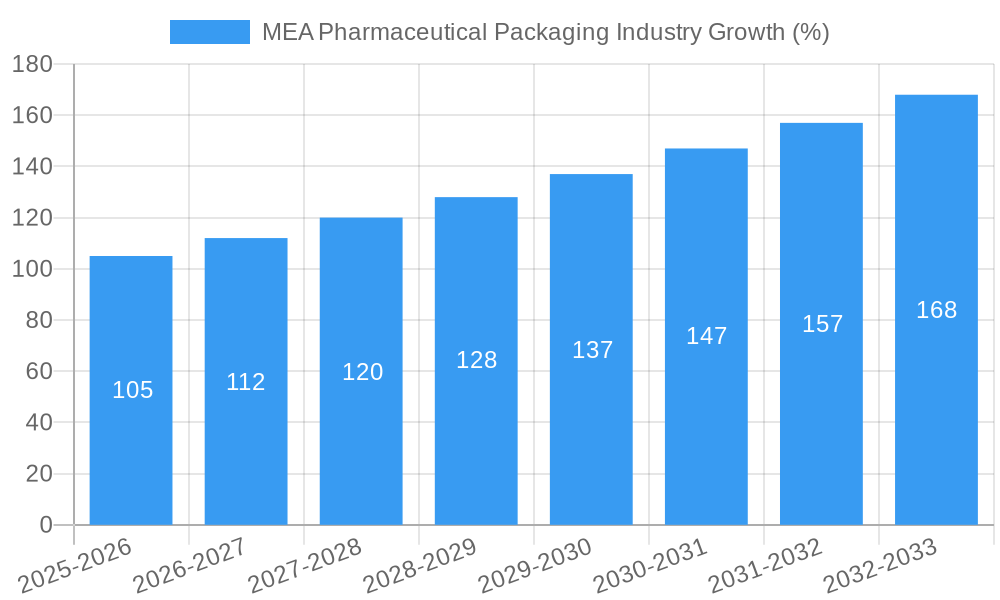
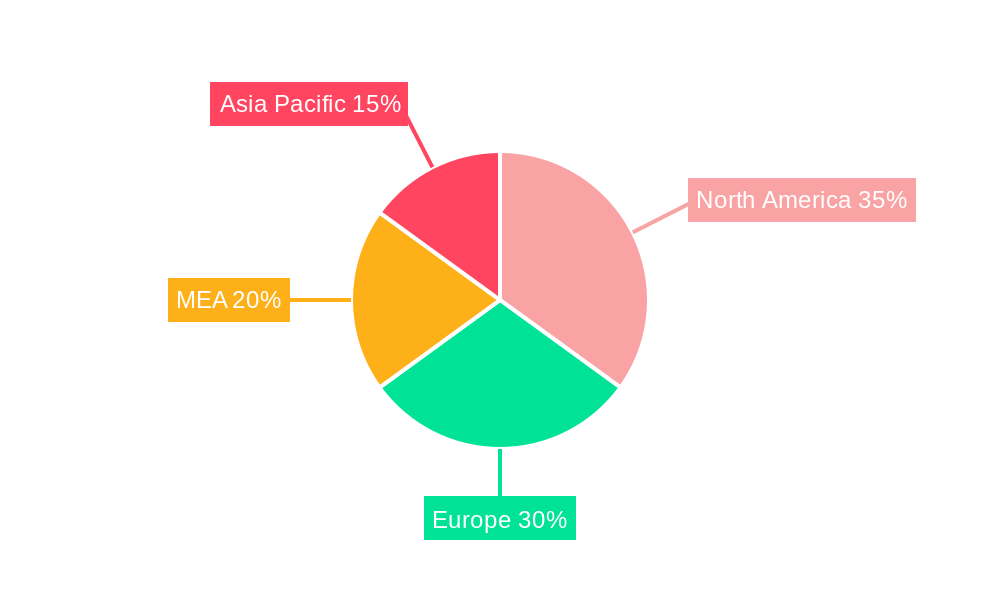
The MEA (Middle East and Africa) pharmaceutical packaging market, currently exhibiting robust growth, is projected to experience a Compound Annual Growth Rate (CAGR) of 6.70% from 2025 to 2033. This expansion is fueled by several key drivers. The rising prevalence of chronic diseases necessitates increased pharmaceutical production and, consequently, a greater demand for packaging solutions. Government initiatives promoting healthcare infrastructure development and pharmaceutical manufacturing within the region further contribute to market growth. Furthermore, the increasing adoption of advanced packaging technologies, such as blister packs and modified atmosphere packaging, to enhance drug efficacy and shelf life, is a significant driver. The market is segmented by material type (plastic, glass, paper and paperboard, metal), and product type (bottles, vials, ampoules, syringes, tubes, caps and closures, pouches, labels, and others). Plastic currently dominates due to its cost-effectiveness and versatility, though concerns regarding environmental sustainability are leading to increased interest in sustainable alternatives like paper-based packaging. The burgeoning pharmaceutical industry in countries like the United States and those within the European Union (specifically the United Kingdom, Germany, France, and Spain) exerts significant influence on regional market trends, driving innovation and demand.
Growth within specific segments will vary. For example, while bottles and vials will maintain a substantial market share, the demand for pre-filled syringes and specialized packaging for injectables is expected to grow rapidly, reflecting the increasing prevalence of injectable medications. Competition in the MEA pharmaceutical packaging market is fierce, with both international players (like Amcor Worldwide and Schott AG) and regional manufacturers vying for market share. The competitive landscape is characterized by ongoing innovation, strategic partnerships, and a focus on providing customized packaging solutions that meet the unique requirements of pharmaceutical companies. Despite challenges such as fluctuating raw material prices and regulatory hurdles, the overall outlook for the MEA pharmaceutical packaging market remains positive, driven by its robust growth trajectory and the increasing demand for high-quality, safe, and effective pharmaceutical products.
MEA Pharmaceutical Packaging Industry: A Comprehensive Market Report (2019-2033)
This in-depth report provides a comprehensive analysis of the Middle East and Africa (MEA) pharmaceutical packaging industry, covering market size, growth drivers, competitive landscape, and future outlook. The study period spans from 2019 to 2033, with 2025 serving as both the base and estimated year. The report offers actionable insights for industry stakeholders, investors, and strategic decision-makers.
MEA Pharmaceutical Packaging Industry Market Concentration & Innovation
The MEA pharmaceutical packaging market exhibits a moderately concentrated landscape, with a few major players holding significant market share. However, the presence of numerous smaller, regional players contributes to competitive dynamics. Market share data for 2024 indicates Amcor Worldwide holds approximately xx% market share, followed by Sealed Air Corporation at xx%, and Indevco Group at xx%. The remaining share is distributed among other players like Medical Packaging (S A E), Schott AG, and others. Innovation is driven by increasing demand for sustainable packaging solutions, stringent regulatory requirements, and the need for enhanced product protection and convenience. Recent M&A activities in the region are valued at approximately $xx Million, reflecting industry consolidation and expansion strategies. Key innovation drivers include:
- Sustainable Packaging: Growing adoption of recycled materials and biodegradable options.
- Advanced Technologies: Implementation of smart packaging and serialization technologies.
- Regulatory Compliance: Stringent regulations regarding product safety and traceability.
- Product Differentiation: Companies focusing on developing innovative packaging designs and features.
The regulatory framework varies across MEA countries, influencing packaging standards and compliance requirements. Product substitutes, such as alternative materials and packaging formats, present ongoing competitive pressure. End-user trends, particularly towards convenience and safety, are impacting packaging preferences.
MEA Pharmaceutical Packaging Industry Industry Trends & Insights
The MEA pharmaceutical packaging market is experiencing robust growth, projected to achieve a CAGR of xx% during the forecast period (2025-2033). This growth is fueled by several factors: a rising pharmaceutical industry, increasing healthcare expenditure, and growing demand for advanced packaging technologies to ensure product quality and patient safety. Technological disruptions, such as the adoption of automation and digital printing, are enhancing efficiency and customization options. Consumer preferences are shifting toward sustainable and convenient packaging solutions, influencing product design and material choices. Competitive dynamics are shaped by factors like pricing strategies, innovation capabilities, and supply chain management. Market penetration of sustainable packaging materials is estimated at xx% in 2024, projected to increase to xx% by 2033.
Dominant Markets & Segments in MEA Pharmaceutical Packaging Industry
The plastic segment currently dominates the MEA pharmaceutical packaging market by material type, driven by its versatility, cost-effectiveness, and suitability for various packaging formats. However, glass maintains a significant presence for specific applications requiring higher barrier properties and inertness. The "Bottles, Vials, and Ampoules" segment leads in product type, driven by their widespread use for liquid pharmaceuticals.
Key Drivers:
- Economic Growth: Expanding healthcare infrastructure and increasing disposable incomes fuel demand.
- Pharmaceutical Industry Growth: The expansion of the pharmaceutical sector in the MEA region drives packaging demand.
- Government Initiatives: Policies promoting healthcare and pharmaceutical industry development.
- Favorable Demographics: A growing population and aging demographics contribute to increased pharmaceutical consumption.
Dominance Analysis: While the plastic segment dominates in terms of volume, glass remains significant for specific applications demanding sterility and protection from external elements. This dynamic makes the market a mixture of high-volume, low-margin plastic applications and lower-volume, higher-margin glass alternatives.
MEA Pharmaceutical Packaging Industry Product Developments
Recent innovations focus on sustainable solutions, such as recycled materials and biodegradable options, and improved functionalities like enhanced barrier properties and tamper-evident features. Technological advancements in printing and labeling are also driving product developments, providing opportunities for customization and improved brand visibility. These developments aim to improve product protection, enhance patient safety, and align with environmental regulations. The market shows a trend toward lighter-weight packaging and efficient design.
Report Scope & Segmentation Analysis
This report segments the MEA pharmaceutical packaging market based on material type (Plastic, Glass, Others – Paper and Paperboard, Metal) and product type (Bottles, Vials and Ampoules, Syringes, Tubes, Caps and Closures, Pouches, Labels, Other Product Types). Each segment's growth projections, market size, and competitive dynamics are analyzed. For example, the Plastic segment is expected to maintain its dominance, while the Others segment (Paper and Paperboard) is anticipated to show moderate growth. Similarly, within product types, Bottles, Vials, and Ampoules are forecasted to maintain strong growth due to their wide application in the pharmaceutical industry.
Key Drivers of MEA Pharmaceutical Packaging Industry Growth
Several factors are driving the growth of the MEA pharmaceutical packaging market. These include:
- Rising Healthcare Expenditure: Increased investments in healthcare infrastructure and services.
- Technological Advancements: Adoption of advanced packaging technologies and automation.
- Stringent Regulatory Frameworks: Increased focus on product safety and traceability.
- Growth of Pharmaceutical Industry: Expansion of the pharmaceutical sector in the region.
- Growing Demand for Sustainable Packaging: Increased consumer preference for eco-friendly packaging.
Challenges in the MEA Pharmaceutical Packaging Industry Sector
The MEA pharmaceutical packaging industry faces challenges such as:
- Fluctuating Raw Material Prices: Price volatility of materials like plastic and glass impacts production costs.
- Supply Chain Disruptions: Global supply chain vulnerabilities impact timely material delivery.
- Intense Competition: High competition among established and emerging players.
- Regulatory Compliance: Meeting varying regional regulatory requirements.
Emerging Opportunities in MEA Pharmaceutical Packaging Industry
Several opportunities exist for growth in the MEA pharmaceutical packaging market:
- Growth of the Generic Drug Market: Increased demand for affordable generic drugs drives packaging demand.
- Expansion of E-commerce: Growth of online pharmacies increases demand for convenient and secure packaging.
- Focus on Sustainability: Demand for sustainable and eco-friendly packaging solutions presents an opportunity.
- Technological Innovation: Development of innovative packaging solutions improves product protection and patient safety.
Leading Players in the MEA Pharmaceutical Packaging Industry Market
- Medical Packaging (S A E)
- Schott AG
- General Plastics Limited
- Amcor Worldwide
- Saudi Arabia plastic Packaging Systems Co
- Rexam PLC
- Sealed Air Corporation
- Rose Plastics Medical Packaging
- Frank NOE Limited
- Indevco Group
Key Developments in MEA Pharmaceutical Packaging Industry Industry
- Feb 2021: Indevco Plastics launched a print-grade shrink bundling film made with 50% post-consumer recycled resin, promoting circular economy solutions.
- June 2021: Amcor introduced ACT2100, an enhanced heat seal coating for healthcare packaging, offering enhanced business continuity and shorter supply chains.
Strategic Outlook for MEA Pharmaceutical Packaging Industry Market
The MEA pharmaceutical packaging market is poised for significant growth, driven by factors such as increasing healthcare expenditure, technological advancements, and the growing demand for sustainable packaging. The market will likely witness further consolidation through mergers and acquisitions, along with increased innovation in packaging materials and technologies to meet evolving customer demands and regulatory requirements. Companies focusing on sustainable solutions and advanced technologies are expected to gain a competitive advantage.
MEA Pharmaceutical Packaging Industry Segmentation
-
1. Material Type
- 1.1. Plastic
- 1.2. Glass
- 1.3. Others (Paper and Paperboard, Metal)
-
2. Product Type
- 2.1. Bottles
- 2.2. Vials and Ampoules
- 2.3. Syringes
- 2.4. Tubes
- 2.5. Caps and Closures
- 2.6. Pouches
- 2.7. Labels
- 2.8. Other Product Types
MEA Pharmaceutical Packaging Industry Segmentation By Geography
-
1. North America
- 1.1. United States
- 1.2. Canada
- 1.3. Mexico
-
2. South America
- 2.1. Brazil
- 2.2. Argentina
- 2.3. Rest of South America
-
3. Europe
- 3.1. United Kingdom
- 3.2. Germany
- 3.3. France
- 3.4. Italy
- 3.5. Spain
- 3.6. Russia
- 3.7. Benelux
- 3.8. Nordics
- 3.9. Rest of Europe
-
4. Middle East & Africa
- 4.1. Turkey
- 4.2. Israel
- 4.3. GCC
- 4.4. North Africa
- 4.5. South Africa
- 4.6. Rest of Middle East & Africa
-
5. Asia Pacific
- 5.1. China
- 5.2. India
- 5.3. Japan
- 5.4. South Korea
- 5.5. ASEAN
- 5.6. Oceania
- 5.7. Rest of Asia Pacific
MEA Pharmaceutical Packaging Industry REPORT HIGHLIGHTS
| Aspects | Details |
|---|---|
| Study Period | 2019-2033 |
| Base Year | 2024 |
| Estimated Year | 2025 |
| Forecast Period | 2025-2033 |
| Historical Period | 2019-2024 |
| Growth Rate | CAGR of 6.70% from 2019-2033 |
| Segmentation |
|
Table of Contents
- 1. Introduction
- 1.1. Research Scope
- 1.2. Market Segmentation
- 1.3. Research Methodology
- 1.4. Definitions and Assumptions
- 2. Executive Summary
- 2.1. Introduction
- 3. Market Dynamics
- 3.1. Introduction
- 3.2. Market Drivers
- 3.2.1. Rising Awareness of Environmental Issues and Adoption of New Regulatory Standards; Surging Number of Chronic Disease Cases
- 3.3. Market Restrains
- 3.3.1. Fluctuations in Raw Material Cost Due to Suppliers Bargaining Power
- 3.4. Market Trends
- 3.4.1. Bottle Packaging segment to hold biggest operating expense
- 4. Market Factor Analysis
- 4.1. Porters Five Forces
- 4.2. Supply/Value Chain
- 4.3. PESTEL analysis
- 4.4. Market Entropy
- 4.5. Patent/Trademark Analysis
- 5. Global MEA Pharmaceutical Packaging Industry Analysis, Insights and Forecast, 2019-2031
- 5.1. Market Analysis, Insights and Forecast - by Material Type
- 5.1.1. Plastic
- 5.1.2. Glass
- 5.1.3. Others (Paper and Paperboard, Metal)
- 5.2. Market Analysis, Insights and Forecast - by Product Type
- 5.2.1. Bottles
- 5.2.2. Vials and Ampoules
- 5.2.3. Syringes
- 5.2.4. Tubes
- 5.2.5. Caps and Closures
- 5.2.6. Pouches
- 5.2.7. Labels
- 5.2.8. Other Product Types
- 5.3. Market Analysis, Insights and Forecast - by Region
- 5.3.1. North America
- 5.3.2. South America
- 5.3.3. Europe
- 5.3.4. Middle East & Africa
- 5.3.5. Asia Pacific
- 5.1. Market Analysis, Insights and Forecast - by Material Type
- 6. North America MEA Pharmaceutical Packaging Industry Analysis, Insights and Forecast, 2019-2031
- 6.1. Market Analysis, Insights and Forecast - by Material Type
- 6.1.1. Plastic
- 6.1.2. Glass
- 6.1.3. Others (Paper and Paperboard, Metal)
- 6.2. Market Analysis, Insights and Forecast - by Product Type
- 6.2.1. Bottles
- 6.2.2. Vials and Ampoules
- 6.2.3. Syringes
- 6.2.4. Tubes
- 6.2.5. Caps and Closures
- 6.2.6. Pouches
- 6.2.7. Labels
- 6.2.8. Other Product Types
- 6.1. Market Analysis, Insights and Forecast - by Material Type
- 7. South America MEA Pharmaceutical Packaging Industry Analysis, Insights and Forecast, 2019-2031
- 7.1. Market Analysis, Insights and Forecast - by Material Type
- 7.1.1. Plastic
- 7.1.2. Glass
- 7.1.3. Others (Paper and Paperboard, Metal)
- 7.2. Market Analysis, Insights and Forecast - by Product Type
- 7.2.1. Bottles
- 7.2.2. Vials and Ampoules
- 7.2.3. Syringes
- 7.2.4. Tubes
- 7.2.5. Caps and Closures
- 7.2.6. Pouches
- 7.2.7. Labels
- 7.2.8. Other Product Types
- 7.1. Market Analysis, Insights and Forecast - by Material Type
- 8. Europe MEA Pharmaceutical Packaging Industry Analysis, Insights and Forecast, 2019-2031
- 8.1. Market Analysis, Insights and Forecast - by Material Type
- 8.1.1. Plastic
- 8.1.2. Glass
- 8.1.3. Others (Paper and Paperboard, Metal)
- 8.2. Market Analysis, Insights and Forecast - by Product Type
- 8.2.1. Bottles
- 8.2.2. Vials and Ampoules
- 8.2.3. Syringes
- 8.2.4. Tubes
- 8.2.5. Caps and Closures
- 8.2.6. Pouches
- 8.2.7. Labels
- 8.2.8. Other Product Types
- 8.1. Market Analysis, Insights and Forecast - by Material Type
- 9. Middle East & Africa MEA Pharmaceutical Packaging Industry Analysis, Insights and Forecast, 2019-2031
- 9.1. Market Analysis, Insights and Forecast - by Material Type
- 9.1.1. Plastic
- 9.1.2. Glass
- 9.1.3. Others (Paper and Paperboard, Metal)
- 9.2. Market Analysis, Insights and Forecast - by Product Type
- 9.2.1. Bottles
- 9.2.2. Vials and Ampoules
- 9.2.3. Syringes
- 9.2.4. Tubes
- 9.2.5. Caps and Closures
- 9.2.6. Pouches
- 9.2.7. Labels
- 9.2.8. Other Product Types
- 9.1. Market Analysis, Insights and Forecast - by Material Type
- 10. Asia Pacific MEA Pharmaceutical Packaging Industry Analysis, Insights and Forecast, 2019-2031
- 10.1. Market Analysis, Insights and Forecast - by Material Type
- 10.1.1. Plastic
- 10.1.2. Glass
- 10.1.3. Others (Paper and Paperboard, Metal)
- 10.2. Market Analysis, Insights and Forecast - by Product Type
- 10.2.1. Bottles
- 10.2.2. Vials and Ampoules
- 10.2.3. Syringes
- 10.2.4. Tubes
- 10.2.5. Caps and Closures
- 10.2.6. Pouches
- 10.2.7. Labels
- 10.2.8. Other Product Types
- 10.1. Market Analysis, Insights and Forecast - by Material Type
- 11. United States MEA Pharmaceutical Packaging Industry Analysis, Insights and Forecast, 2019-2031
- 11.1. Market Analysis, Insights and Forecast - By Country/Sub-region
- 11.1.1.
- 12. Europe MEA Pharmaceutical Packaging Industry Analysis, Insights and Forecast, 2019-2031
- 12.1. Market Analysis, Insights and Forecast - By Country/Sub-region
- 12.1.1 United Kingdom
- 12.1.2 Germany
- 12.1.3 France
- 12.1.4 Spain
- 12.1.5 Rest of Europe
- 13. Competitive Analysis
- 13.1. Global Market Share Analysis 2024
- 13.2. Company Profiles
- 13.2.1 Medical Packaging ( S A E)
- 13.2.1.1. Overview
- 13.2.1.2. Products
- 13.2.1.3. SWOT Analysis
- 13.2.1.4. Recent Developments
- 13.2.1.5. Financials (Based on Availability)
- 13.2.2 Schott AG
- 13.2.2.1. Overview
- 13.2.2.2. Products
- 13.2.2.3. SWOT Analysis
- 13.2.2.4. Recent Developments
- 13.2.2.5. Financials (Based on Availability)
- 13.2.3 General Plastics Limited
- 13.2.3.1. Overview
- 13.2.3.2. Products
- 13.2.3.3. SWOT Analysis
- 13.2.3.4. Recent Developments
- 13.2.3.5. Financials (Based on Availability)
- 13.2.4 Amcor Worldwide
- 13.2.4.1. Overview
- 13.2.4.2. Products
- 13.2.4.3. SWOT Analysis
- 13.2.4.4. Recent Developments
- 13.2.4.5. Financials (Based on Availability)
- 13.2.5 Saudi Arabia plastic Packaging Systems Co
- 13.2.5.1. Overview
- 13.2.5.2. Products
- 13.2.5.3. SWOT Analysis
- 13.2.5.4. Recent Developments
- 13.2.5.5. Financials (Based on Availability)
- 13.2.6 Rexam PLC
- 13.2.6.1. Overview
- 13.2.6.2. Products
- 13.2.6.3. SWOT Analysis
- 13.2.6.4. Recent Developments
- 13.2.6.5. Financials (Based on Availability)
- 13.2.7 Sealed Air Corporation
- 13.2.7.1. Overview
- 13.2.7.2. Products
- 13.2.7.3. SWOT Analysis
- 13.2.7.4. Recent Developments
- 13.2.7.5. Financials (Based on Availability)
- 13.2.8 Rose Plastics Medical Packagin
- 13.2.8.1. Overview
- 13.2.8.2. Products
- 13.2.8.3. SWOT Analysis
- 13.2.8.4. Recent Developments
- 13.2.8.5. Financials (Based on Availability)
- 13.2.9 Frank NOE Limited
- 13.2.9.1. Overview
- 13.2.9.2. Products
- 13.2.9.3. SWOT Analysis
- 13.2.9.4. Recent Developments
- 13.2.9.5. Financials (Based on Availability)
- 13.2.10 Indevco Group
- 13.2.10.1. Overview
- 13.2.10.2. Products
- 13.2.10.3. SWOT Analysis
- 13.2.10.4. Recent Developments
- 13.2.10.5. Financials (Based on Availability)
- 13.2.1 Medical Packaging ( S A E)
List of Figures
- Figure 1: Global MEA Pharmaceutical Packaging Industry Revenue Breakdown (Million, %) by Region 2024 & 2032
- Figure 2: United States MEA Pharmaceutical Packaging Industry Revenue (Million), by Country 2024 & 2032
- Figure 3: United States MEA Pharmaceutical Packaging Industry Revenue Share (%), by Country 2024 & 2032
- Figure 4: Europe MEA Pharmaceutical Packaging Industry Revenue (Million), by Country 2024 & 2032
- Figure 5: Europe MEA Pharmaceutical Packaging Industry Revenue Share (%), by Country 2024 & 2032
- Figure 6: North America MEA Pharmaceutical Packaging Industry Revenue (Million), by Material Type 2024 & 2032
- Figure 7: North America MEA Pharmaceutical Packaging Industry Revenue Share (%), by Material Type 2024 & 2032
- Figure 8: North America MEA Pharmaceutical Packaging Industry Revenue (Million), by Product Type 2024 & 2032
- Figure 9: North America MEA Pharmaceutical Packaging Industry Revenue Share (%), by Product Type 2024 & 2032
- Figure 10: North America MEA Pharmaceutical Packaging Industry Revenue (Million), by Country 2024 & 2032
- Figure 11: North America MEA Pharmaceutical Packaging Industry Revenue Share (%), by Country 2024 & 2032
- Figure 12: South America MEA Pharmaceutical Packaging Industry Revenue (Million), by Material Type 2024 & 2032
- Figure 13: South America MEA Pharmaceutical Packaging Industry Revenue Share (%), by Material Type 2024 & 2032
- Figure 14: South America MEA Pharmaceutical Packaging Industry Revenue (Million), by Product Type 2024 & 2032
- Figure 15: South America MEA Pharmaceutical Packaging Industry Revenue Share (%), by Product Type 2024 & 2032
- Figure 16: South America MEA Pharmaceutical Packaging Industry Revenue (Million), by Country 2024 & 2032
- Figure 17: South America MEA Pharmaceutical Packaging Industry Revenue Share (%), by Country 2024 & 2032
- Figure 18: Europe MEA Pharmaceutical Packaging Industry Revenue (Million), by Material Type 2024 & 2032
- Figure 19: Europe MEA Pharmaceutical Packaging Industry Revenue Share (%), by Material Type 2024 & 2032
- Figure 20: Europe MEA Pharmaceutical Packaging Industry Revenue (Million), by Product Type 2024 & 2032
- Figure 21: Europe MEA Pharmaceutical Packaging Industry Revenue Share (%), by Product Type 2024 & 2032
- Figure 22: Europe MEA Pharmaceutical Packaging Industry Revenue (Million), by Country 2024 & 2032
- Figure 23: Europe MEA Pharmaceutical Packaging Industry Revenue Share (%), by Country 2024 & 2032
- Figure 24: Middle East & Africa MEA Pharmaceutical Packaging Industry Revenue (Million), by Material Type 2024 & 2032
- Figure 25: Middle East & Africa MEA Pharmaceutical Packaging Industry Revenue Share (%), by Material Type 2024 & 2032
- Figure 26: Middle East & Africa MEA Pharmaceutical Packaging Industry Revenue (Million), by Product Type 2024 & 2032
- Figure 27: Middle East & Africa MEA Pharmaceutical Packaging Industry Revenue Share (%), by Product Type 2024 & 2032
- Figure 28: Middle East & Africa MEA Pharmaceutical Packaging Industry Revenue (Million), by Country 2024 & 2032
- Figure 29: Middle East & Africa MEA Pharmaceutical Packaging Industry Revenue Share (%), by Country 2024 & 2032
- Figure 30: Asia Pacific MEA Pharmaceutical Packaging Industry Revenue (Million), by Material Type 2024 & 2032
- Figure 31: Asia Pacific MEA Pharmaceutical Packaging Industry Revenue Share (%), by Material Type 2024 & 2032
- Figure 32: Asia Pacific MEA Pharmaceutical Packaging Industry Revenue (Million), by Product Type 2024 & 2032
- Figure 33: Asia Pacific MEA Pharmaceutical Packaging Industry Revenue Share (%), by Product Type 2024 & 2032
- Figure 34: Asia Pacific MEA Pharmaceutical Packaging Industry Revenue (Million), by Country 2024 & 2032
- Figure 35: Asia Pacific MEA Pharmaceutical Packaging Industry Revenue Share (%), by Country 2024 & 2032
List of Tables
- Table 1: Global MEA Pharmaceutical Packaging Industry Revenue Million Forecast, by Region 2019 & 2032
- Table 2: Global MEA Pharmaceutical Packaging Industry Revenue Million Forecast, by Material Type 2019 & 2032
- Table 3: Global MEA Pharmaceutical Packaging Industry Revenue Million Forecast, by Product Type 2019 & 2032
- Table 4: Global MEA Pharmaceutical Packaging Industry Revenue Million Forecast, by Region 2019 & 2032
- Table 5: Global MEA Pharmaceutical Packaging Industry Revenue Million Forecast, by Country 2019 & 2032
- Table 6: MEA Pharmaceutical Packaging Industry Revenue (Million) Forecast, by Application 2019 & 2032
- Table 7: Global MEA Pharmaceutical Packaging Industry Revenue Million Forecast, by Country 2019 & 2032
- Table 8: United Kingdom MEA Pharmaceutical Packaging Industry Revenue (Million) Forecast, by Application 2019 & 2032
- Table 9: Germany MEA Pharmaceutical Packaging Industry Revenue (Million) Forecast, by Application 2019 & 2032
- Table 10: France MEA Pharmaceutical Packaging Industry Revenue (Million) Forecast, by Application 2019 & 2032
- Table 11: Spain MEA Pharmaceutical Packaging Industry Revenue (Million) Forecast, by Application 2019 & 2032
- Table 12: Rest of Europe MEA Pharmaceutical Packaging Industry Revenue (Million) Forecast, by Application 2019 & 2032
- Table 13: Global MEA Pharmaceutical Packaging Industry Revenue Million Forecast, by Material Type 2019 & 2032
- Table 14: Global MEA Pharmaceutical Packaging Industry Revenue Million Forecast, by Product Type 2019 & 2032
- Table 15: Global MEA Pharmaceutical Packaging Industry Revenue Million Forecast, by Country 2019 & 2032
- Table 16: United States MEA Pharmaceutical Packaging Industry Revenue (Million) Forecast, by Application 2019 & 2032
- Table 17: Canada MEA Pharmaceutical Packaging Industry Revenue (Million) Forecast, by Application 2019 & 2032
- Table 18: Mexico MEA Pharmaceutical Packaging Industry Revenue (Million) Forecast, by Application 2019 & 2032
- Table 19: Global MEA Pharmaceutical Packaging Industry Revenue Million Forecast, by Material Type 2019 & 2032
- Table 20: Global MEA Pharmaceutical Packaging Industry Revenue Million Forecast, by Product Type 2019 & 2032
- Table 21: Global MEA Pharmaceutical Packaging Industry Revenue Million Forecast, by Country 2019 & 2032
- Table 22: Brazil MEA Pharmaceutical Packaging Industry Revenue (Million) Forecast, by Application 2019 & 2032
- Table 23: Argentina MEA Pharmaceutical Packaging Industry Revenue (Million) Forecast, by Application 2019 & 2032
- Table 24: Rest of South America MEA Pharmaceutical Packaging Industry Revenue (Million) Forecast, by Application 2019 & 2032
- Table 25: Global MEA Pharmaceutical Packaging Industry Revenue Million Forecast, by Material Type 2019 & 2032
- Table 26: Global MEA Pharmaceutical Packaging Industry Revenue Million Forecast, by Product Type 2019 & 2032
- Table 27: Global MEA Pharmaceutical Packaging Industry Revenue Million Forecast, by Country 2019 & 2032
- Table 28: United Kingdom MEA Pharmaceutical Packaging Industry Revenue (Million) Forecast, by Application 2019 & 2032
- Table 29: Germany MEA Pharmaceutical Packaging Industry Revenue (Million) Forecast, by Application 2019 & 2032
- Table 30: France MEA Pharmaceutical Packaging Industry Revenue (Million) Forecast, by Application 2019 & 2032
- Table 31: Italy MEA Pharmaceutical Packaging Industry Revenue (Million) Forecast, by Application 2019 & 2032
- Table 32: Spain MEA Pharmaceutical Packaging Industry Revenue (Million) Forecast, by Application 2019 & 2032
- Table 33: Russia MEA Pharmaceutical Packaging Industry Revenue (Million) Forecast, by Application 2019 & 2032
- Table 34: Benelux MEA Pharmaceutical Packaging Industry Revenue (Million) Forecast, by Application 2019 & 2032
- Table 35: Nordics MEA Pharmaceutical Packaging Industry Revenue (Million) Forecast, by Application 2019 & 2032
- Table 36: Rest of Europe MEA Pharmaceutical Packaging Industry Revenue (Million) Forecast, by Application 2019 & 2032
- Table 37: Global MEA Pharmaceutical Packaging Industry Revenue Million Forecast, by Material Type 2019 & 2032
- Table 38: Global MEA Pharmaceutical Packaging Industry Revenue Million Forecast, by Product Type 2019 & 2032
- Table 39: Global MEA Pharmaceutical Packaging Industry Revenue Million Forecast, by Country 2019 & 2032
- Table 40: Turkey MEA Pharmaceutical Packaging Industry Revenue (Million) Forecast, by Application 2019 & 2032
- Table 41: Israel MEA Pharmaceutical Packaging Industry Revenue (Million) Forecast, by Application 2019 & 2032
- Table 42: GCC MEA Pharmaceutical Packaging Industry Revenue (Million) Forecast, by Application 2019 & 2032
- Table 43: North Africa MEA Pharmaceutical Packaging Industry Revenue (Million) Forecast, by Application 2019 & 2032
- Table 44: South Africa MEA Pharmaceutical Packaging Industry Revenue (Million) Forecast, by Application 2019 & 2032
- Table 45: Rest of Middle East & Africa MEA Pharmaceutical Packaging Industry Revenue (Million) Forecast, by Application 2019 & 2032
- Table 46: Global MEA Pharmaceutical Packaging Industry Revenue Million Forecast, by Material Type 2019 & 2032
- Table 47: Global MEA Pharmaceutical Packaging Industry Revenue Million Forecast, by Product Type 2019 & 2032
- Table 48: Global MEA Pharmaceutical Packaging Industry Revenue Million Forecast, by Country 2019 & 2032
- Table 49: China MEA Pharmaceutical Packaging Industry Revenue (Million) Forecast, by Application 2019 & 2032
- Table 50: India MEA Pharmaceutical Packaging Industry Revenue (Million) Forecast, by Application 2019 & 2032
- Table 51: Japan MEA Pharmaceutical Packaging Industry Revenue (Million) Forecast, by Application 2019 & 2032
- Table 52: South Korea MEA Pharmaceutical Packaging Industry Revenue (Million) Forecast, by Application 2019 & 2032
- Table 53: ASEAN MEA Pharmaceutical Packaging Industry Revenue (Million) Forecast, by Application 2019 & 2032
- Table 54: Oceania MEA Pharmaceutical Packaging Industry Revenue (Million) Forecast, by Application 2019 & 2032
- Table 55: Rest of Asia Pacific MEA Pharmaceutical Packaging Industry Revenue (Million) Forecast, by Application 2019 & 2032
Frequently Asked Questions
1. What is the projected Compound Annual Growth Rate (CAGR) of the MEA Pharmaceutical Packaging Industry?
The projected CAGR is approximately 6.70%.
2. Which companies are prominent players in the MEA Pharmaceutical Packaging Industry?
Key companies in the market include Medical Packaging ( S A E), Schott AG, General Plastics Limited, Amcor Worldwide, Saudi Arabia plastic Packaging Systems Co, Rexam PLC, Sealed Air Corporation, Rose Plastics Medical Packagin, Frank NOE Limited, Indevco Group.
3. What are the main segments of the MEA Pharmaceutical Packaging Industry?
The market segments include Material Type, Product Type.
4. Can you provide details about the market size?
The market size is estimated to be USD XX Million as of 2022.
5. What are some drivers contributing to market growth?
Rising Awareness of Environmental Issues and Adoption of New Regulatory Standards; Surging Number of Chronic Disease Cases.
6. What are the notable trends driving market growth?
Bottle Packaging segment to hold biggest operating expense.
7. Are there any restraints impacting market growth?
Fluctuations in Raw Material Cost Due to Suppliers Bargaining Power.
8. Can you provide examples of recent developments in the market?
Feb 2021 - Indevco Plastics has innovated print-grade shrink bundling film for multi-packs that delivers a circular plastics solution. Using 50% post-consumer recycled resin, the collation shrink is fully recyclable. INDEVCO Plastics co-developed the film with Dow, a fellow member of the Alliance to End plastic Waste, for food and beverage manufacturers who bundle products in multi-unit packages.
9. What pricing options are available for accessing the report?
Pricing options include single-user, multi-user, and enterprise licenses priced at USD 4750, USD 5250, and USD 8750 respectively.
10. Is the market size provided in terms of value or volume?
The market size is provided in terms of value, measured in Million.
11. Are there any specific market keywords associated with the report?
Yes, the market keyword associated with the report is "MEA Pharmaceutical Packaging Industry," which aids in identifying and referencing the specific market segment covered.
12. How do I determine which pricing option suits my needs best?
The pricing options vary based on user requirements and access needs. Individual users may opt for single-user licenses, while businesses requiring broader access may choose multi-user or enterprise licenses for cost-effective access to the report.
13. Are there any additional resources or data provided in the MEA Pharmaceutical Packaging Industry report?
While the report offers comprehensive insights, it's advisable to review the specific contents or supplementary materials provided to ascertain if additional resources or data are available.
14. How can I stay updated on further developments or reports in the MEA Pharmaceutical Packaging Industry?
To stay informed about further developments, trends, and reports in the MEA Pharmaceutical Packaging Industry, consider subscribing to industry newsletters, following relevant companies and organizations, or regularly checking reputable industry news sources and publications.
Methodology
Step 1 - Identification of Relevant Samples Size from Population Database


Step 2 - Approaches for Defining Global Market Size (Value, Volume* & Price*)

Note*: In applicable scenarios
Step 3 - Data Sources
Primary Research
- Web Analytics
- Survey Reports
- Research Institute
- Latest Research Reports
- Opinion Leaders
Secondary Research
- Annual Reports
- White Paper
- Latest Press Release
- Industry Association
- Paid Database
- Investor Presentations

Step 4 - Data Triangulation
Involves using different sources of information in order to increase the validity of a study
These sources are likely to be stakeholders in a program - participants, other researchers, program staff, other community members, and so on.
Then we put all data in single framework & apply various statistical tools to find out the dynamic on the market.
During the analysis stage, feedback from the stakeholder groups would be compared to determine areas of agreement as well as areas of divergence


