

Key Insights
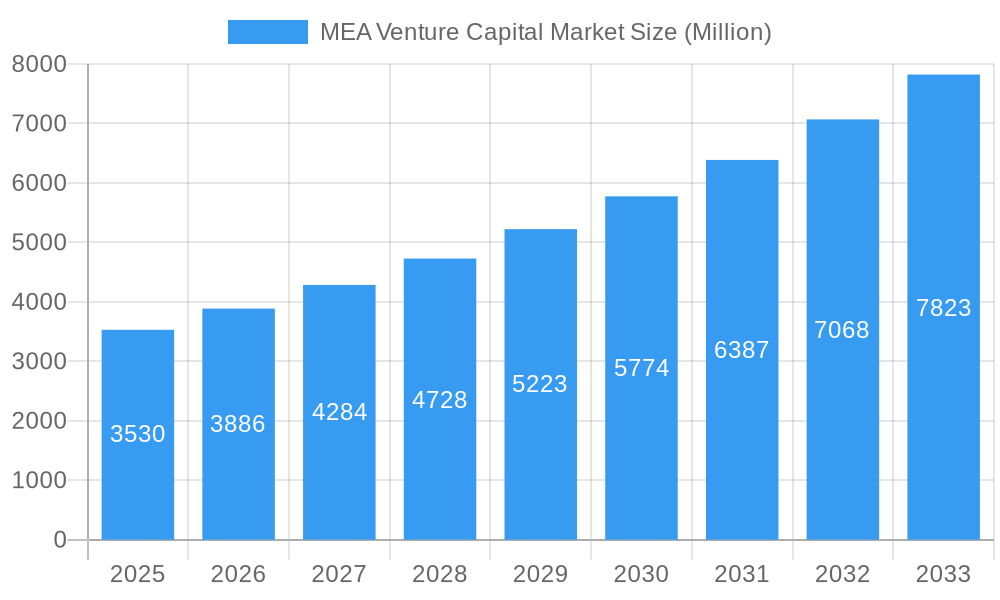
The Middle East and Africa (MEA) venture capital market is experiencing robust growth, projected to reach \$3.53 billion in 2025 and maintain a Compound Annual Growth Rate (CAGR) of 10.20% from 2025 to 2033. This expansion is fueled by several key drivers. Firstly, a burgeoning entrepreneurial ecosystem within the region, particularly in countries like the UAE and Saudi Arabia, is attracting significant investment. Government initiatives promoting innovation and diversification of national economies are further stimulating growth. Secondly, the increasing availability of technology and digital infrastructure is enabling the rise of disruptive startups across various sectors. Finally, a growing number of both local and international venture capital firms are actively seeking investment opportunities in the MEA region, further fueling market expansion. The sectors attracting the most attention include real estate, financial services, food and beverage, healthcare, transport and logistics, IT and ITeS, and education, reflecting the diverse and dynamic nature of the MEA economy. While challenges remain, such as regulatory hurdles and a relatively nascent investor landscape compared to mature markets, the strong growth trajectory suggests a promising future for the MEA venture capital market.
MEA Venture Capital Market Market Size (In Billion)
The continued high CAGR indicates that the market will likely surpass \$8 billion by 2033. This growth will be unevenly distributed across the region, with the UAE and Saudi Arabia likely capturing a significant share due to their advanced infrastructure and supportive government policies. However, other countries within the MEA region also show strong potential for growth, driven by their own unique strengths and developing startup scenes. The competitive landscape includes a mix of established international venture capital firms and emerging local players, fostering a dynamic and increasingly sophisticated market. As the MEA region continues its economic and technological transformation, the venture capital market is poised to play a vital role in driving innovation and fostering economic diversification across various sectors. Continued government support and the influx of foreign investment are key factors expected to further drive this positive trajectory in the coming years.
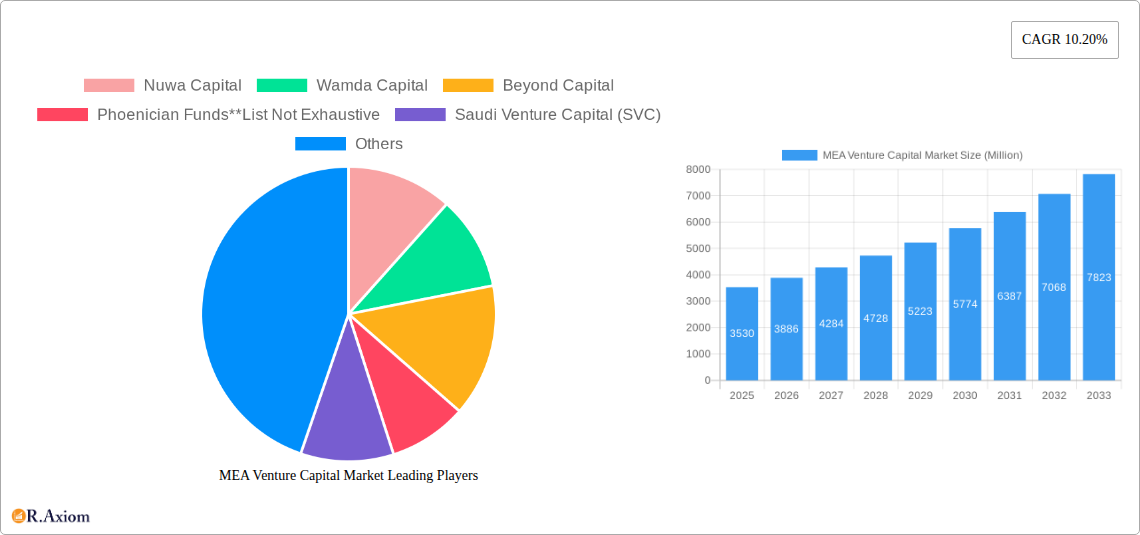
MEA Venture Capital Market Company Market Share
MEA Venture Capital Market: A Comprehensive Report (2019-2033)
This detailed report provides a comprehensive analysis of the Middle East and Africa (MEA) Venture Capital market, covering the period from 2019 to 2033. It offers valuable insights into market dynamics, key players, investment trends, and future growth prospects, equipping stakeholders with actionable intelligence for strategic decision-making. The report utilizes a robust methodology, incorporating historical data (2019-2024), a base year of 2025, and forecasts extending to 2033. Total market value figures are expressed in Millions of USD.
MEA Venture Capital Market Concentration & Innovation
This section analyzes the MEA venture capital market's concentration, innovation drivers, regulatory landscape, and competitive dynamics. We examine market share distribution among key players, the influence of regulatory frameworks on investment activity, and the impact of mergers and acquisitions (M&A) on market structure. We also explore innovation drivers such as technological advancements and evolving consumer preferences.
Market Concentration: The MEA venture capital market exhibits a moderately concentrated structure, with a few dominant players commanding significant market share. However, the market also features a growing number of smaller, niche players. Further analysis reveals that the xx% market share is held by the top 5 players.
Innovation Drivers: Technological advancements, particularly in fintech, e-commerce, and healthcare, are driving significant innovation within the MEA venture capital landscape. Government initiatives promoting entrepreneurship also stimulate innovation.
Regulatory Framework: Regulatory policies, including those related to foreign investment and intellectual property protection, significantly impact the market's growth trajectory. Streamlined regulatory processes foster a more favorable investment climate.
M&A Activity: M&A activity has played a crucial role in shaping the market's competitive dynamics. In 2024, M&A deals totaled approximately xx Million, with average deal values around xx Million. These activities contribute to market consolidation and expansion.
End-User Trends: The increasing adoption of digital technologies and changing consumer preferences are influencing investment trends in the MEA venture capital market. Investments are heavily concentrated in sectors catering to these evolving needs.
MEA Venture Capital Market Industry Trends & Insights
This section delves into the key trends and insights shaping the MEA venture capital market. We analyze market growth drivers, technological disruptions, consumer preferences, and competitive dynamics, providing a comprehensive overview of market evolution. The Compound Annual Growth Rate (CAGR) during the forecast period (2025-2033) is estimated at xx%. Market penetration is expected to reach xx% by 2033.
The MEA venture capital market is experiencing robust growth fueled by several factors. Rising disposable incomes, increased internet and smartphone penetration, and a burgeoning entrepreneurial ecosystem are driving demand for venture capital funding. Government initiatives aimed at promoting entrepreneurship and fostering technological innovation are further fueling market expansion. Technological advancements, especially within fintech, are disrupting traditional business models, creating new opportunities for investment. Competitive dynamics are characterized by a mix of established players and emerging startups vying for market share.
Dominant Markets & Segments in MEA Venture Capital Market
This section identifies the leading regions, countries, and segments within the MEA venture capital market. We analyze the key drivers of dominance, including economic policies, infrastructure development, and regulatory frameworks.
By Type: International investors currently hold a larger market share compared to local investors. This is driven by the increasing influx of foreign capital seeking opportunities in the rapidly developing MEA region. However, local investors are experiencing notable growth due to increasing government support.
By Industry: The IT and ITeS sector is currently the most dominant industry attracting the largest portion of venture capital investment, followed by the Fintech and the Healthcare sector. Strong growth in these industries is primarily driven by the region's growing population, increasing digital adoption, and government initiatives.
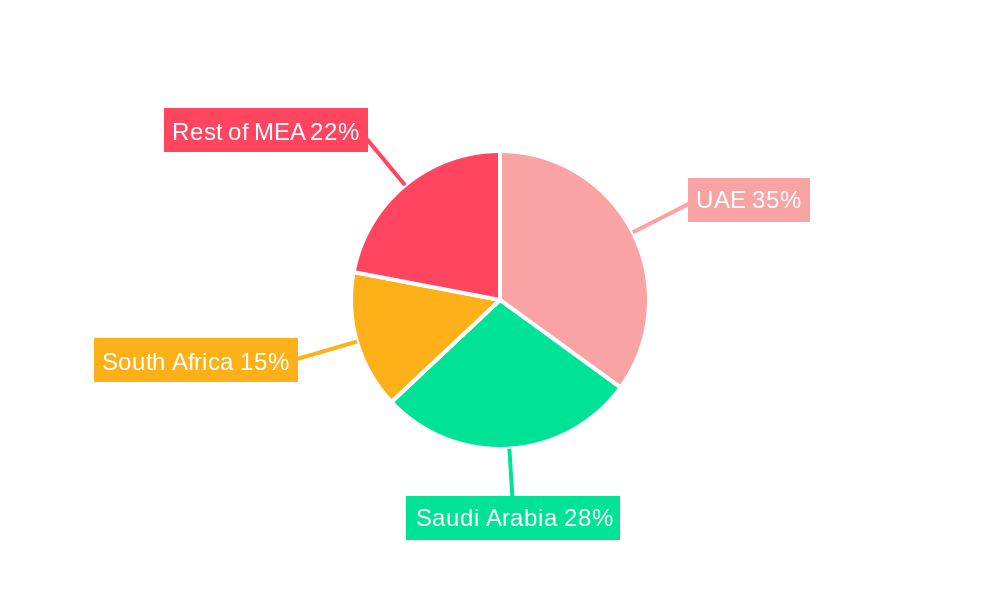
Regional Dominance: The United Arab Emirates (UAE) and Saudi Arabia are currently the leading markets, accounting for the significant portion of total investments. This dominance is fueled by strong government support for entrepreneurship, robust infrastructure, and a favorable business environment. Other regions show promising growth potential, presenting considerable investment opportunities.
MEA Venture Capital Market Product Developments
The MEA venture capital market is experiencing a dynamic wave of product development, largely propelled by cutting-edge technology. Significant advancements are being seen in sectors like Fintech, where digital payment solutions, blockchain innovations, and AI-driven financial advisory tools are revolutionizing how individuals and businesses manage their money. The e-commerce landscape is evolving with sophisticated AI-powered recommendation engines, enhanced last-mile delivery logistics, and immersive online shopping experiences. In healthcare, digital health platforms, AI for diagnostics, telehealth services, and personalized medicine solutions are emerging as key areas of innovation, all attracting considerable venture capital interest. These innovations are not just about novelty; they are strategically designed to deliver tangible benefits, including enhanced operational efficiency, superior user engagement, and substantial cost savings, thereby creating a strong competitive edge for businesses in the region.
Report Scope & Segmentation Analysis
This report segments the MEA venture capital market by investor type (local and international) and industry (Real Estate, Financial Services, Food & Beverage, Healthcare, Transport and Logistics, IT and ITeS, Education, and Other Industries).
By Investor Type: The Local Investor segment is projected to experience a xx% CAGR, while the International Investor segment is anticipated to grow at xx% CAGR during the forecast period. Competitive dynamics vary significantly between these two segments, with international investors often bringing more specialized expertise and larger capital pools.
By Industry: The IT and ITeS segment is expected to show the highest growth potential, with a projected CAGR of xx%, driven by increased digital adoption and government initiatives promoting technological advancements. Other sectors such as FinTech and Healthcare also exhibit promising growth prospects.
Key Drivers of MEA Venture Capital Market Growth
Several factors drive the growth of the MEA venture capital market. These include government initiatives promoting entrepreneurship, a burgeoning startup ecosystem, and increasing investment from international venture capital firms. Rapid technological advancements, particularly in FinTech and e-commerce, are also creating lucrative investment opportunities. Moreover, favorable demographic trends, including a young and growing population, contribute significantly to this growth.
Challenges in the MEA Venture Capital Market Sector
Despite significant growth potential, the MEA venture capital market faces certain challenges. Regulatory hurdles and bureaucratic complexities can create obstacles for investors. Access to funding for early-stage startups remains a challenge. Furthermore, limited infrastructure in some regions and competition from established players can pose barriers to growth. The impact of these challenges varies depending on geographic location and industry segment.
Emerging Opportunities in MEA Venture Capital Market
The MEA venture capital market is a fertile ground for emerging opportunities. The rapid expansion of the digital economy, fueled by increasing internet penetration and smartphone adoption, continues to create a burgeoning landscape for e-commerce, on-demand services, and digital content platforms. Governments across the region are actively championing entrepreneurship and digital transformation through various initiatives, including incubators, accelerators, and favorable regulatory frameworks, which are vital catalysts for startup growth. Beyond the established sectors, underpenetrated industries like renewable energy, particularly solar and wind power solutions, and the healthcare sector, with its growing demand for accessible and advanced medical services, present substantial and largely untapped investment avenues. Furthermore, the burgeoning tourism and hospitality sectors are also ripe for digital disruption and innovation.
Leading Players in the MEA Venture Capital Market Market
- Nuwa Capital
- Wamda Capital
- Beyond Capital
- Phoenician Funds
- Saudi Venture Capital (SVC)
- Falt6Labs Bahrain
- Global ventures
- Vision Ventures
- Algebra Ventures
- 500 Startups
Key Developments in MEA Venture Capital Market Industry
-
February 2023: The Saudi Venture Capital Investment Company (SVC) launched a USD 1 Million income growth fund (SVC Sukuk Fund). This strategic initiative is designed to stimulate investments in income-generating ventures, providing a stable and consistent return for investors while fostering business growth within the Kingdom.
-
February 2023: Flat6Labs successfully completed the first close of its USD 20 Million 'Startup Seed Fund' in Saudi Arabia. Significantly, this fund saw participation from the Saudi Venture Capital Company (SVC) and the 'Jada' Fund of Funds, marking a crucial milestone and injecting substantial capital into the early-stage startup ecosystem, signaling strong support for nascent businesses.
Strategic Outlook for MEA Venture Capital Market Market
The MEA venture capital market is poised for robust and sustained growth, underpinned by a compelling demographic profile characterized by a young, tech-savvy, and growing population. The accelerating pace of digital adoption across various segments of society, coupled with increasingly supportive and forward-thinking government policies aimed at economic diversification and innovation, are key drivers. The continuous influx of international investment, attracted by the region's untapped potential and vibrant startup scene, will undoubtedly fuel further expansion. The emergence of groundbreaking innovative startups, addressing local needs and global trends, will also be instrumental. Moving forward, a greater emphasis on strategic partnerships and collaborative ecosystems between established venture capital firms, corporations, and government entities will be paramount. These alliances will foster knowledge sharing, market access, and synergistic growth opportunities, ultimately shaping a more mature and dynamic MEA venture capital landscape across a diverse spectrum of industries.
MEA Venture Capital Market Segmentation
-
1. Type
- 1.1. Local Investors
- 1.2. International Investors
-
2. Industry
- 2.1. Real Estate
- 2.2. Financial Services
- 2.3. Food & Beverage
- 2.4. Healthcare
- 2.5. Transport and Logistics
- 2.6. IT and ITeS
- 2.7. Education
- 2.8. Other Industries (Energy, etc.)
MEA Venture Capital Market Segmentation By Geography
-
1. North America
- 1.1. United States
- 1.2. Canada
- 1.3. Mexico
-
2. South America
- 2.1. Brazil
- 2.2. Argentina
- 2.3. Rest of South America
-
3. Europe
- 3.1. United Kingdom
- 3.2. Germany
- 3.3. France
- 3.4. Italy
- 3.5. Spain
- 3.6. Russia
- 3.7. Benelux
- 3.8. Nordics
- 3.9. Rest of Europe
-
4. Middle East & Africa
- 4.1. Turkey
- 4.2. Israel
- 4.3. GCC
- 4.4. North Africa
- 4.5. South Africa
- 4.6. Rest of Middle East & Africa
-
5. Asia Pacific
- 5.1. China
- 5.2. India
- 5.3. Japan
- 5.4. South Korea
- 5.5. ASEAN
- 5.6. Oceania
- 5.7. Rest of Asia Pacific
MEA Venture Capital Market Regional Market Share
Geographic Coverage of MEA Venture Capital Market
MEA Venture Capital Market REPORT HIGHLIGHTS
| Aspects | Details |
|---|---|
| Study Period | 2020-2034 |
| Base Year | 2025 |
| Estimated Year | 2026 |
| Forecast Period | 2026-2034 |
| Historical Period | 2020-2025 |
| Growth Rate | CAGR of 10.20% from 2020-2034 |
| Segmentation |
|
Table of Contents
- 1. Introduction
- 1.1. Research Scope
- 1.2. Market Segmentation
- 1.3. Research Objective
- 1.4. Definitions and Assumptions
- 2. Executive Summary
- 2.1. Market Snapshot
- 3. Market Dynamics
- 3.1. Market Drivers
- 3.2. Market Restrains
- 3.3. Market Trends
- 3.4. Market Opportunities
- 4. Market Factor Analysis
- 4.1. Porters Five Forces
- 4.1.1. Bargaining Power of Suppliers
- 4.1.2. Bargaining Power of Buyers
- 4.1.3. Threat of New Entrants
- 4.1.4. Threat of Substitutes
- 4.1.5. Competitive Rivalry
- 4.2. PESTEL analysis
- 4.3. BCG Analysis
- 4.3.1. Stars (High Growth, High Market Share)
- 4.3.2. Cash Cows (Low Growth, High Market Share)
- 4.3.3. Question Mark (High Growth, Low Market Share)
- 4.3.4. Dogs (Low Growth, Low Market Share)
- 4.4. Ansoff Matrix Analysis
- 4.5. Supply Chain Analysis
- 4.6. Regulatory Landscape
- 4.7. Current Market Potential and Opportunity Assessment (TAM–SAM–SOM Framework)
- 4.8. RAX Analyst Note
- 4.1. Porters Five Forces
- 5. Market Analysis, Insights and Forecast 2021-2033
- 5.1. Market Analysis, Insights and Forecast - by Type
- 5.1.1. Local Investors
- 5.1.2. International Investors
- 5.2. Market Analysis, Insights and Forecast - by Industry
- 5.2.1. Real Estate
- 5.2.2. Financial Services
- 5.2.3. Food & Beverage
- 5.2.4. Healthcare
- 5.2.5. Transport and Logistics
- 5.2.6. IT and ITeS
- 5.2.7. Education
- 5.2.8. Other Industries (Energy, etc.)
- 5.3. Market Analysis, Insights and Forecast - by Region
- 5.3.1. North America
- 5.3.2. South America
- 5.3.3. Europe
- 5.3.4. Middle East & Africa
- 5.3.5. Asia Pacific
- 5.1. Market Analysis, Insights and Forecast - by Type
- 6. Global MEA Venture Capital Market Analysis, Insights and Forecast, 2021-2033
- 6.1. Market Analysis, Insights and Forecast - by Type
- 6.1.1. Local Investors
- 6.1.2. International Investors
- 6.2. Market Analysis, Insights and Forecast - by Industry
- 6.2.1. Real Estate
- 6.2.2. Financial Services
- 6.2.3. Food & Beverage
- 6.2.4. Healthcare
- 6.2.5. Transport and Logistics
- 6.2.6. IT and ITeS
- 6.2.7. Education
- 6.2.8. Other Industries (Energy, etc.)
- 6.1. Market Analysis, Insights and Forecast - by Type
- 7. North America MEA Venture Capital Market Analysis, Insights and Forecast, 2020-2032
- 7.1. Market Analysis, Insights and Forecast - by Type
- 7.1.1. Local Investors
- 7.1.2. International Investors
- 7.2. Market Analysis, Insights and Forecast - by Industry
- 7.2.1. Real Estate
- 7.2.2. Financial Services
- 7.2.3. Food & Beverage
- 7.2.4. Healthcare
- 7.2.5. Transport and Logistics
- 7.2.6. IT and ITeS
- 7.2.7. Education
- 7.2.8. Other Industries (Energy, etc.)
- 7.1. Market Analysis, Insights and Forecast - by Type
- 8. South America MEA Venture Capital Market Analysis, Insights and Forecast, 2020-2032
- 8.1. Market Analysis, Insights and Forecast - by Type
- 8.1.1. Local Investors
- 8.1.2. International Investors
- 8.2. Market Analysis, Insights and Forecast - by Industry
- 8.2.1. Real Estate
- 8.2.2. Financial Services
- 8.2.3. Food & Beverage
- 8.2.4. Healthcare
- 8.2.5. Transport and Logistics
- 8.2.6. IT and ITeS
- 8.2.7. Education
- 8.2.8. Other Industries (Energy, etc.)
- 8.1. Market Analysis, Insights and Forecast - by Type
- 9. Europe MEA Venture Capital Market Analysis, Insights and Forecast, 2020-2032
- 9.1. Market Analysis, Insights and Forecast - by Type
- 9.1.1. Local Investors
- 9.1.2. International Investors
- 9.2. Market Analysis, Insights and Forecast - by Industry
- 9.2.1. Real Estate
- 9.2.2. Financial Services
- 9.2.3. Food & Beverage
- 9.2.4. Healthcare
- 9.2.5. Transport and Logistics
- 9.2.6. IT and ITeS
- 9.2.7. Education
- 9.2.8. Other Industries (Energy, etc.)
- 9.1. Market Analysis, Insights and Forecast - by Type
- 10. Middle East & Africa MEA Venture Capital Market Analysis, Insights and Forecast, 2020-2032
- 10.1. Market Analysis, Insights and Forecast - by Type
- 10.1.1. Local Investors
- 10.1.2. International Investors
- 10.2. Market Analysis, Insights and Forecast - by Industry
- 10.2.1. Real Estate
- 10.2.2. Financial Services
- 10.2.3. Food & Beverage
- 10.2.4. Healthcare
- 10.2.5. Transport and Logistics
- 10.2.6. IT and ITeS
- 10.2.7. Education
- 10.2.8. Other Industries (Energy, etc.)
- 10.1. Market Analysis, Insights and Forecast - by Type
- 11. Asia Pacific MEA Venture Capital Market Analysis, Insights and Forecast, 2020-2032
- 11.1. Market Analysis, Insights and Forecast - by Type
- 11.1.1. Local Investors
- 11.1.2. International Investors
- 11.2. Market Analysis, Insights and Forecast - by Industry
- 11.2.1. Real Estate
- 11.2.2. Financial Services
- 11.2.3. Food & Beverage
- 11.2.4. Healthcare
- 11.2.5. Transport and Logistics
- 11.2.6. IT and ITeS
- 11.2.7. Education
- 11.2.8. Other Industries (Energy, etc.)
- 11.1. Market Analysis, Insights and Forecast - by Type
- 12. Competitive Analysis
- 12.1. Company Profiles
- 12.1.1 Nuwa Capital
- 12.1.1.1. Company Overview
- 12.1.1.2. Products
- 12.1.1.3. Company Financials
- 12.1.1.4. SWOT Analysis
- 12.1.2 Wamda Capital
- 12.1.2.1. Company Overview
- 12.1.2.2. Products
- 12.1.2.3. Company Financials
- 12.1.2.4. SWOT Analysis
- 12.1.3 Beyond Capital
- 12.1.3.1. Company Overview
- 12.1.3.2. Products
- 12.1.3.3. Company Financials
- 12.1.3.4. SWOT Analysis
- 12.1.4 Phoenician Funds**List Not Exhaustive
- 12.1.4.1. Company Overview
- 12.1.4.2. Products
- 12.1.4.3. Company Financials
- 12.1.4.4. SWOT Analysis
- 12.1.5 Saudi Venture Capital (SVC)
- 12.1.5.1. Company Overview
- 12.1.5.2. Products
- 12.1.5.3. Company Financials
- 12.1.5.4. SWOT Analysis
- 12.1.6 Falt6Labs Bahrain
- 12.1.6.1. Company Overview
- 12.1.6.2. Products
- 12.1.6.3. Company Financials
- 12.1.6.4. SWOT Analysis
- 12.1.7 Global ventures
- 12.1.7.1. Company Overview
- 12.1.7.2. Products
- 12.1.7.3. Company Financials
- 12.1.7.4. SWOT Analysis
- 12.1.8 Vision Ventures
- 12.1.8.1. Company Overview
- 12.1.8.2. Products
- 12.1.8.3. Company Financials
- 12.1.8.4. SWOT Analysis
- 12.1.9 Algebra Ventures
- 12.1.9.1. Company Overview
- 12.1.9.2. Products
- 12.1.9.3. Company Financials
- 12.1.9.4. SWOT Analysis
- 12.1.10 500 Startups
- 12.1.10.1. Company Overview
- 12.1.10.2. Products
- 12.1.10.3. Company Financials
- 12.1.10.4. SWOT Analysis
- 12.1.1 Nuwa Capital
- 12.2. Market Entropy
- 12.2.1 Company's Key Areas Served
- 12.2.2 Recent Developments
- 12.3. Company Market Share Analysis 2025
- 12.3.1 Top 5 Companies Market Share Analysis
- 12.3.2 Top 3 Companies Market Share Analysis
- 12.4. List of Potential Customers
- 13. Research Methodology
List of Figures
- Figure 1: Global MEA Venture Capital Market Revenue Breakdown (Million, %) by Region 2025 & 2033
- Figure 2: North America MEA Venture Capital Market Revenue (Million), by Type 2025 & 2033
- Figure 3: North America MEA Venture Capital Market Revenue Share (%), by Type 2025 & 2033
- Figure 4: North America MEA Venture Capital Market Revenue (Million), by Industry 2025 & 2033
- Figure 5: North America MEA Venture Capital Market Revenue Share (%), by Industry 2025 & 2033
- Figure 6: North America MEA Venture Capital Market Revenue (Million), by Country 2025 & 2033
- Figure 7: North America MEA Venture Capital Market Revenue Share (%), by Country 2025 & 2033
- Figure 8: South America MEA Venture Capital Market Revenue (Million), by Type 2025 & 2033
- Figure 9: South America MEA Venture Capital Market Revenue Share (%), by Type 2025 & 2033
- Figure 10: South America MEA Venture Capital Market Revenue (Million), by Industry 2025 & 2033
- Figure 11: South America MEA Venture Capital Market Revenue Share (%), by Industry 2025 & 2033
- Figure 12: South America MEA Venture Capital Market Revenue (Million), by Country 2025 & 2033
- Figure 13: South America MEA Venture Capital Market Revenue Share (%), by Country 2025 & 2033
- Figure 14: Europe MEA Venture Capital Market Revenue (Million), by Type 2025 & 2033
- Figure 15: Europe MEA Venture Capital Market Revenue Share (%), by Type 2025 & 2033
- Figure 16: Europe MEA Venture Capital Market Revenue (Million), by Industry 2025 & 2033
- Figure 17: Europe MEA Venture Capital Market Revenue Share (%), by Industry 2025 & 2033
- Figure 18: Europe MEA Venture Capital Market Revenue (Million), by Country 2025 & 2033
- Figure 19: Europe MEA Venture Capital Market Revenue Share (%), by Country 2025 & 2033
- Figure 20: Middle East & Africa MEA Venture Capital Market Revenue (Million), by Type 2025 & 2033
- Figure 21: Middle East & Africa MEA Venture Capital Market Revenue Share (%), by Type 2025 & 2033
- Figure 22: Middle East & Africa MEA Venture Capital Market Revenue (Million), by Industry 2025 & 2033
- Figure 23: Middle East & Africa MEA Venture Capital Market Revenue Share (%), by Industry 2025 & 2033
- Figure 24: Middle East & Africa MEA Venture Capital Market Revenue (Million), by Country 2025 & 2033
- Figure 25: Middle East & Africa MEA Venture Capital Market Revenue Share (%), by Country 2025 & 2033
- Figure 26: Asia Pacific MEA Venture Capital Market Revenue (Million), by Type 2025 & 2033
- Figure 27: Asia Pacific MEA Venture Capital Market Revenue Share (%), by Type 2025 & 2033
- Figure 28: Asia Pacific MEA Venture Capital Market Revenue (Million), by Industry 2025 & 2033
- Figure 29: Asia Pacific MEA Venture Capital Market Revenue Share (%), by Industry 2025 & 2033
- Figure 30: Asia Pacific MEA Venture Capital Market Revenue (Million), by Country 2025 & 2033
- Figure 31: Asia Pacific MEA Venture Capital Market Revenue Share (%), by Country 2025 & 2033
List of Tables
- Table 1: Global MEA Venture Capital Market Revenue Million Forecast, by Type 2020 & 2033
- Table 2: Global MEA Venture Capital Market Revenue Million Forecast, by Industry 2020 & 2033
- Table 3: Global MEA Venture Capital Market Revenue Million Forecast, by Region 2020 & 2033
- Table 4: Global MEA Venture Capital Market Revenue Million Forecast, by Type 2020 & 2033
- Table 5: Global MEA Venture Capital Market Revenue Million Forecast, by Industry 2020 & 2033
- Table 6: Global MEA Venture Capital Market Revenue Million Forecast, by Country 2020 & 2033
- Table 7: United States MEA Venture Capital Market Revenue (Million) Forecast, by Application 2020 & 2033
- Table 8: Canada MEA Venture Capital Market Revenue (Million) Forecast, by Application 2020 & 2033
- Table 9: Mexico MEA Venture Capital Market Revenue (Million) Forecast, by Application 2020 & 2033
- Table 10: Global MEA Venture Capital Market Revenue Million Forecast, by Type 2020 & 2033
- Table 11: Global MEA Venture Capital Market Revenue Million Forecast, by Industry 2020 & 2033
- Table 12: Global MEA Venture Capital Market Revenue Million Forecast, by Country 2020 & 2033
- Table 13: Brazil MEA Venture Capital Market Revenue (Million) Forecast, by Application 2020 & 2033
- Table 14: Argentina MEA Venture Capital Market Revenue (Million) Forecast, by Application 2020 & 2033
- Table 15: Rest of South America MEA Venture Capital Market Revenue (Million) Forecast, by Application 2020 & 2033
- Table 16: Global MEA Venture Capital Market Revenue Million Forecast, by Type 2020 & 2033
- Table 17: Global MEA Venture Capital Market Revenue Million Forecast, by Industry 2020 & 2033
- Table 18: Global MEA Venture Capital Market Revenue Million Forecast, by Country 2020 & 2033
- Table 19: United Kingdom MEA Venture Capital Market Revenue (Million) Forecast, by Application 2020 & 2033
- Table 20: Germany MEA Venture Capital Market Revenue (Million) Forecast, by Application 2020 & 2033
- Table 21: France MEA Venture Capital Market Revenue (Million) Forecast, by Application 2020 & 2033
- Table 22: Italy MEA Venture Capital Market Revenue (Million) Forecast, by Application 2020 & 2033
- Table 23: Spain MEA Venture Capital Market Revenue (Million) Forecast, by Application 2020 & 2033
- Table 24: Russia MEA Venture Capital Market Revenue (Million) Forecast, by Application 2020 & 2033
- Table 25: Benelux MEA Venture Capital Market Revenue (Million) Forecast, by Application 2020 & 2033
- Table 26: Nordics MEA Venture Capital Market Revenue (Million) Forecast, by Application 2020 & 2033
- Table 27: Rest of Europe MEA Venture Capital Market Revenue (Million) Forecast, by Application 2020 & 2033
- Table 28: Global MEA Venture Capital Market Revenue Million Forecast, by Type 2020 & 2033
- Table 29: Global MEA Venture Capital Market Revenue Million Forecast, by Industry 2020 & 2033
- Table 30: Global MEA Venture Capital Market Revenue Million Forecast, by Country 2020 & 2033
- Table 31: Turkey MEA Venture Capital Market Revenue (Million) Forecast, by Application 2020 & 2033
- Table 32: Israel MEA Venture Capital Market Revenue (Million) Forecast, by Application 2020 & 2033
- Table 33: GCC MEA Venture Capital Market Revenue (Million) Forecast, by Application 2020 & 2033
- Table 34: North Africa MEA Venture Capital Market Revenue (Million) Forecast, by Application 2020 & 2033
- Table 35: South Africa MEA Venture Capital Market Revenue (Million) Forecast, by Application 2020 & 2033
- Table 36: Rest of Middle East & Africa MEA Venture Capital Market Revenue (Million) Forecast, by Application 2020 & 2033
- Table 37: Global MEA Venture Capital Market Revenue Million Forecast, by Type 2020 & 2033
- Table 38: Global MEA Venture Capital Market Revenue Million Forecast, by Industry 2020 & 2033
- Table 39: Global MEA Venture Capital Market Revenue Million Forecast, by Country 2020 & 2033
- Table 40: China MEA Venture Capital Market Revenue (Million) Forecast, by Application 2020 & 2033
- Table 41: India MEA Venture Capital Market Revenue (Million) Forecast, by Application 2020 & 2033
- Table 42: Japan MEA Venture Capital Market Revenue (Million) Forecast, by Application 2020 & 2033
- Table 43: South Korea MEA Venture Capital Market Revenue (Million) Forecast, by Application 2020 & 2033
- Table 44: ASEAN MEA Venture Capital Market Revenue (Million) Forecast, by Application 2020 & 2033
- Table 45: Oceania MEA Venture Capital Market Revenue (Million) Forecast, by Application 2020 & 2033
- Table 46: Rest of Asia Pacific MEA Venture Capital Market Revenue (Million) Forecast, by Application 2020 & 2033
Frequently Asked Questions
1. What is the projected Compound Annual Growth Rate (CAGR) of the MEA Venture Capital Market?
The projected CAGR is approximately 10.20%.
2. Which companies are prominent players in the MEA Venture Capital Market?
Key companies in the market include Nuwa Capital, Wamda Capital, Beyond Capital, Phoenician Funds**List Not Exhaustive, Saudi Venture Capital (SVC), Falt6Labs Bahrain, Global ventures, Vision Ventures, Algebra Ventures, 500 Startups.
3. What are the main segments of the MEA Venture Capital Market?
The market segments include Type, Industry.
4. Can you provide details about the market size?
The market size is estimated to be USD 3.53 Million as of 2022.
5. What are some drivers contributing to market growth?
Leading Share of Passenger Vehicles in Car Sales; Quick Processing of Loan through Digital Banking.
6. What are the notable trends driving market growth?
The United Arab Emirates Attracts Higher Investments in the region.
7. Are there any restraints impacting market growth?
Rising Interest Rates Affecting New Auto Buyers Demand for Loan.
8. Can you provide examples of recent developments in the market?
February 2023: Saudi Venture Capital Investment Company launches a USD 1 million income growth fund. The Company launched a close-ended income and capital growth fund - SVC Sukuk Fund.
9. What pricing options are available for accessing the report?
Pricing options include single-user, multi-user, and enterprise licenses priced at USD 4750, USD 4950, and USD 6800 respectively.
10. Is the market size provided in terms of value or volume?
The market size is provided in terms of value, measured in Million.
11. Are there any specific market keywords associated with the report?
Yes, the market keyword associated with the report is "MEA Venture Capital Market," which aids in identifying and referencing the specific market segment covered.
12. How do I determine which pricing option suits my needs best?
The pricing options vary based on user requirements and access needs. Individual users may opt for single-user licenses, while businesses requiring broader access may choose multi-user or enterprise licenses for cost-effective access to the report.
13. Are there any additional resources or data provided in the MEA Venture Capital Market report?
While the report offers comprehensive insights, it's advisable to review the specific contents or supplementary materials provided to ascertain if additional resources or data are available.
14. How can I stay updated on further developments or reports in the MEA Venture Capital Market?
To stay informed about further developments, trends, and reports in the MEA Venture Capital Market, consider subscribing to industry newsletters, following relevant companies and organizations, or regularly checking reputable industry news sources and publications.
Methodology
Step 1 - Identification of Relevant Samples Size from Population Database


Step 2 - Approaches for Defining Global Market Size (Value, Volume* & Price*)

Note*: In applicable scenarios
Step 3 - Data Sources
Primary Research
- Web Analytics
- Survey Reports
- Research Institute
- Latest Research Reports
- Opinion Leaders
Secondary Research
- Annual Reports
- White Paper
- Latest Press Release
- Industry Association
- Paid Database
- Investor Presentations

Step 4 - Data Triangulation
Involves using different sources of information in order to increase the validity of a study
These sources are likely to be stakeholders in a program - participants, other researchers, program staff, other community members, and so on.
Then we put all data in single framework & apply various statistical tools to find out the dynamic on the market.
During the analysis stage, feedback from the stakeholder groups would be compared to determine areas of agreement as well as areas of divergence