
Key Insights
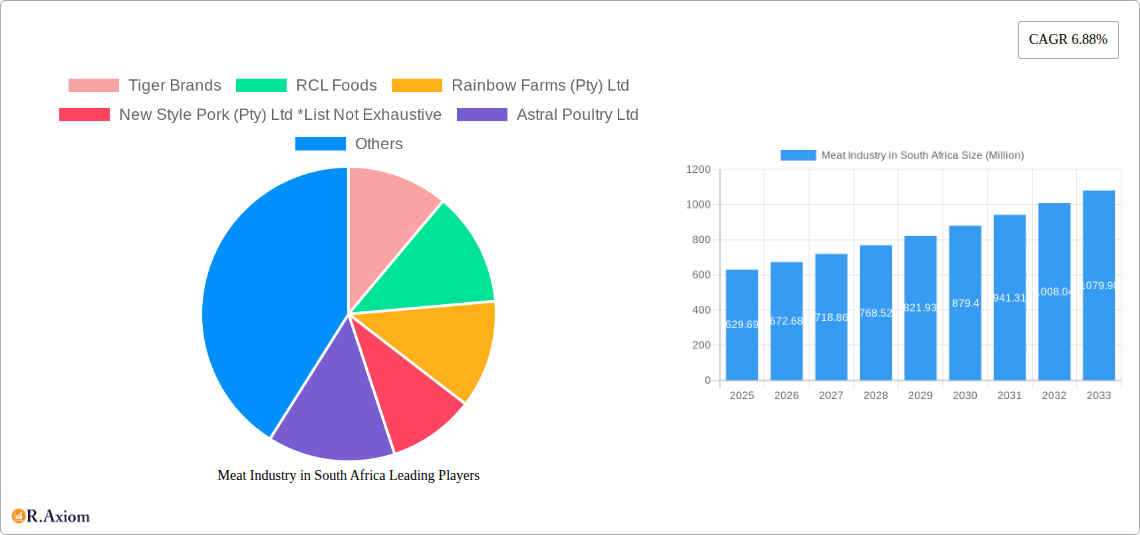
The South African meat industry, valued at $629.69 million in 2025, is projected to experience robust growth, driven by a rising population, increasing urbanization, and a growing preference for convenient, protein-rich diets. Poultry remains the dominant source, followed by pork and beef, with chilled products leading in product type preference. The market is segmented by source (poultry, pork, beef, mutton), product type (chilled, frozen, shelf-stable), and distribution channels (online and offline retail). Key players like Tiger Brands, RCL Foods, and Astral Poultry dominate the landscape, facing competition from both local and international firms. Growth is anticipated to be fueled by strategic investments in efficient processing technologies, expansion of retail networks (particularly online), and increasing consumer spending on premium meat products. However, factors such as fluctuating feed prices, stringent regulatory requirements, and potential outbreaks of animal diseases could pose challenges to sustained growth. Furthermore, the industry's environmental impact is a growing concern, with increasing pressure to adopt sustainable farming practices.
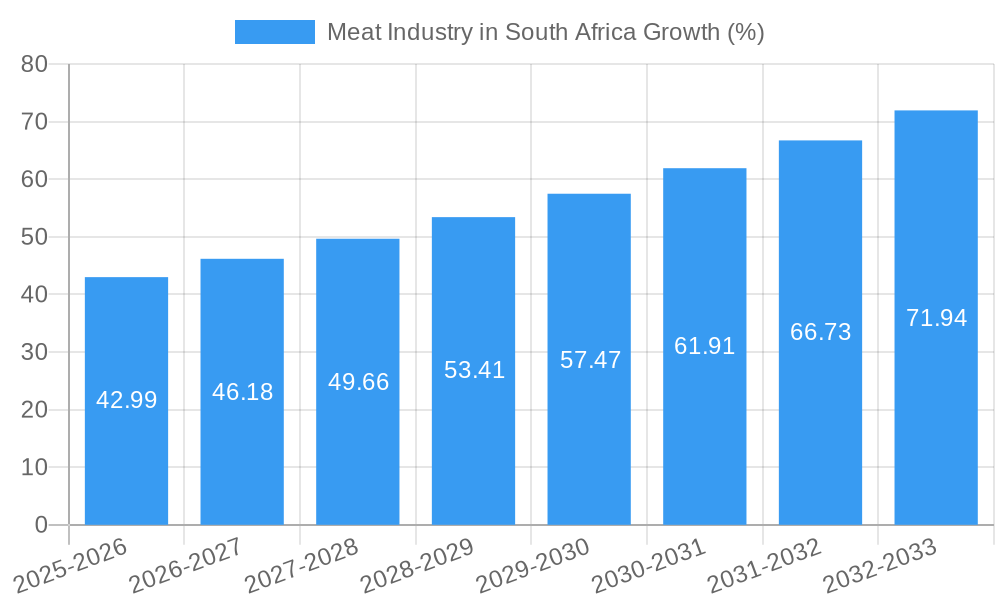
The projected Compound Annual Growth Rate (CAGR) of 6.88% suggests significant expansion through 2033. This growth will be unevenly distributed across segments. The online retail channel is expected to experience above-average growth, driven by increasing internet penetration and consumer adoption of e-commerce platforms. The demand for convenience and value-added products will likely drive the growth of processed meats and ready-to-eat options within the chilled and shelf-stable segments. Competition is intensifying, with both established players and new entrants vying for market share. Strategic partnerships, product diversification, and investments in technology and marketing will be crucial for success in this dynamic and competitive market.
Meat Industry in South Africa: A Comprehensive Market Report (2019-2033)
This detailed report provides a comprehensive analysis of the South African meat industry, encompassing market size, segmentation, competitive landscape, and future growth prospects. The study period covers 2019-2033, with 2025 as the base and estimated year. This report is crucial for industry stakeholders, investors, and businesses seeking to understand and navigate this dynamic market. The report uses the latest data available and reasonable predictions where exact figures are unavailable.
Meat Industry in South Africa: Market Concentration & Innovation
This section analyzes the South African meat market's concentration, innovation drivers, regulatory landscape, substitute products, consumer trends, and mergers and acquisitions (M&A) activity. The market is moderately concentrated, with several large players holding significant shares, but also featuring numerous smaller players, particularly in the niche markets.
- Market Concentration: The top 5 players account for approximately xx% of the market share (2024 data). This concentration is expected to slightly increase by 2033 to xx% due to consolidation and organic growth of leading players.
- Innovation Drivers: Technological advancements in livestock farming, processing, and packaging are major drivers. Growing consumer demand for convenience, sustainability, and healthier meat options further fuels innovation.
- Regulatory Framework: Stringent food safety regulations and animal welfare standards shape industry practices. Import/export policies and labeling requirements significantly impact market dynamics.
- Product Substitutes: Plant-based meat alternatives, insects, and lab-grown meat are emerging as substitutes, although their market penetration remains relatively low at xx% in 2024, projected to reach xx% by 2033.
- End-User Trends: Shifting consumer preferences towards healthier and ethically sourced meat products create both challenges and opportunities. Demand for organic, free-range, and grass-fed meat is increasing.
- M&A Activity: The industry has witnessed several M&A activities in the past five years, with deal values totaling approximately ZAR xx Million (2019-2024). Consolidation is expected to continue, driven by economies of scale and market expansion strategies. Specific examples are detailed in subsequent sections.
Meat Industry in South Africa: Industry Trends & Insights
This section delves into market growth drivers, technological disruptions, consumer preferences, and competitive dynamics within the South African meat industry. The market has shown consistent growth throughout the historical period (2019-2024), with a Compound Annual Growth Rate (CAGR) of xx%. This growth is projected to continue during the forecast period (2025-2033), though at a slightly moderated CAGR of xx%, influenced by factors like economic fluctuations and changing consumer behaviour. Key factors influencing market growth include increasing population, rising disposable incomes, and evolving dietary habits. However, challenges like rising input costs, disease outbreaks, and the impact of climate change on livestock production are also considered. Market penetration of various meat types and distribution channels provides a more nuanced perspective on the industry's composition and dynamism.
Dominant Markets & Segments in Meat Industry in South Africa
This section identifies the leading segments within the South African meat industry based on source (Poultry, Pork, Beef, Mutton), product type (Chilled, Frozen, Shelf Stable), and distribution (Online and Offline Retail Channels).
By Source:
- Poultry: Remains the dominant segment, driven by affordability and consumer preference.
- Pork: A significant segment, exhibiting steady growth.
- Beef: A substantial segment, but subject to greater price volatility.
- Mutton: A smaller segment, with growth prospects influenced by cultural consumption patterns and import dynamics.
By Product Type:
- Chilled: The largest segment, favored for freshness and immediate consumption.
- Frozen: A substantial segment, offering extended shelf life and convenience.
- Shelf Stable: A growing segment, boosted by innovations in processing and packaging.
By Distribution:
- Offline Retail Channels: Continue to dominate, but online channels are experiencing rapid growth.
- Online Retail Channels: Present a significant opportunity for growth, driven by increasing internet penetration and consumer convenience.
Key Drivers of Segment Dominance: Economic policies influencing livestock production costs, infrastructure development related to cold chain logistics, and consumer preferences play a crucial role.
Meat Industry in South Africa: Product Developments
The South African meat industry is witnessing significant product innovation. New product formats, such as ready-to-eat meals and value-added products are gaining popularity. Technological advancements in processing and packaging enhance product quality, shelf life, and safety. The increasing demand for healthier and sustainable options is driving the development of products like organic, grass-fed, and free-range meats. These innovations aim to cater to the evolving preferences of South African consumers while enhancing the competitiveness of domestic producers.
Report Scope & Segmentation Analysis
This report segments the South African meat market by source (Poultry, Pork, Beef, Mutton), product type (Chilled, Frozen, Shelf Stable), and distribution channel (Online and Offline Retail Channels). Each segment is analyzed in detail, providing market size estimates, growth projections (2025-2033), and competitive dynamics. Market sizes for each segment are detailed within the full report, with a range of ZAR xx Million to ZAR xx Million in 2025, depending on the segment. Growth projections vary across segments, reflecting different market drivers and dynamics. Competitive dynamics within each segment are assessed based on the number of players, market share distribution, and intensity of competition.
Key Drivers of Meat Industry in South Africa Growth
Growth in the South African meat industry is driven by factors such as:
- Rising Disposable Incomes: Increased purchasing power fuels demand for meat products.
- Population Growth: A growing population expands the market size.
- Technological Advancements: Improved livestock farming techniques and processing technologies enhance efficiency and quality.
- Government Support: Policies aimed at supporting the agricultural sector contribute to industry growth.
Challenges in the Meat Industry in South Africa Sector
The South African meat industry faces challenges such as:
- Input Cost Volatility: Fluctuations in feed prices, energy costs, and labor costs impact profitability.
- Disease Outbreaks: Animal diseases can severely disrupt production and supply chains.
- Climate Change: Changing weather patterns affect livestock productivity and feed availability.
- Competition from Imports: Imports from other countries can exert competitive pressure on local producers.
Emerging Opportunities in Meat Industry in South Africa
Emerging opportunities include:
- Growth in Online Retail: Expanding e-commerce penetration presents growth prospects for online meat sales.
- Value-Added Products: Demand for ready-to-eat meals and convenience products creates market opportunities.
- Sustainable and Ethical Meat: Growing consumer awareness of sustainability and ethical sourcing fuels demand for eco-friendly meat products.
- Export Markets: Expanding exports to neighboring countries can broaden market reach.
Leading Players in the Meat Industry in South Africa Market
- Tiger Brands
- RCL Foods
- Rainbow Farms (Pty) Ltd
- New Style Pork (Pty) Ltd
- Astral Poultry Ltd
- BRF SA
- JBS SA
- Tyson Foods
- Eskort Co-operative
- Irvin & Johnson ltd
Key Developments in Meat Industry in South Africa Industry
- March 2022: BRF granted a license to export sausages to South Africa.
- April 2022: CULT Food Science Corp.'s Mogale Meat Co. created its first cultivated chicken breast product in Africa.
- May 2022: JBS subsidiary Seara gained approval to export chicken meat to South Africa, adding 28 export-ready units.
Strategic Outlook for Meat Industry in South Africa Market
The South African meat industry presents significant growth potential in the coming years. Continued expansion of the retail sector, growing consumer spending, and the increasing demand for value-added and sustainably produced meat will drive market expansion. Companies strategically focusing on innovation, efficiency, and adapting to consumer preferences will be best positioned to capitalize on the market opportunities. The industry's future outlook is optimistic despite the challenges, offering opportunities for growth and investment.
Meat Industry in South Africa Segmentation
-
1. Source
- 1.1. Poultry
- 1.2. Pork
- 1.3. Beef
- 1.4. Mutton
-
2. Product Type
- 2.1. Chilled
- 2.2. Frozen
- 2.3. Shelf Stable
-
3. Distribution
- 3.1. Online Retail Channels
- 3.2. Offline Retail Channels
Meat Industry in South Africa Segmentation By Geography
-
1. North America
- 1.1. United States
- 1.2. Canada
- 1.3. Mexico
-
2. South America
- 2.1. Brazil
- 2.2. Argentina
- 2.3. Rest of South America
-
3. Europe
- 3.1. United Kingdom
- 3.2. Germany
- 3.3. France
- 3.4. Italy
- 3.5. Spain
- 3.6. Russia
- 3.7. Benelux
- 3.8. Nordics
- 3.9. Rest of Europe
-
4. Middle East & Africa
- 4.1. Turkey
- 4.2. Israel
- 4.3. GCC
- 4.4. North Africa
- 4.5. South Africa
- 4.6. Rest of Middle East & Africa
-
5. Asia Pacific
- 5.1. China
- 5.2. India
- 5.3. Japan
- 5.4. South Korea
- 5.5. ASEAN
- 5.6. Oceania
- 5.7. Rest of Asia Pacific
Meat Industry in South Africa REPORT HIGHLIGHTS
| Aspects | Details |
|---|---|
| Study Period | 2019-2033 |
| Base Year | 2024 |
| Estimated Year | 2025 |
| Forecast Period | 2025-2033 |
| Historical Period | 2019-2024 |
| Growth Rate | CAGR of 6.88% from 2019-2033 |
| Segmentation |
|
Table of Contents
- 1. Introduction
- 1.1. Research Scope
- 1.2. Market Segmentation
- 1.3. Research Methodology
- 1.4. Definitions and Assumptions
- 2. Executive Summary
- 2.1. Introduction
- 3. Market Dynamics
- 3.1. Introduction
- 3.2. Market Drivers
- 3.2.1. Increasing Demand for Functional and Fortified Food; Multi-functionality and Wide Application of Riboflavin
- 3.3. Market Restrains
- 3.3.1. Low Stability of Riboflavin on Exposure to Light and Heat
- 3.4. Market Trends
- 3.4.1. Growth of Foodservice Restaurants Increased Meat Consumption
- 4. Market Factor Analysis
- 4.1. Porters Five Forces
- 4.2. Supply/Value Chain
- 4.3. PESTEL analysis
- 4.4. Market Entropy
- 4.5. Patent/Trademark Analysis
- 5. Global Meat Industry in South Africa Analysis, Insights and Forecast, 2019-2031
- 5.1. Market Analysis, Insights and Forecast - by Source
- 5.1.1. Poultry
- 5.1.2. Pork
- 5.1.3. Beef
- 5.1.4. Mutton
- 5.2. Market Analysis, Insights and Forecast - by Product Type
- 5.2.1. Chilled
- 5.2.2. Frozen
- 5.2.3. Shelf Stable
- 5.3. Market Analysis, Insights and Forecast - by Distribution
- 5.3.1. Online Retail Channels
- 5.3.2. Offline Retail Channels
- 5.4. Market Analysis, Insights and Forecast - by Region
- 5.4.1. North America
- 5.4.2. South America
- 5.4.3. Europe
- 5.4.4. Middle East & Africa
- 5.4.5. Asia Pacific
- 5.1. Market Analysis, Insights and Forecast - by Source
- 6. North America Meat Industry in South Africa Analysis, Insights and Forecast, 2019-2031
- 6.1. Market Analysis, Insights and Forecast - by Source
- 6.1.1. Poultry
- 6.1.2. Pork
- 6.1.3. Beef
- 6.1.4. Mutton
- 6.2. Market Analysis, Insights and Forecast - by Product Type
- 6.2.1. Chilled
- 6.2.2. Frozen
- 6.2.3. Shelf Stable
- 6.3. Market Analysis, Insights and Forecast - by Distribution
- 6.3.1. Online Retail Channels
- 6.3.2. Offline Retail Channels
- 6.1. Market Analysis, Insights and Forecast - by Source
- 7. South America Meat Industry in South Africa Analysis, Insights and Forecast, 2019-2031
- 7.1. Market Analysis, Insights and Forecast - by Source
- 7.1.1. Poultry
- 7.1.2. Pork
- 7.1.3. Beef
- 7.1.4. Mutton
- 7.2. Market Analysis, Insights and Forecast - by Product Type
- 7.2.1. Chilled
- 7.2.2. Frozen
- 7.2.3. Shelf Stable
- 7.3. Market Analysis, Insights and Forecast - by Distribution
- 7.3.1. Online Retail Channels
- 7.3.2. Offline Retail Channels
- 7.1. Market Analysis, Insights and Forecast - by Source
- 8. Europe Meat Industry in South Africa Analysis, Insights and Forecast, 2019-2031
- 8.1. Market Analysis, Insights and Forecast - by Source
- 8.1.1. Poultry
- 8.1.2. Pork
- 8.1.3. Beef
- 8.1.4. Mutton
- 8.2. Market Analysis, Insights and Forecast - by Product Type
- 8.2.1. Chilled
- 8.2.2. Frozen
- 8.2.3. Shelf Stable
- 8.3. Market Analysis, Insights and Forecast - by Distribution
- 8.3.1. Online Retail Channels
- 8.3.2. Offline Retail Channels
- 8.1. Market Analysis, Insights and Forecast - by Source
- 9. Middle East & Africa Meat Industry in South Africa Analysis, Insights and Forecast, 2019-2031
- 9.1. Market Analysis, Insights and Forecast - by Source
- 9.1.1. Poultry
- 9.1.2. Pork
- 9.1.3. Beef
- 9.1.4. Mutton
- 9.2. Market Analysis, Insights and Forecast - by Product Type
- 9.2.1. Chilled
- 9.2.2. Frozen
- 9.2.3. Shelf Stable
- 9.3. Market Analysis, Insights and Forecast - by Distribution
- 9.3.1. Online Retail Channels
- 9.3.2. Offline Retail Channels
- 9.1. Market Analysis, Insights and Forecast - by Source
- 10. Asia Pacific Meat Industry in South Africa Analysis, Insights and Forecast, 2019-2031
- 10.1. Market Analysis, Insights and Forecast - by Source
- 10.1.1. Poultry
- 10.1.2. Pork
- 10.1.3. Beef
- 10.1.4. Mutton
- 10.2. Market Analysis, Insights and Forecast - by Product Type
- 10.2.1. Chilled
- 10.2.2. Frozen
- 10.2.3. Shelf Stable
- 10.3. Market Analysis, Insights and Forecast - by Distribution
- 10.3.1. Online Retail Channels
- 10.3.2. Offline Retail Channels
- 10.1. Market Analysis, Insights and Forecast - by Source
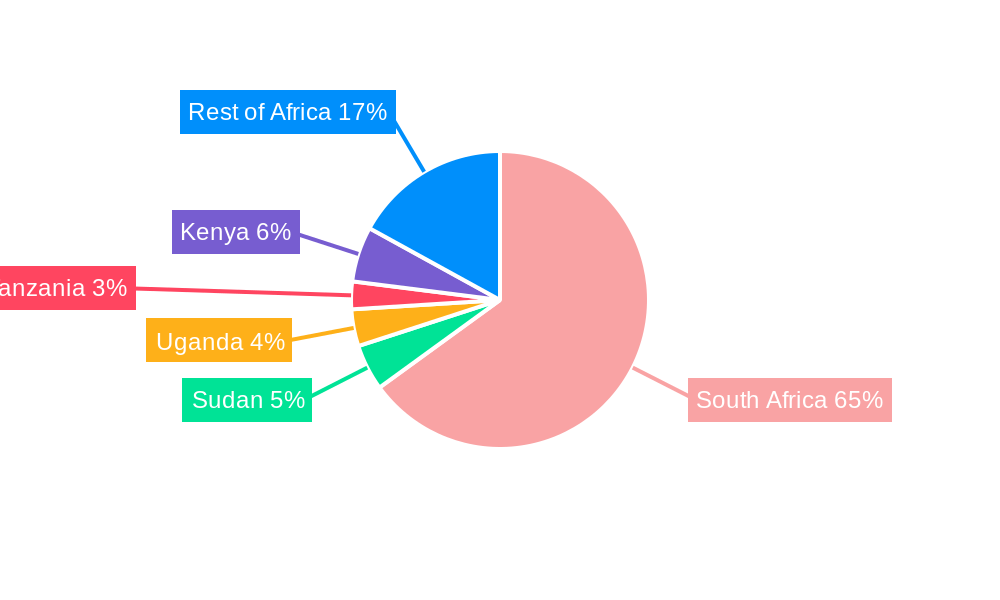
- 11. South Africa Meat Industry in South Africa Analysis, Insights and Forecast, 2019-2031
- 12. Sudan Meat Industry in South Africa Analysis, Insights and Forecast, 2019-2031
- 13. Uganda Meat Industry in South Africa Analysis, Insights and Forecast, 2019-2031
- 14. Tanzania Meat Industry in South Africa Analysis, Insights and Forecast, 2019-2031
- 15. Kenya Meat Industry in South Africa Analysis, Insights and Forecast, 2019-2031
- 16. Rest of Africa Meat Industry in South Africa Analysis, Insights and Forecast, 2019-2031
- 17. Competitive Analysis
- 17.1. Global Market Share Analysis 2024
- 17.2. Company Profiles
- 17.2.1 Tiger Brands
- 17.2.1.1. Overview
- 17.2.1.2. Products
- 17.2.1.3. SWOT Analysis
- 17.2.1.4. Recent Developments
- 17.2.1.5. Financials (Based on Availability)
- 17.2.2 RCL Foods
- 17.2.2.1. Overview
- 17.2.2.2. Products
- 17.2.2.3. SWOT Analysis
- 17.2.2.4. Recent Developments
- 17.2.2.5. Financials (Based on Availability)
- 17.2.3 Rainbow Farms (Pty) Ltd
- 17.2.3.1. Overview
- 17.2.3.2. Products
- 17.2.3.3. SWOT Analysis
- 17.2.3.4. Recent Developments
- 17.2.3.5. Financials (Based on Availability)
- 17.2.4 New Style Pork (Pty) Ltd *List Not Exhaustive
- 17.2.4.1. Overview
- 17.2.4.2. Products
- 17.2.4.3. SWOT Analysis
- 17.2.4.4. Recent Developments
- 17.2.4.5. Financials (Based on Availability)
- 17.2.5 Astral Poultry Ltd
- 17.2.5.1. Overview
- 17.2.5.2. Products
- 17.2.5.3. SWOT Analysis
- 17.2.5.4. Recent Developments
- 17.2.5.5. Financials (Based on Availability)
- 17.2.6 BRF SA
- 17.2.6.1. Overview
- 17.2.6.2. Products
- 17.2.6.3. SWOT Analysis
- 17.2.6.4. Recent Developments
- 17.2.6.5. Financials (Based on Availability)
- 17.2.7 JBS SA
- 17.2.7.1. Overview
- 17.2.7.2. Products
- 17.2.7.3. SWOT Analysis
- 17.2.7.4. Recent Developments
- 17.2.7.5. Financials (Based on Availability)
- 17.2.8 Tyson Foods
- 17.2.8.1. Overview
- 17.2.8.2. Products
- 17.2.8.3. SWOT Analysis
- 17.2.8.4. Recent Developments
- 17.2.8.5. Financials (Based on Availability)
- 17.2.9 Eskort Co-operative
- 17.2.9.1. Overview
- 17.2.9.2. Products
- 17.2.9.3. SWOT Analysis
- 17.2.9.4. Recent Developments
- 17.2.9.5. Financials (Based on Availability)
- 17.2.10 Irvin & Johnson ltd
- 17.2.10.1. Overview
- 17.2.10.2. Products
- 17.2.10.3. SWOT Analysis
- 17.2.10.4. Recent Developments
- 17.2.10.5. Financials (Based on Availability)
- 17.2.1 Tiger Brands
List of Figures
- Figure 1: Global Meat Industry in South Africa Revenue Breakdown (Million, %) by Region 2024 & 2032
- Figure 2: Africa Meat Industry in South Africa Revenue (Million), by Country 2024 & 2032
- Figure 3: Africa Meat Industry in South Africa Revenue Share (%), by Country 2024 & 2032
- Figure 4: North America Meat Industry in South Africa Revenue (Million), by Source 2024 & 2032
- Figure 5: North America Meat Industry in South Africa Revenue Share (%), by Source 2024 & 2032
- Figure 6: North America Meat Industry in South Africa Revenue (Million), by Product Type 2024 & 2032
- Figure 7: North America Meat Industry in South Africa Revenue Share (%), by Product Type 2024 & 2032
- Figure 8: North America Meat Industry in South Africa Revenue (Million), by Distribution 2024 & 2032
- Figure 9: North America Meat Industry in South Africa Revenue Share (%), by Distribution 2024 & 2032
- Figure 10: North America Meat Industry in South Africa Revenue (Million), by Country 2024 & 2032
- Figure 11: North America Meat Industry in South Africa Revenue Share (%), by Country 2024 & 2032
- Figure 12: South America Meat Industry in South Africa Revenue (Million), by Source 2024 & 2032
- Figure 13: South America Meat Industry in South Africa Revenue Share (%), by Source 2024 & 2032
- Figure 14: South America Meat Industry in South Africa Revenue (Million), by Product Type 2024 & 2032
- Figure 15: South America Meat Industry in South Africa Revenue Share (%), by Product Type 2024 & 2032
- Figure 16: South America Meat Industry in South Africa Revenue (Million), by Distribution 2024 & 2032
- Figure 17: South America Meat Industry in South Africa Revenue Share (%), by Distribution 2024 & 2032
- Figure 18: South America Meat Industry in South Africa Revenue (Million), by Country 2024 & 2032
- Figure 19: South America Meat Industry in South Africa Revenue Share (%), by Country 2024 & 2032
- Figure 20: Europe Meat Industry in South Africa Revenue (Million), by Source 2024 & 2032
- Figure 21: Europe Meat Industry in South Africa Revenue Share (%), by Source 2024 & 2032
- Figure 22: Europe Meat Industry in South Africa Revenue (Million), by Product Type 2024 & 2032
- Figure 23: Europe Meat Industry in South Africa Revenue Share (%), by Product Type 2024 & 2032
- Figure 24: Europe Meat Industry in South Africa Revenue (Million), by Distribution 2024 & 2032
- Figure 25: Europe Meat Industry in South Africa Revenue Share (%), by Distribution 2024 & 2032
- Figure 26: Europe Meat Industry in South Africa Revenue (Million), by Country 2024 & 2032
- Figure 27: Europe Meat Industry in South Africa Revenue Share (%), by Country 2024 & 2032
- Figure 28: Middle East & Africa Meat Industry in South Africa Revenue (Million), by Source 2024 & 2032
- Figure 29: Middle East & Africa Meat Industry in South Africa Revenue Share (%), by Source 2024 & 2032
- Figure 30: Middle East & Africa Meat Industry in South Africa Revenue (Million), by Product Type 2024 & 2032
- Figure 31: Middle East & Africa Meat Industry in South Africa Revenue Share (%), by Product Type 2024 & 2032
- Figure 32: Middle East & Africa Meat Industry in South Africa Revenue (Million), by Distribution 2024 & 2032
- Figure 33: Middle East & Africa Meat Industry in South Africa Revenue Share (%), by Distribution 2024 & 2032
- Figure 34: Middle East & Africa Meat Industry in South Africa Revenue (Million), by Country 2024 & 2032
- Figure 35: Middle East & Africa Meat Industry in South Africa Revenue Share (%), by Country 2024 & 2032
- Figure 36: Asia Pacific Meat Industry in South Africa Revenue (Million), by Source 2024 & 2032
- Figure 37: Asia Pacific Meat Industry in South Africa Revenue Share (%), by Source 2024 & 2032
- Figure 38: Asia Pacific Meat Industry in South Africa Revenue (Million), by Product Type 2024 & 2032
- Figure 39: Asia Pacific Meat Industry in South Africa Revenue Share (%), by Product Type 2024 & 2032
- Figure 40: Asia Pacific Meat Industry in South Africa Revenue (Million), by Distribution 2024 & 2032
- Figure 41: Asia Pacific Meat Industry in South Africa Revenue Share (%), by Distribution 2024 & 2032
- Figure 42: Asia Pacific Meat Industry in South Africa Revenue (Million), by Country 2024 & 2032
- Figure 43: Asia Pacific Meat Industry in South Africa Revenue Share (%), by Country 2024 & 2032
List of Tables
- Table 1: Global Meat Industry in South Africa Revenue Million Forecast, by Region 2019 & 2032
- Table 2: Global Meat Industry in South Africa Revenue Million Forecast, by Source 2019 & 2032
- Table 3: Global Meat Industry in South Africa Revenue Million Forecast, by Product Type 2019 & 2032
- Table 4: Global Meat Industry in South Africa Revenue Million Forecast, by Distribution 2019 & 2032
- Table 5: Global Meat Industry in South Africa Revenue Million Forecast, by Region 2019 & 2032
- Table 6: Global Meat Industry in South Africa Revenue Million Forecast, by Country 2019 & 2032
- Table 7: South Africa Meat Industry in South Africa Revenue (Million) Forecast, by Application 2019 & 2032
- Table 8: Sudan Meat Industry in South Africa Revenue (Million) Forecast, by Application 2019 & 2032
- Table 9: Uganda Meat Industry in South Africa Revenue (Million) Forecast, by Application 2019 & 2032
- Table 10: Tanzania Meat Industry in South Africa Revenue (Million) Forecast, by Application 2019 & 2032
- Table 11: Kenya Meat Industry in South Africa Revenue (Million) Forecast, by Application 2019 & 2032
- Table 12: Rest of Africa Meat Industry in South Africa Revenue (Million) Forecast, by Application 2019 & 2032
- Table 13: Global Meat Industry in South Africa Revenue Million Forecast, by Source 2019 & 2032
- Table 14: Global Meat Industry in South Africa Revenue Million Forecast, by Product Type 2019 & 2032
- Table 15: Global Meat Industry in South Africa Revenue Million Forecast, by Distribution 2019 & 2032
- Table 16: Global Meat Industry in South Africa Revenue Million Forecast, by Country 2019 & 2032
- Table 17: United States Meat Industry in South Africa Revenue (Million) Forecast, by Application 2019 & 2032
- Table 18: Canada Meat Industry in South Africa Revenue (Million) Forecast, by Application 2019 & 2032
- Table 19: Mexico Meat Industry in South Africa Revenue (Million) Forecast, by Application 2019 & 2032
- Table 20: Global Meat Industry in South Africa Revenue Million Forecast, by Source 2019 & 2032
- Table 21: Global Meat Industry in South Africa Revenue Million Forecast, by Product Type 2019 & 2032
- Table 22: Global Meat Industry in South Africa Revenue Million Forecast, by Distribution 2019 & 2032
- Table 23: Global Meat Industry in South Africa Revenue Million Forecast, by Country 2019 & 2032
- Table 24: Brazil Meat Industry in South Africa Revenue (Million) Forecast, by Application 2019 & 2032
- Table 25: Argentina Meat Industry in South Africa Revenue (Million) Forecast, by Application 2019 & 2032
- Table 26: Rest of South America Meat Industry in South Africa Revenue (Million) Forecast, by Application 2019 & 2032
- Table 27: Global Meat Industry in South Africa Revenue Million Forecast, by Source 2019 & 2032
- Table 28: Global Meat Industry in South Africa Revenue Million Forecast, by Product Type 2019 & 2032
- Table 29: Global Meat Industry in South Africa Revenue Million Forecast, by Distribution 2019 & 2032
- Table 30: Global Meat Industry in South Africa Revenue Million Forecast, by Country 2019 & 2032
- Table 31: United Kingdom Meat Industry in South Africa Revenue (Million) Forecast, by Application 2019 & 2032
- Table 32: Germany Meat Industry in South Africa Revenue (Million) Forecast, by Application 2019 & 2032
- Table 33: France Meat Industry in South Africa Revenue (Million) Forecast, by Application 2019 & 2032
- Table 34: Italy Meat Industry in South Africa Revenue (Million) Forecast, by Application 2019 & 2032
- Table 35: Spain Meat Industry in South Africa Revenue (Million) Forecast, by Application 2019 & 2032
- Table 36: Russia Meat Industry in South Africa Revenue (Million) Forecast, by Application 2019 & 2032
- Table 37: Benelux Meat Industry in South Africa Revenue (Million) Forecast, by Application 2019 & 2032
- Table 38: Nordics Meat Industry in South Africa Revenue (Million) Forecast, by Application 2019 & 2032
- Table 39: Rest of Europe Meat Industry in South Africa Revenue (Million) Forecast, by Application 2019 & 2032
- Table 40: Global Meat Industry in South Africa Revenue Million Forecast, by Source 2019 & 2032
- Table 41: Global Meat Industry in South Africa Revenue Million Forecast, by Product Type 2019 & 2032
- Table 42: Global Meat Industry in South Africa Revenue Million Forecast, by Distribution 2019 & 2032
- Table 43: Global Meat Industry in South Africa Revenue Million Forecast, by Country 2019 & 2032
- Table 44: Turkey Meat Industry in South Africa Revenue (Million) Forecast, by Application 2019 & 2032
- Table 45: Israel Meat Industry in South Africa Revenue (Million) Forecast, by Application 2019 & 2032
- Table 46: GCC Meat Industry in South Africa Revenue (Million) Forecast, by Application 2019 & 2032
- Table 47: North Africa Meat Industry in South Africa Revenue (Million) Forecast, by Application 2019 & 2032
- Table 48: South Africa Meat Industry in South Africa Revenue (Million) Forecast, by Application 2019 & 2032
- Table 49: Rest of Middle East & Africa Meat Industry in South Africa Revenue (Million) Forecast, by Application 2019 & 2032
- Table 50: Global Meat Industry in South Africa Revenue Million Forecast, by Source 2019 & 2032
- Table 51: Global Meat Industry in South Africa Revenue Million Forecast, by Product Type 2019 & 2032
- Table 52: Global Meat Industry in South Africa Revenue Million Forecast, by Distribution 2019 & 2032
- Table 53: Global Meat Industry in South Africa Revenue Million Forecast, by Country 2019 & 2032
- Table 54: China Meat Industry in South Africa Revenue (Million) Forecast, by Application 2019 & 2032
- Table 55: India Meat Industry in South Africa Revenue (Million) Forecast, by Application 2019 & 2032
- Table 56: Japan Meat Industry in South Africa Revenue (Million) Forecast, by Application 2019 & 2032
- Table 57: South Korea Meat Industry in South Africa Revenue (Million) Forecast, by Application 2019 & 2032
- Table 58: ASEAN Meat Industry in South Africa Revenue (Million) Forecast, by Application 2019 & 2032
- Table 59: Oceania Meat Industry in South Africa Revenue (Million) Forecast, by Application 2019 & 2032
- Table 60: Rest of Asia Pacific Meat Industry in South Africa Revenue (Million) Forecast, by Application 2019 & 2032
Frequently Asked Questions
1. What is the projected Compound Annual Growth Rate (CAGR) of the Meat Industry in South Africa?
The projected CAGR is approximately 6.88%.
2. Which companies are prominent players in the Meat Industry in South Africa?
Key companies in the market include Tiger Brands, RCL Foods, Rainbow Farms (Pty) Ltd, New Style Pork (Pty) Ltd *List Not Exhaustive, Astral Poultry Ltd, BRF SA, JBS SA, Tyson Foods, Eskort Co-operative, Irvin & Johnson ltd.
3. What are the main segments of the Meat Industry in South Africa?
The market segments include Source, Product Type, Distribution.
4. Can you provide details about the market size?
The market size is estimated to be USD 629.69 Million as of 2022.
5. What are some drivers contributing to market growth?
Increasing Demand for Functional and Fortified Food; Multi-functionality and Wide Application of Riboflavin.
6. What are the notable trends driving market growth?
Growth of Foodservice Restaurants Increased Meat Consumption.
7. Are there any restraints impacting market growth?
Low Stability of Riboflavin on Exposure to Light and Heat.
8. Can you provide examples of recent developments in the market?
May 2022: JBS announced that two plants of the subsidiary Seara were approved to export chicken meat to South Africa. With that, the company now has 28 units ready to export chickens and pigs to the African country.
9. What pricing options are available for accessing the report?
Pricing options include single-user, multi-user, and enterprise licenses priced at USD 3800, USD 4500, and USD 5800 respectively.
10. Is the market size provided in terms of value or volume?
The market size is provided in terms of value, measured in Million.
11. Are there any specific market keywords associated with the report?
Yes, the market keyword associated with the report is "Meat Industry in South Africa," which aids in identifying and referencing the specific market segment covered.
12. How do I determine which pricing option suits my needs best?
The pricing options vary based on user requirements and access needs. Individual users may opt for single-user licenses, while businesses requiring broader access may choose multi-user or enterprise licenses for cost-effective access to the report.
13. Are there any additional resources or data provided in the Meat Industry in South Africa report?
While the report offers comprehensive insights, it's advisable to review the specific contents or supplementary materials provided to ascertain if additional resources or data are available.
14. How can I stay updated on further developments or reports in the Meat Industry in South Africa?
To stay informed about further developments, trends, and reports in the Meat Industry in South Africa, consider subscribing to industry newsletters, following relevant companies and organizations, or regularly checking reputable industry news sources and publications.
Methodology
Step 1 - Identification of Relevant Samples Size from Population Database


Step 2 - Approaches for Defining Global Market Size (Value, Volume* & Price*)

Note*: In applicable scenarios
Step 3 - Data Sources
Primary Research
- Web Analytics
- Survey Reports
- Research Institute
- Latest Research Reports
- Opinion Leaders
Secondary Research
- Annual Reports
- White Paper
- Latest Press Release
- Industry Association
- Paid Database
- Investor Presentations

Step 4 - Data Triangulation
Involves using different sources of information in order to increase the validity of a study
These sources are likely to be stakeholders in a program - participants, other researchers, program staff, other community members, and so on.
Then we put all data in single framework & apply various statistical tools to find out the dynamic on the market.
During the analysis stage, feedback from the stakeholder groups would be compared to determine areas of agreement as well as areas of divergence


