
Key Insights
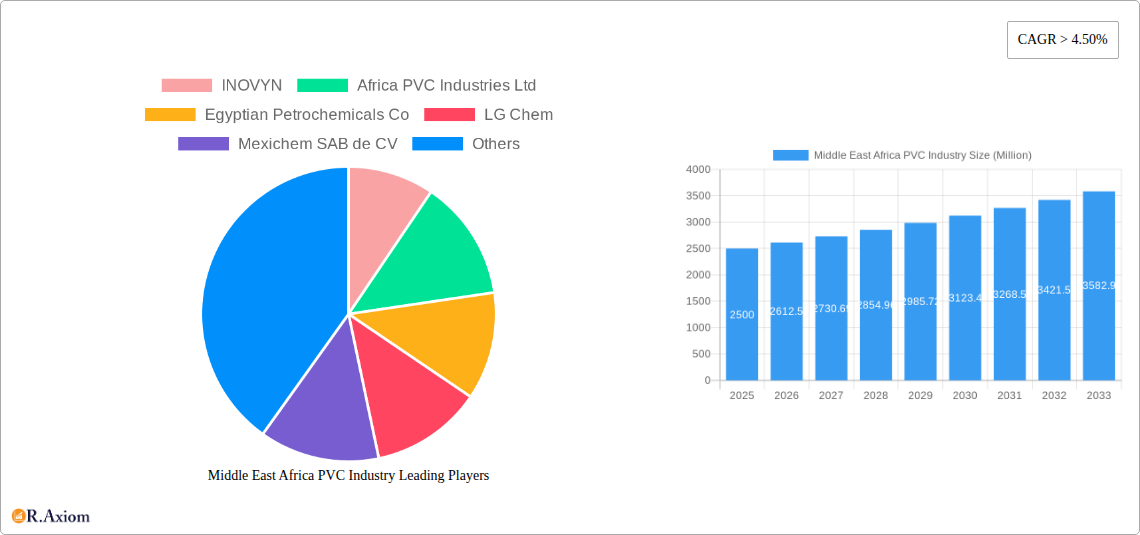
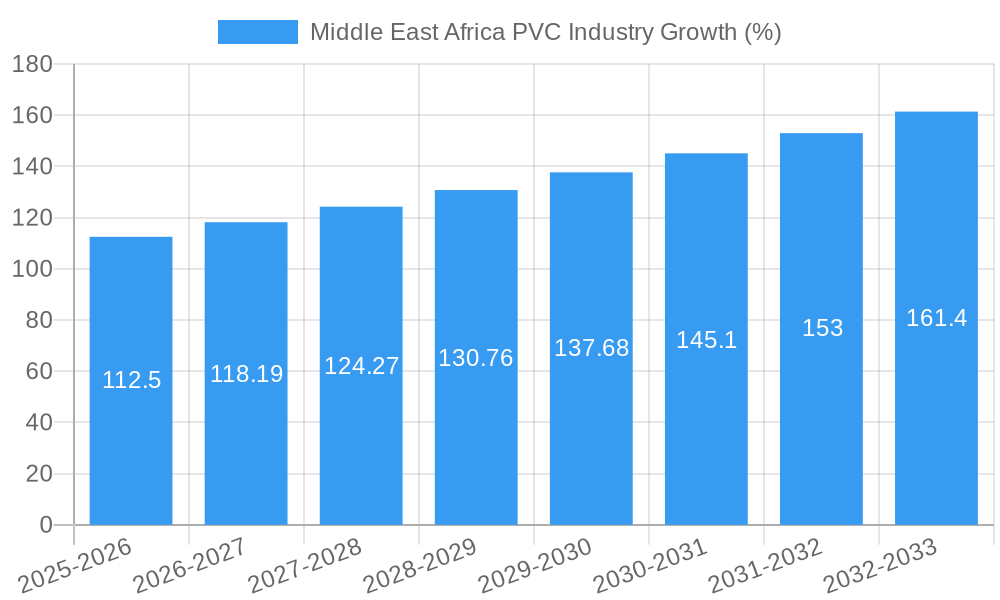
The Middle East and Africa PVC industry, exhibiting a Compound Annual Growth Rate (CAGR) exceeding 4.50%, presents a dynamic market landscape poised for significant expansion. Driven by robust infrastructure development, particularly in construction and housing across the region, demand for PVC pipes, profiles, and films remains consistently strong. The burgeoning population and rapid urbanization in many MEA nations further fuel this demand, creating opportunities for both established players and new entrants. Furthermore, the increasing adoption of sustainable PVC production methods and the growing awareness of PVC's versatility in various applications, from healthcare to packaging, are contributing positively to market growth. However, the industry faces challenges such as fluctuating raw material prices (primarily ethylene and chlorine), environmental concerns related to PVC production and disposal, and potential regulatory hurdles in certain countries.
Despite these restraints, the long-term outlook for the MEA PVC market remains optimistic. Strategic partnerships and collaborations between international PVC manufacturers and local distributors are likely to intensify, fostering market penetration and enabling the efficient delivery of PVC products to diverse customer segments. Innovation in PVC formulations and the development of more sustainable alternatives are expected to mitigate environmental concerns and enhance the market's long-term sustainability. Regional diversification of production facilities, coupled with investments in advanced technologies, will further enhance the resilience and competitive landscape of the MEA PVC industry over the forecast period (2025-2033). The market is segmented by product type (pipes, films, profiles, etc.), application (construction, packaging, healthcare, etc.), and geographic location (country-specific data would be beneficial for a more granular analysis). Leading companies like INOVYN, LG Chem, and SABIC are key players, actively shaping market dynamics through their production capacities, technological advancements, and market penetration strategies.
Middle East & Africa PVC Industry Market Report: 2019-2033
An In-depth Analysis of Market Trends, Growth Drivers, Competitive Landscape, and Future Outlook
This comprehensive report provides a detailed analysis of the Middle East and Africa PVC industry, covering the period from 2019 to 2033. It offers actionable insights for industry stakeholders, including manufacturers, investors, and policymakers. The report leverages extensive primary and secondary research to provide a robust understanding of market dynamics, competitive landscapes, and future growth potential. With a focus on key segments, leading players, and emerging trends, this report is an invaluable resource for navigating the complexities of this dynamic market. The base year for this report is 2025, with the estimated year also being 2025. The forecast period spans from 2025 to 2033, while the historical period examined is 2019-2024. The market size is presented in Millions (USD).
Middle East & Africa PVC Industry Market Concentration & Innovation
This section analyzes the market concentration, innovation drivers, regulatory frameworks, product substitutes, end-user trends, and mergers & acquisitions (M&A) activities within the Middle East and Africa PVC industry. The competitive landscape is characterized by a mix of large multinational corporations and regional players. Market share data for 2025 reveals that the top five players hold approximately xx% of the total market. Innovation is primarily driven by the need for more sustainable and cost-effective PVC production methods, as well as the development of new applications for PVC products across diverse end-use sectors. Recent M&A activities have been relatively limited, with a total deal value of approximately xx Million in the last 5 years.
- Market Concentration: Highly fragmented with a few dominant players.
- Innovation Drivers: Sustainability, cost reduction, new applications.
- Regulatory Framework: Varies across regions, impacting production and usage.
- Product Substitutes: Growing competition from alternative materials.
- End-User Trends: Increased demand from construction, packaging, and healthcare sectors.
- M&A Activity: Relatively low, with a focus on strategic acquisitions.
Middle East & Africa PVC Industry Industry Trends & Insights
The Middle East and Africa PVC market experienced a Compound Annual Growth Rate (CAGR) of xx% during 2019-2024 and is projected to maintain a CAGR of xx% from 2025 to 2033. Market growth is primarily driven by increasing infrastructure development, particularly in construction and housing. Technological advancements, such as the development of more sustainable PVC formulations, are contributing to increased market penetration. Consumer preferences are shifting towards eco-friendly products, putting pressure on manufacturers to adopt sustainable practices. Competitive dynamics are intense, with companies focusing on differentiation through product innovation, cost optimization, and expanding market reach. Market penetration in key segments continues to increase, driven by favorable economic conditions and growing urbanization in several regions.
Dominant Markets & Segments in Middle East & Africa PVC Industry
The construction sector is the dominant end-use segment in the Middle East and Africa PVC industry, accounting for approximately xx% of total consumption in 2025. Within the region, xx is currently the leading country in terms of PVC consumption, driven by its robust construction industry and economic growth.
- Key Drivers in xx:
- Rapid urbanization and infrastructure development.
- Government initiatives promoting construction activities.
- Stable economic growth.
Other significant markets include [mention other significant countries, and provide a similar breakdown for each]. A detailed analysis of each region's market size, growth drivers, and challenges is provided within the full report.
Middle East & Africa PVC Industry Product Developments
Recent product innovations focus on developing more sustainable and environmentally friendly PVC formulations, including the incorporation of recycled materials and the reduction of plasticizer content. These developments aim to address environmental concerns and comply with increasingly stringent regulations. New applications for PVC are emerging in diverse sectors like healthcare, packaging, and automotive, driving market growth and broadening the product portfolio. The competitive advantage lies in offering high-quality, cost-effective, and sustainable PVC products that meet the evolving needs of diverse end-use sectors.
Report Scope & Segmentation Analysis
The report segments the Middle East and Africa PVC market based on several factors, including:
- By Product Type: This includes rigid PVC, flexible PVC, and others. The rigid PVC segment is expected to dominate due to its widespread application in construction.
- By Application: Key applications include construction, packaging, healthcare, and others. The construction sector accounts for the majority of PVC demand.
- By Region: The report covers major countries in the Middle East and Africa.
Each segment’s growth projections, market size, and competitive dynamics are analyzed in detail within the report, offering granular insights into specific market opportunities.
Key Drivers of Middle East & Africa PVC Industry Growth
The growth of the Middle East and Africa PVC industry is primarily driven by several factors:
- Rapid Urbanization: The increasing population and urbanization across the region are boosting the demand for housing and infrastructure development.
- Infrastructure Development: Significant investments in infrastructure projects are driving the demand for PVC pipes, profiles, and other construction materials.
- Favorable Economic Conditions: Stable economic growth in several countries across the region contributes to increased consumer spending and industrial activity.
- Government Policies: Supportive government policies aimed at promoting infrastructure development and industrial growth contribute to industry growth.
Challenges in the Middle East & Africa PVC Industry Sector
Several challenges hinder the growth of the Middle East and Africa PVC industry, including:
- Fluctuating Raw Material Prices: Volatility in the prices of raw materials, such as ethylene and chlorine, impacts profitability.
- Environmental Regulations: Stringent environmental regulations necessitate investment in sustainable production technologies.
- Competition from Substitutes: Increasing competition from alternative materials necessitates innovation and cost optimization.
Emerging Opportunities in Middle East & Africa PVC Industry
Emerging opportunities exist in the Middle East and Africa PVC industry, such as:
- Sustainable PVC: Growing demand for sustainable and eco-friendly PVC products presents significant opportunities.
- New Applications: Expansion into new application areas, such as healthcare and automotive, offers growth potential.
- Technological Advancements: Adoption of advanced technologies for improving efficiency and sustainability can enhance competitiveness.
Leading Players in the Middle East & Africa PVC Industry Market
- INOVYN
- Africa PVC Industries Ltd
- Egyptian Petrochemicals Co
- LG Chem
- Mexichem SAB de CV
- Neproplast
- Occidental Petroleum Corporation
- SABIC
- SASOL
- Westlake Chemical Corporation *List Not Exhaustive
Key Developments in Middle East & Africa PVC Industry Industry
There is no recent development available.
Strategic Outlook for Middle East & Africa PVC Industry Market
The Middle East and Africa PVC industry is poised for significant growth in the coming years, driven by sustained infrastructure development, increasing urbanization, and favorable economic conditions. Opportunities exist in developing sustainable products, expanding into new applications, and adopting advanced technologies. Companies that focus on innovation, sustainability, and cost optimization are well-positioned to capture market share and achieve sustainable growth. The market is expected to witness further consolidation through mergers and acquisitions as companies seek to expand their market presence and enhance their competitive advantage.
Middle East Africa PVC Industry Segmentation
-
1. Product Type
-
1.1. Rigid PVC
- 1.1.1. Clear Rigid PVC
- 1.1.2. Non-clear Rigid PVC
-
1.2. Flexible PVC
- 1.2.1. Clear Flexible PVC
- 1.2.2. Non-clear Flexible PVC
- 1.3. Low-smoke PVC
- 1.4. Chlorinated PVC
-
1.1. Rigid PVC
-
2. Application
- 2.1. Pipes and Fittings
- 2.2. Film and Sheets
- 2.3. Wire and Cables
- 2.4. Bottles
- 2.5. Profiles, Hoses, and Tubings
- 2.6. Other Applications (Toys, Fabrics)
-
3. End-user Industry
- 3.1. Building and Construction
- 3.2. Automotive
- 3.3. Electrical and Electronics
- 3.4. Packaging
- 3.5. Footwear
- 3.6. Healthcare
- 3.7. Other End-user Industries (Textile, Agriculture)
-
4. Geography
- 4.1. Saudi Arabia
- 4.2. South Africa
- 4.3. Qatar
- 4.4. Egypt
- 4.5. United Arab Emirates
- 4.6. Rest of Middle East & Africa
Middle East Africa PVC Industry Segmentation By Geography
- 1. Saudi Arabia
- 2. South Africa
- 3. Qatar
- 4. Egypt
- 5. United Arab Emirates
- 6. Rest of Middle East

Middle East Africa PVC Industry REPORT HIGHLIGHTS
| Aspects | Details |
|---|---|
| Study Period | 2019-2033 |
| Base Year | 2024 |
| Estimated Year | 2025 |
| Forecast Period | 2025-2033 |
| Historical Period | 2019-2024 |
| Growth Rate | CAGR of > 4.50% from 2019-2033 |
| Segmentation |
|
Table of Contents
- 1. Introduction
- 1.1. Research Scope
- 1.2. Market Segmentation
- 1.3. Research Methodology
- 1.4. Definitions and Assumptions
- 2. Executive Summary
- 2.1. Introduction
- 3. Market Dynamics
- 3.1. Introduction
- 3.2. Market Drivers
- 3.2.1. Growing Demand from the Construction Industry; Other Drivers
- 3.3. Market Restrains
- 3.3.1. Growing Demand from the Construction Industry; Other Drivers
- 3.4. Market Trends
- 3.4.1. Growing Demand from the Construction Industry
- 4. Market Factor Analysis
- 4.1. Porters Five Forces
- 4.2. Supply/Value Chain
- 4.3. PESTEL analysis
- 4.4. Market Entropy
- 4.5. Patent/Trademark Analysis
- 5. Global Middle East Africa PVC Industry Analysis, Insights and Forecast, 2019-2031
- 5.1. Market Analysis, Insights and Forecast - by Product Type
- 5.1.1. Rigid PVC
- 5.1.1.1. Clear Rigid PVC
- 5.1.1.2. Non-clear Rigid PVC
- 5.1.2. Flexible PVC
- 5.1.2.1. Clear Flexible PVC
- 5.1.2.2. Non-clear Flexible PVC
- 5.1.3. Low-smoke PVC
- 5.1.4. Chlorinated PVC
- 5.1.1. Rigid PVC
- 5.2. Market Analysis, Insights and Forecast - by Application
- 5.2.1. Pipes and Fittings
- 5.2.2. Film and Sheets
- 5.2.3. Wire and Cables
- 5.2.4. Bottles
- 5.2.5. Profiles, Hoses, and Tubings
- 5.2.6. Other Applications (Toys, Fabrics)
- 5.3. Market Analysis, Insights and Forecast - by End-user Industry
- 5.3.1. Building and Construction
- 5.3.2. Automotive
- 5.3.3. Electrical and Electronics
- 5.3.4. Packaging
- 5.3.5. Footwear
- 5.3.6. Healthcare
- 5.3.7. Other End-user Industries (Textile, Agriculture)
- 5.4. Market Analysis, Insights and Forecast - by Geography
- 5.4.1. Saudi Arabia
- 5.4.2. South Africa
- 5.4.3. Qatar
- 5.4.4. Egypt
- 5.4.5. United Arab Emirates
- 5.4.6. Rest of Middle East & Africa
- 5.5. Market Analysis, Insights and Forecast - by Region
- 5.5.1. Saudi Arabia
- 5.5.2. South Africa
- 5.5.3. Qatar
- 5.5.4. Egypt
- 5.5.5. United Arab Emirates
- 5.5.6. Rest of Middle East
- 5.1. Market Analysis, Insights and Forecast - by Product Type
- 6. Saudi Arabia Middle East Africa PVC Industry Analysis, Insights and Forecast, 2019-2031
- 6.1. Market Analysis, Insights and Forecast - by Product Type
- 6.1.1. Rigid PVC
- 6.1.1.1. Clear Rigid PVC
- 6.1.1.2. Non-clear Rigid PVC
- 6.1.2. Flexible PVC
- 6.1.2.1. Clear Flexible PVC
- 6.1.2.2. Non-clear Flexible PVC
- 6.1.3. Low-smoke PVC
- 6.1.4. Chlorinated PVC
- 6.1.1. Rigid PVC
- 6.2. Market Analysis, Insights and Forecast - by Application
- 6.2.1. Pipes and Fittings
- 6.2.2. Film and Sheets
- 6.2.3. Wire and Cables
- 6.2.4. Bottles
- 6.2.5. Profiles, Hoses, and Tubings
- 6.2.6. Other Applications (Toys, Fabrics)
- 6.3. Market Analysis, Insights and Forecast - by End-user Industry
- 6.3.1. Building and Construction
- 6.3.2. Automotive
- 6.3.3. Electrical and Electronics
- 6.3.4. Packaging
- 6.3.5. Footwear
- 6.3.6. Healthcare
- 6.3.7. Other End-user Industries (Textile, Agriculture)
- 6.4. Market Analysis, Insights and Forecast - by Geography
- 6.4.1. Saudi Arabia
- 6.4.2. South Africa
- 6.4.3. Qatar
- 6.4.4. Egypt
- 6.4.5. United Arab Emirates
- 6.4.6. Rest of Middle East & Africa
- 6.1. Market Analysis, Insights and Forecast - by Product Type
- 7. South Africa Middle East Africa PVC Industry Analysis, Insights and Forecast, 2019-2031
- 7.1. Market Analysis, Insights and Forecast - by Product Type
- 7.1.1. Rigid PVC
- 7.1.1.1. Clear Rigid PVC
- 7.1.1.2. Non-clear Rigid PVC
- 7.1.2. Flexible PVC
- 7.1.2.1. Clear Flexible PVC
- 7.1.2.2. Non-clear Flexible PVC
- 7.1.3. Low-smoke PVC
- 7.1.4. Chlorinated PVC
- 7.1.1. Rigid PVC
- 7.2. Market Analysis, Insights and Forecast - by Application
- 7.2.1. Pipes and Fittings
- 7.2.2. Film and Sheets
- 7.2.3. Wire and Cables
- 7.2.4. Bottles
- 7.2.5. Profiles, Hoses, and Tubings
- 7.2.6. Other Applications (Toys, Fabrics)
- 7.3. Market Analysis, Insights and Forecast - by End-user Industry
- 7.3.1. Building and Construction
- 7.3.2. Automotive
- 7.3.3. Electrical and Electronics
- 7.3.4. Packaging
- 7.3.5. Footwear
- 7.3.6. Healthcare
- 7.3.7. Other End-user Industries (Textile, Agriculture)
- 7.4. Market Analysis, Insights and Forecast - by Geography
- 7.4.1. Saudi Arabia
- 7.4.2. South Africa
- 7.4.3. Qatar
- 7.4.4. Egypt
- 7.4.5. United Arab Emirates
- 7.4.6. Rest of Middle East & Africa
- 7.1. Market Analysis, Insights and Forecast - by Product Type
- 8. Qatar Middle East Africa PVC Industry Analysis, Insights and Forecast, 2019-2031
- 8.1. Market Analysis, Insights and Forecast - by Product Type
- 8.1.1. Rigid PVC
- 8.1.1.1. Clear Rigid PVC
- 8.1.1.2. Non-clear Rigid PVC
- 8.1.2. Flexible PVC
- 8.1.2.1. Clear Flexible PVC
- 8.1.2.2. Non-clear Flexible PVC
- 8.1.3. Low-smoke PVC
- 8.1.4. Chlorinated PVC
- 8.1.1. Rigid PVC
- 8.2. Market Analysis, Insights and Forecast - by Application
- 8.2.1. Pipes and Fittings
- 8.2.2. Film and Sheets
- 8.2.3. Wire and Cables
- 8.2.4. Bottles
- 8.2.5. Profiles, Hoses, and Tubings
- 8.2.6. Other Applications (Toys, Fabrics)
- 8.3. Market Analysis, Insights and Forecast - by End-user Industry
- 8.3.1. Building and Construction
- 8.3.2. Automotive
- 8.3.3. Electrical and Electronics
- 8.3.4. Packaging
- 8.3.5. Footwear
- 8.3.6. Healthcare
- 8.3.7. Other End-user Industries (Textile, Agriculture)
- 8.4. Market Analysis, Insights and Forecast - by Geography
- 8.4.1. Saudi Arabia
- 8.4.2. South Africa
- 8.4.3. Qatar
- 8.4.4. Egypt
- 8.4.5. United Arab Emirates
- 8.4.6. Rest of Middle East & Africa
- 8.1. Market Analysis, Insights and Forecast - by Product Type
- 9. Egypt Middle East Africa PVC Industry Analysis, Insights and Forecast, 2019-2031
- 9.1. Market Analysis, Insights and Forecast - by Product Type
- 9.1.1. Rigid PVC
- 9.1.1.1. Clear Rigid PVC
- 9.1.1.2. Non-clear Rigid PVC
- 9.1.2. Flexible PVC
- 9.1.2.1. Clear Flexible PVC
- 9.1.2.2. Non-clear Flexible PVC
- 9.1.3. Low-smoke PVC
- 9.1.4. Chlorinated PVC
- 9.1.1. Rigid PVC
- 9.2. Market Analysis, Insights and Forecast - by Application
- 9.2.1. Pipes and Fittings
- 9.2.2. Film and Sheets
- 9.2.3. Wire and Cables
- 9.2.4. Bottles
- 9.2.5. Profiles, Hoses, and Tubings
- 9.2.6. Other Applications (Toys, Fabrics)
- 9.3. Market Analysis, Insights and Forecast - by End-user Industry
- 9.3.1. Building and Construction
- 9.3.2. Automotive
- 9.3.3. Electrical and Electronics
- 9.3.4. Packaging
- 9.3.5. Footwear
- 9.3.6. Healthcare
- 9.3.7. Other End-user Industries (Textile, Agriculture)
- 9.4. Market Analysis, Insights and Forecast - by Geography
- 9.4.1. Saudi Arabia
- 9.4.2. South Africa
- 9.4.3. Qatar
- 9.4.4. Egypt
- 9.4.5. United Arab Emirates
- 9.4.6. Rest of Middle East & Africa
- 9.1. Market Analysis, Insights and Forecast - by Product Type
- 10. United Arab Emirates Middle East Africa PVC Industry Analysis, Insights and Forecast, 2019-2031
- 10.1. Market Analysis, Insights and Forecast - by Product Type
- 10.1.1. Rigid PVC
- 10.1.1.1. Clear Rigid PVC
- 10.1.1.2. Non-clear Rigid PVC
- 10.1.2. Flexible PVC
- 10.1.2.1. Clear Flexible PVC
- 10.1.2.2. Non-clear Flexible PVC
- 10.1.3. Low-smoke PVC
- 10.1.4. Chlorinated PVC
- 10.1.1. Rigid PVC
- 10.2. Market Analysis, Insights and Forecast - by Application
- 10.2.1. Pipes and Fittings
- 10.2.2. Film and Sheets
- 10.2.3. Wire and Cables
- 10.2.4. Bottles
- 10.2.5. Profiles, Hoses, and Tubings
- 10.2.6. Other Applications (Toys, Fabrics)
- 10.3. Market Analysis, Insights and Forecast - by End-user Industry
- 10.3.1. Building and Construction
- 10.3.2. Automotive
- 10.3.3. Electrical and Electronics
- 10.3.4. Packaging
- 10.3.5. Footwear
- 10.3.6. Healthcare
- 10.3.7. Other End-user Industries (Textile, Agriculture)
- 10.4. Market Analysis, Insights and Forecast - by Geography
- 10.4.1. Saudi Arabia
- 10.4.2. South Africa
- 10.4.3. Qatar
- 10.4.4. Egypt
- 10.4.5. United Arab Emirates
- 10.4.6. Rest of Middle East & Africa
- 10.1. Market Analysis, Insights and Forecast - by Product Type
- 11. Rest of Middle East Middle East Africa PVC Industry Analysis, Insights and Forecast, 2019-2031
- 11.1. Market Analysis, Insights and Forecast - by Product Type
- 11.1.1. Rigid PVC
- 11.1.1.1. Clear Rigid PVC
- 11.1.1.2. Non-clear Rigid PVC
- 11.1.2. Flexible PVC
- 11.1.2.1. Clear Flexible PVC
- 11.1.2.2. Non-clear Flexible PVC
- 11.1.3. Low-smoke PVC
- 11.1.4. Chlorinated PVC
- 11.1.1. Rigid PVC
- 11.2. Market Analysis, Insights and Forecast - by Application
- 11.2.1. Pipes and Fittings
- 11.2.2. Film and Sheets
- 11.2.3. Wire and Cables
- 11.2.4. Bottles
- 11.2.5. Profiles, Hoses, and Tubings
- 11.2.6. Other Applications (Toys, Fabrics)
- 11.3. Market Analysis, Insights and Forecast - by End-user Industry
- 11.3.1. Building and Construction
- 11.3.2. Automotive
- 11.3.3. Electrical and Electronics
- 11.3.4. Packaging
- 11.3.5. Footwear
- 11.3.6. Healthcare
- 11.3.7. Other End-user Industries (Textile, Agriculture)
- 11.4. Market Analysis, Insights and Forecast - by Geography
- 11.4.1. Saudi Arabia
- 11.4.2. South Africa
- 11.4.3. Qatar
- 11.4.4. Egypt
- 11.4.5. United Arab Emirates
- 11.4.6. Rest of Middle East & Africa
- 11.1. Market Analysis, Insights and Forecast - by Product Type
- 12. Competitive Analysis
- 12.1. Global Market Share Analysis 2024
- 12.2. Company Profiles
- 12.2.1 INOVYN
- 12.2.1.1. Overview
- 12.2.1.2. Products
- 12.2.1.3. SWOT Analysis
- 12.2.1.4. Recent Developments
- 12.2.1.5. Financials (Based on Availability)
- 12.2.2 Africa PVC Industries Ltd
- 12.2.2.1. Overview
- 12.2.2.2. Products
- 12.2.2.3. SWOT Analysis
- 12.2.2.4. Recent Developments
- 12.2.2.5. Financials (Based on Availability)
- 12.2.3 Egyptian Petrochemicals Co
- 12.2.3.1. Overview
- 12.2.3.2. Products
- 12.2.3.3. SWOT Analysis
- 12.2.3.4. Recent Developments
- 12.2.3.5. Financials (Based on Availability)
- 12.2.4 LG Chem
- 12.2.4.1. Overview
- 12.2.4.2. Products
- 12.2.4.3. SWOT Analysis
- 12.2.4.4. Recent Developments
- 12.2.4.5. Financials (Based on Availability)
- 12.2.5 Mexichem SAB de CV
- 12.2.5.1. Overview
- 12.2.5.2. Products
- 12.2.5.3. SWOT Analysis
- 12.2.5.4. Recent Developments
- 12.2.5.5. Financials (Based on Availability)
- 12.2.6 Neproplast
- 12.2.6.1. Overview
- 12.2.6.2. Products
- 12.2.6.3. SWOT Analysis
- 12.2.6.4. Recent Developments
- 12.2.6.5. Financials (Based on Availability)
- 12.2.7 Occidental Petroleum Corporation
- 12.2.7.1. Overview
- 12.2.7.2. Products
- 12.2.7.3. SWOT Analysis
- 12.2.7.4. Recent Developments
- 12.2.7.5. Financials (Based on Availability)
- 12.2.8 SABIC
- 12.2.8.1. Overview
- 12.2.8.2. Products
- 12.2.8.3. SWOT Analysis
- 12.2.8.4. Recent Developments
- 12.2.8.5. Financials (Based on Availability)
- 12.2.9 SASOL
- 12.2.9.1. Overview
- 12.2.9.2. Products
- 12.2.9.3. SWOT Analysis
- 12.2.9.4. Recent Developments
- 12.2.9.5. Financials (Based on Availability)
- 12.2.10 Westlake Chemical Corporation*List Not Exhaustive
- 12.2.10.1. Overview
- 12.2.10.2. Products
- 12.2.10.3. SWOT Analysis
- 12.2.10.4. Recent Developments
- 12.2.10.5. Financials (Based on Availability)
- 12.2.1 INOVYN
List of Figures
- Figure 1: Global Middle East Africa PVC Industry Revenue Breakdown (Million, %) by Region 2024 & 2032
- Figure 2: Saudi Arabia Middle East Africa PVC Industry Revenue (Million), by Product Type 2024 & 2032
- Figure 3: Saudi Arabia Middle East Africa PVC Industry Revenue Share (%), by Product Type 2024 & 2032
- Figure 4: Saudi Arabia Middle East Africa PVC Industry Revenue (Million), by Application 2024 & 2032
- Figure 5: Saudi Arabia Middle East Africa PVC Industry Revenue Share (%), by Application 2024 & 2032
- Figure 6: Saudi Arabia Middle East Africa PVC Industry Revenue (Million), by End-user Industry 2024 & 2032
- Figure 7: Saudi Arabia Middle East Africa PVC Industry Revenue Share (%), by End-user Industry 2024 & 2032
- Figure 8: Saudi Arabia Middle East Africa PVC Industry Revenue (Million), by Geography 2024 & 2032
- Figure 9: Saudi Arabia Middle East Africa PVC Industry Revenue Share (%), by Geography 2024 & 2032
- Figure 10: Saudi Arabia Middle East Africa PVC Industry Revenue (Million), by Country 2024 & 2032
- Figure 11: Saudi Arabia Middle East Africa PVC Industry Revenue Share (%), by Country 2024 & 2032
- Figure 12: South Africa Middle East Africa PVC Industry Revenue (Million), by Product Type 2024 & 2032
- Figure 13: South Africa Middle East Africa PVC Industry Revenue Share (%), by Product Type 2024 & 2032
- Figure 14: South Africa Middle East Africa PVC Industry Revenue (Million), by Application 2024 & 2032
- Figure 15: South Africa Middle East Africa PVC Industry Revenue Share (%), by Application 2024 & 2032
- Figure 16: South Africa Middle East Africa PVC Industry Revenue (Million), by End-user Industry 2024 & 2032
- Figure 17: South Africa Middle East Africa PVC Industry Revenue Share (%), by End-user Industry 2024 & 2032
- Figure 18: South Africa Middle East Africa PVC Industry Revenue (Million), by Geography 2024 & 2032
- Figure 19: South Africa Middle East Africa PVC Industry Revenue Share (%), by Geography 2024 & 2032
- Figure 20: South Africa Middle East Africa PVC Industry Revenue (Million), by Country 2024 & 2032
- Figure 21: South Africa Middle East Africa PVC Industry Revenue Share (%), by Country 2024 & 2032
- Figure 22: Qatar Middle East Africa PVC Industry Revenue (Million), by Product Type 2024 & 2032
- Figure 23: Qatar Middle East Africa PVC Industry Revenue Share (%), by Product Type 2024 & 2032
- Figure 24: Qatar Middle East Africa PVC Industry Revenue (Million), by Application 2024 & 2032
- Figure 25: Qatar Middle East Africa PVC Industry Revenue Share (%), by Application 2024 & 2032
- Figure 26: Qatar Middle East Africa PVC Industry Revenue (Million), by End-user Industry 2024 & 2032
- Figure 27: Qatar Middle East Africa PVC Industry Revenue Share (%), by End-user Industry 2024 & 2032
- Figure 28: Qatar Middle East Africa PVC Industry Revenue (Million), by Geography 2024 & 2032
- Figure 29: Qatar Middle East Africa PVC Industry Revenue Share (%), by Geography 2024 & 2032
- Figure 30: Qatar Middle East Africa PVC Industry Revenue (Million), by Country 2024 & 2032
- Figure 31: Qatar Middle East Africa PVC Industry Revenue Share (%), by Country 2024 & 2032
- Figure 32: Egypt Middle East Africa PVC Industry Revenue (Million), by Product Type 2024 & 2032
- Figure 33: Egypt Middle East Africa PVC Industry Revenue Share (%), by Product Type 2024 & 2032
- Figure 34: Egypt Middle East Africa PVC Industry Revenue (Million), by Application 2024 & 2032
- Figure 35: Egypt Middle East Africa PVC Industry Revenue Share (%), by Application 2024 & 2032
- Figure 36: Egypt Middle East Africa PVC Industry Revenue (Million), by End-user Industry 2024 & 2032
- Figure 37: Egypt Middle East Africa PVC Industry Revenue Share (%), by End-user Industry 2024 & 2032
- Figure 38: Egypt Middle East Africa PVC Industry Revenue (Million), by Geography 2024 & 2032
- Figure 39: Egypt Middle East Africa PVC Industry Revenue Share (%), by Geography 2024 & 2032
- Figure 40: Egypt Middle East Africa PVC Industry Revenue (Million), by Country 2024 & 2032
- Figure 41: Egypt Middle East Africa PVC Industry Revenue Share (%), by Country 2024 & 2032
- Figure 42: United Arab Emirates Middle East Africa PVC Industry Revenue (Million), by Product Type 2024 & 2032
- Figure 43: United Arab Emirates Middle East Africa PVC Industry Revenue Share (%), by Product Type 2024 & 2032
- Figure 44: United Arab Emirates Middle East Africa PVC Industry Revenue (Million), by Application 2024 & 2032
- Figure 45: United Arab Emirates Middle East Africa PVC Industry Revenue Share (%), by Application 2024 & 2032
- Figure 46: United Arab Emirates Middle East Africa PVC Industry Revenue (Million), by End-user Industry 2024 & 2032
- Figure 47: United Arab Emirates Middle East Africa PVC Industry Revenue Share (%), by End-user Industry 2024 & 2032
- Figure 48: United Arab Emirates Middle East Africa PVC Industry Revenue (Million), by Geography 2024 & 2032
- Figure 49: United Arab Emirates Middle East Africa PVC Industry Revenue Share (%), by Geography 2024 & 2032
- Figure 50: United Arab Emirates Middle East Africa PVC Industry Revenue (Million), by Country 2024 & 2032
- Figure 51: United Arab Emirates Middle East Africa PVC Industry Revenue Share (%), by Country 2024 & 2032
- Figure 52: Rest of Middle East Middle East Africa PVC Industry Revenue (Million), by Product Type 2024 & 2032
- Figure 53: Rest of Middle East Middle East Africa PVC Industry Revenue Share (%), by Product Type 2024 & 2032
- Figure 54: Rest of Middle East Middle East Africa PVC Industry Revenue (Million), by Application 2024 & 2032
- Figure 55: Rest of Middle East Middle East Africa PVC Industry Revenue Share (%), by Application 2024 & 2032
- Figure 56: Rest of Middle East Middle East Africa PVC Industry Revenue (Million), by End-user Industry 2024 & 2032
- Figure 57: Rest of Middle East Middle East Africa PVC Industry Revenue Share (%), by End-user Industry 2024 & 2032
- Figure 58: Rest of Middle East Middle East Africa PVC Industry Revenue (Million), by Geography 2024 & 2032
- Figure 59: Rest of Middle East Middle East Africa PVC Industry Revenue Share (%), by Geography 2024 & 2032
- Figure 60: Rest of Middle East Middle East Africa PVC Industry Revenue (Million), by Country 2024 & 2032
- Figure 61: Rest of Middle East Middle East Africa PVC Industry Revenue Share (%), by Country 2024 & 2032
List of Tables
- Table 1: Global Middle East Africa PVC Industry Revenue Million Forecast, by Region 2019 & 2032
- Table 2: Global Middle East Africa PVC Industry Revenue Million Forecast, by Product Type 2019 & 2032
- Table 3: Global Middle East Africa PVC Industry Revenue Million Forecast, by Application 2019 & 2032
- Table 4: Global Middle East Africa PVC Industry Revenue Million Forecast, by End-user Industry 2019 & 2032
- Table 5: Global Middle East Africa PVC Industry Revenue Million Forecast, by Geography 2019 & 2032
- Table 6: Global Middle East Africa PVC Industry Revenue Million Forecast, by Region 2019 & 2032
- Table 7: Global Middle East Africa PVC Industry Revenue Million Forecast, by Product Type 2019 & 2032
- Table 8: Global Middle East Africa PVC Industry Revenue Million Forecast, by Application 2019 & 2032
- Table 9: Global Middle East Africa PVC Industry Revenue Million Forecast, by End-user Industry 2019 & 2032
- Table 10: Global Middle East Africa PVC Industry Revenue Million Forecast, by Geography 2019 & 2032
- Table 11: Global Middle East Africa PVC Industry Revenue Million Forecast, by Country 2019 & 2032
- Table 12: Global Middle East Africa PVC Industry Revenue Million Forecast, by Product Type 2019 & 2032
- Table 13: Global Middle East Africa PVC Industry Revenue Million Forecast, by Application 2019 & 2032
- Table 14: Global Middle East Africa PVC Industry Revenue Million Forecast, by End-user Industry 2019 & 2032
- Table 15: Global Middle East Africa PVC Industry Revenue Million Forecast, by Geography 2019 & 2032
- Table 16: Global Middle East Africa PVC Industry Revenue Million Forecast, by Country 2019 & 2032
- Table 17: Global Middle East Africa PVC Industry Revenue Million Forecast, by Product Type 2019 & 2032
- Table 18: Global Middle East Africa PVC Industry Revenue Million Forecast, by Application 2019 & 2032
- Table 19: Global Middle East Africa PVC Industry Revenue Million Forecast, by End-user Industry 2019 & 2032
- Table 20: Global Middle East Africa PVC Industry Revenue Million Forecast, by Geography 2019 & 2032
- Table 21: Global Middle East Africa PVC Industry Revenue Million Forecast, by Country 2019 & 2032
- Table 22: Global Middle East Africa PVC Industry Revenue Million Forecast, by Product Type 2019 & 2032
- Table 23: Global Middle East Africa PVC Industry Revenue Million Forecast, by Application 2019 & 2032
- Table 24: Global Middle East Africa PVC Industry Revenue Million Forecast, by End-user Industry 2019 & 2032
- Table 25: Global Middle East Africa PVC Industry Revenue Million Forecast, by Geography 2019 & 2032
- Table 26: Global Middle East Africa PVC Industry Revenue Million Forecast, by Country 2019 & 2032
- Table 27: Global Middle East Africa PVC Industry Revenue Million Forecast, by Product Type 2019 & 2032
- Table 28: Global Middle East Africa PVC Industry Revenue Million Forecast, by Application 2019 & 2032
- Table 29: Global Middle East Africa PVC Industry Revenue Million Forecast, by End-user Industry 2019 & 2032
- Table 30: Global Middle East Africa PVC Industry Revenue Million Forecast, by Geography 2019 & 2032
- Table 31: Global Middle East Africa PVC Industry Revenue Million Forecast, by Country 2019 & 2032
- Table 32: Global Middle East Africa PVC Industry Revenue Million Forecast, by Product Type 2019 & 2032
- Table 33: Global Middle East Africa PVC Industry Revenue Million Forecast, by Application 2019 & 2032
- Table 34: Global Middle East Africa PVC Industry Revenue Million Forecast, by End-user Industry 2019 & 2032
- Table 35: Global Middle East Africa PVC Industry Revenue Million Forecast, by Geography 2019 & 2032
- Table 36: Global Middle East Africa PVC Industry Revenue Million Forecast, by Country 2019 & 2032
Frequently Asked Questions
1. What is the projected Compound Annual Growth Rate (CAGR) of the Middle East Africa PVC Industry?
The projected CAGR is approximately > 4.50%.
2. Which companies are prominent players in the Middle East Africa PVC Industry?
Key companies in the market include INOVYN, Africa PVC Industries Ltd, Egyptian Petrochemicals Co, LG Chem, Mexichem SAB de CV, Neproplast, Occidental Petroleum Corporation, SABIC, SASOL, Westlake Chemical Corporation*List Not Exhaustive.
3. What are the main segments of the Middle East Africa PVC Industry?
The market segments include Product Type, Application, End-user Industry, Geography.
4. Can you provide details about the market size?
The market size is estimated to be USD XX Million as of 2022.
5. What are some drivers contributing to market growth?
Growing Demand from the Construction Industry; Other Drivers.
6. What are the notable trends driving market growth?
Growing Demand from the Construction Industry.
7. Are there any restraints impacting market growth?
Growing Demand from the Construction Industry; Other Drivers.
8. Can you provide examples of recent developments in the market?
There is no recent development available.
9. What pricing options are available for accessing the report?
Pricing options include single-user, multi-user, and enterprise licenses priced at USD 4750, USD 5250, and USD 8750 respectively.
10. Is the market size provided in terms of value or volume?
The market size is provided in terms of value, measured in Million.
11. Are there any specific market keywords associated with the report?
Yes, the market keyword associated with the report is "Middle East Africa PVC Industry," which aids in identifying and referencing the specific market segment covered.
12. How do I determine which pricing option suits my needs best?
The pricing options vary based on user requirements and access needs. Individual users may opt for single-user licenses, while businesses requiring broader access may choose multi-user or enterprise licenses for cost-effective access to the report.
13. Are there any additional resources or data provided in the Middle East Africa PVC Industry report?
While the report offers comprehensive insights, it's advisable to review the specific contents or supplementary materials provided to ascertain if additional resources or data are available.
14. How can I stay updated on further developments or reports in the Middle East Africa PVC Industry?
To stay informed about further developments, trends, and reports in the Middle East Africa PVC Industry, consider subscribing to industry newsletters, following relevant companies and organizations, or regularly checking reputable industry news sources and publications.
Methodology
Step 1 - Identification of Relevant Samples Size from Population Database


Step 2 - Approaches for Defining Global Market Size (Value, Volume* & Price*)

Note*: In applicable scenarios
Step 3 - Data Sources
Primary Research
- Web Analytics
- Survey Reports
- Research Institute
- Latest Research Reports
- Opinion Leaders
Secondary Research
- Annual Reports
- White Paper
- Latest Press Release
- Industry Association
- Paid Database
- Investor Presentations

Step 4 - Data Triangulation
Involves using different sources of information in order to increase the validity of a study
These sources are likely to be stakeholders in a program - participants, other researchers, program staff, other community members, and so on.
Then we put all data in single framework & apply various statistical tools to find out the dynamic on the market.
During the analysis stage, feedback from the stakeholder groups would be compared to determine areas of agreement as well as areas of divergence


