
Key Insights
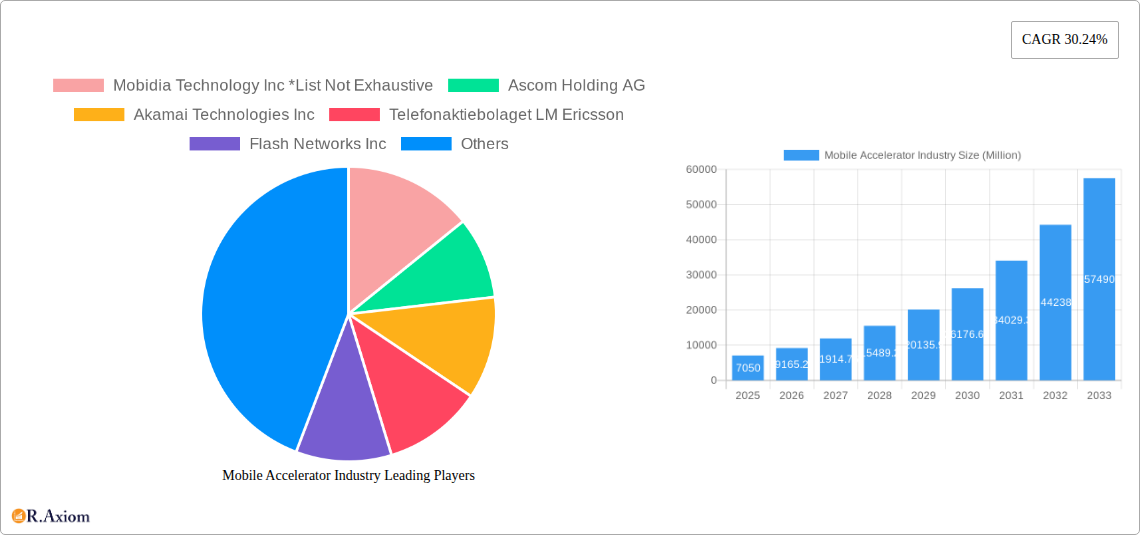
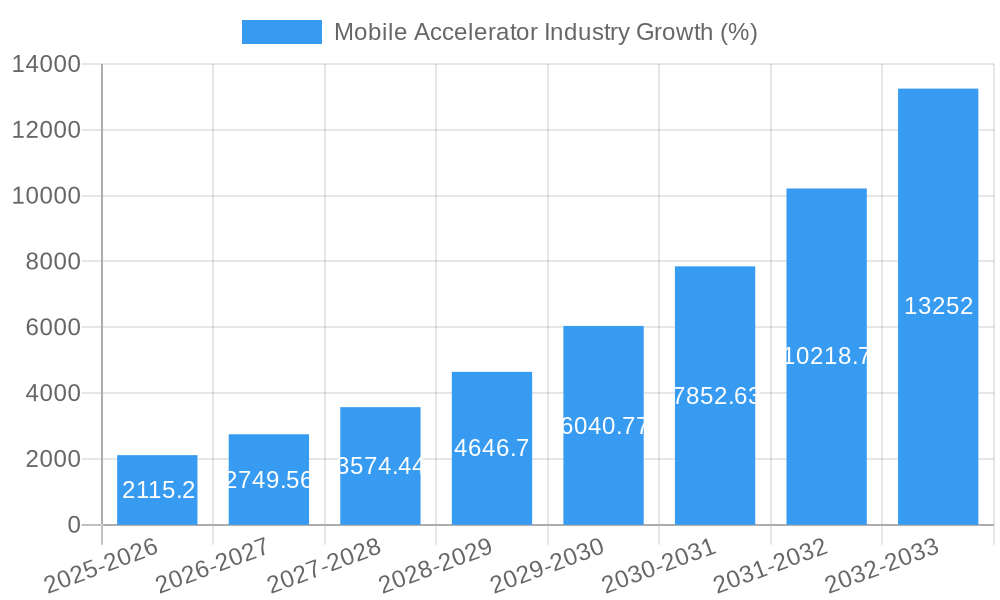
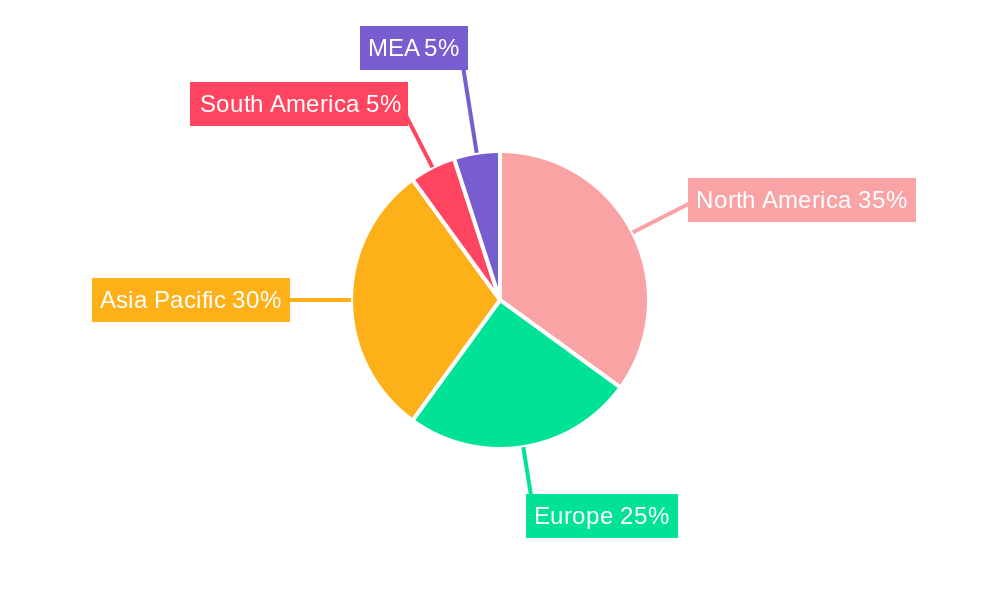
The mobile accelerator market, valued at $7.05 billion in 2025, is experiencing robust growth, projected to expand at a compound annual growth rate (CAGR) of 30.24% from 2025 to 2033. This surge is driven by several key factors. The proliferation of mobile devices, particularly smartphones and tablets, coupled with the increasing reliance on mobile applications for various activities like gaming, e-commerce, and social networking, fuels the demand for faster and more efficient mobile experiences. The need for optimized content delivery and reduced latency in mobile networks is driving adoption of content delivery network (CDN) acceleration and mobile application accelerators across diverse industries. Furthermore, the expansion of 5G networks and the increasing adoption of cloud-based services are expected to further accelerate market growth. The market is segmented by device type (smartphones, tablets, others), acceleration type (CDN acceleration, WAN optimization, mobile application acceleration, etc.), and application (gaming, m-commerce, social networking, etc.). North America and Asia Pacific currently dominate the market, but significant growth opportunities exist in developing economies driven by rising smartphone penetration and increasing internet connectivity.
Competitive forces are shaping the market landscape. Major players like Akamai Technologies, Ericsson, and Qualcomm are investing heavily in research and development to enhance their product offerings and expand their market share. The presence of numerous smaller, specialized companies, including Mobidia Technology and Flash Networks, indicates a dynamic and innovative industry. The market faces challenges including security concerns related to mobile data transmission and the need for interoperability between different mobile platforms and networks. However, continuous advancements in technology and increased investment in mobile infrastructure are poised to overcome these restraints and ensure continued expansion of the mobile accelerator market throughout the forecast period.
Mobile Accelerator Industry: A Comprehensive Market Report (2019-2033)
This detailed report provides a comprehensive analysis of the Mobile Accelerator Industry, offering invaluable insights for stakeholders, investors, and industry professionals. The report covers the period 2019-2033, with a base year of 2025 and a forecast period of 2025-2033. The market is segmented by device, type, and application, allowing for a granular understanding of current trends and future growth potential. The total market size is projected to reach xx Million by 2033.
Mobile Accelerator Industry Market Concentration & Innovation
This section analyzes the competitive landscape of the Mobile Accelerator Industry, examining market concentration, innovation drivers, regulatory frameworks, product substitutes, end-user trends, and M&A activities. The industry is characterized by a moderately concentrated market, with several key players holding significant market share. For instance, Qualcomm Inc. and Huawei Technologies Co Ltd are estimated to hold a combined xx% market share in 2025.
- Market Concentration: The Herfindahl-Hirschman Index (HHI) is estimated at xx in 2025, indicating a moderately concentrated market.
- Innovation Drivers: The primary drivers of innovation include the increasing demand for high-speed data transfer, the proliferation of mobile devices, and the rise of data-intensive applications like gaming and streaming.
- Regulatory Frameworks: Government regulations related to data privacy and security significantly impact industry players. Compliance costs and evolving standards present both challenges and opportunities.
- Product Substitutes: Existing technologies, such as traditional WAN optimization solutions, pose a competitive threat to the market. However, the superior speed and performance of mobile accelerators drive market growth.
- End-User Trends: The growing demand for enhanced mobile experiences in areas such as gaming, streaming, and augmented/virtual reality is driving market expansion.
- M&A Activities: In recent years, the industry has seen several M&A deals with a total estimated value of xx Million in the period 2019-2024. These transactions reflect the ongoing consolidation and strategic positioning of major players. Future M&A activity is expected to continue with a projected xx Million in deal value for 2025-2028.
Mobile Accelerator Industry Industry Trends & Insights
This section explores key market trends and insights, focusing on market growth drivers, technological disruptions, consumer preferences, and competitive dynamics. The global Mobile Accelerator market is experiencing robust growth, driven by the exponential increase in mobile data consumption and the rise of bandwidth-intensive applications.
The market is projected to exhibit a Compound Annual Growth Rate (CAGR) of xx% during the forecast period (2025-2033). Market penetration is expected to increase significantly, with a projected xx% penetration rate by 2033. Key technological disruptions include advancements in 5G technology, edge computing, and software-defined networking (SDN), all significantly influencing the industry's growth trajectory. Consumer preferences are shifting towards seamless and lag-free mobile experiences, driving demand for advanced mobile accelerators. Competitive dynamics are shaping the landscape with companies focusing on differentiation through specialized solutions and strategic partnerships.
Dominant Markets & Segments in Mobile Accelerator Industry
This section identifies the leading regions, countries, and segments within the Mobile Accelerator market. While precise market share data for each segment requires extensive market research and analysis, we project the following:
- By Device: Smartphones are the dominant segment, accounting for the majority of market revenue. Tablets represent a significant, yet smaller, portion of the market, followed by other devices.
- By Type: Content Delivery Network (CDN) Acceleration is a leading segment, followed by Mobile Application Accelerators and WAN Optimization. This is primarily due to the ever increasing demand for high-speed data transfer and reliable application performance.
- By Application: Gaming Applications and M-commerce applications are the dominant segments, fueled by the high bandwidth demands of these applications. Social Networking, Music and Messaging applications are also substantial contributors.
Key Drivers for Dominant Segments:
- Economic Policies: Government initiatives supporting digital infrastructure development and the adoption of advanced technologies.
- Infrastructure: Advancements in 5G network deployment and robust internet connectivity significantly boost growth.
Mobile Accelerator Industry Product Developments
Recent product innovations focus on enhancing speed, efficiency, and security. New mobile accelerators are incorporating advanced algorithms and AI-powered optimization techniques to provide superior performance and seamless user experiences. This reflects the ongoing trend toward integrating software and hardware to deliver a more comprehensive solution. The competitive landscape is characterized by continuous innovation and the development of specialized accelerators tailored to specific applications and device types.
Report Scope & Segmentation Analysis
This report offers a comprehensive segmentation analysis of the Mobile Accelerator Industry. Each segment (By Device, By Type, By Application) is assessed separately, providing detailed growth projections, market size estimations, and competitive dynamics. While exact figures require in-depth analysis, we project substantial growth across all segments during the forecast period. The competitive intensity varies across segments, with some exhibiting higher competition due to the presence of numerous players with diverse offerings.
Key Drivers of Mobile Accelerator Industry Growth
Several factors drive the growth of the Mobile Accelerator Industry:
- Technological Advancements: The proliferation of high-bandwidth applications (e.g., gaming, streaming) and the development of advanced network technologies (e.g., 5G).
- Economic Growth: Increasing disposable incomes and expanding mobile penetration rates worldwide contribute to market growth.
- Favorable Regulatory Environment: Government support for digital infrastructure development and a growing emphasis on a robust digital economy.
Challenges in the Mobile Accelerator Industry Sector
The industry faces challenges such as:
- Regulatory Hurdles: Compliance with data privacy and security regulations increases operational costs and complexities.
- Supply Chain Issues: Global supply chain disruptions and component shortages can affect production capacity and lead times.
- Intense Competition: The presence of numerous players leads to competitive pricing pressure and the need for continuous innovation.
Emerging Opportunities in Mobile Accelerator Industry
Emerging opportunities include:
- Expansion into New Markets: Untapped potential in developing economies with rising mobile usage.
- Technological Innovation: Exploring new technologies such as edge computing and AI to enhance acceleration capabilities.
- Focus on Niche Applications: Developing tailored solutions for specific applications (e.g., IoT, AR/VR).
Leading Players in the Mobile Accelerator Industry Market
- Mobidia Technology Inc
- Ascom Holding AG
- Akamai Technologies Inc
- Telefonaktiebolaget LM Ericsson
- Flash Networks Inc
- F5 Networks Inc
- Juniper Networks Inc
- Huawei Technologies Co Ltd
- Riverbed Technologies Inc
- Rockstart Inc
- Qualcomm Inc
Key Developments in Mobile Accelerator Industry Industry
- November 2023: Huawei Technologies Co. Ltd. unveiled two new all-flash storage products, the OceanStor Pacific 9920 and OceanStor Dorado 2100, enhancing data center efficiency and reliability.
- October 2023: Sasken Technologies collaborated with Qualcomm Technologies, Inc., advancing IoT innovation and connected device services.
Strategic Outlook for Mobile Accelerator Industry Market
The Mobile Accelerator Industry is poised for significant growth, driven by the ongoing increase in mobile data consumption, advancements in 5G and edge computing, and the proliferation of data-intensive applications. Strategic partnerships, targeted investments in research and development, and a focus on innovative solutions will be crucial for success in this rapidly evolving market. The industry will continue to see consolidation and the emergence of new specialized players as the demand for seamless and high-performance mobile experiences continues to rise.
Mobile Accelerator Industry Segmentation
-
1. Device
- 1.1. Smartphones
- 1.2. Tablets
- 1.3. Other Devices
-
2. Type
- 2.1. Content/Web Applications
- 2.2. Content Delivery Network Acceleration
- 2.3. WAN Optimization
- 2.4. Mobile Application Accelerator
- 2.5. Device/User End Acceleration
- 2.6. Other Types
-
3. Application
- 3.1. Gaming Applications
- 3.2. M-Commerce Applications
- 3.3. Location-based Service Applications
- 3.4. Social Networking Applications
- 3.5. Music and Messaging Applications
- 3.6. Other Applications
Mobile Accelerator Industry Segmentation By Geography
- 1. North America
- 2. Europe
- 3. Asia Pacific
- 4. Latin America
- 5. Middle East and Africa
Mobile Accelerator Industry REPORT HIGHLIGHTS
| Aspects | Details |
|---|---|
| Study Period | 2019-2033 |
| Base Year | 2024 |
| Estimated Year | 2025 |
| Forecast Period | 2025-2033 |
| Historical Period | 2019-2024 |
| Growth Rate | CAGR of 30.24% from 2019-2033 |
| Segmentation |
|
Table of Contents
- 1. Introduction
- 1.1. Research Scope
- 1.2. Market Segmentation
- 1.3. Research Methodology
- 1.4. Definitions and Assumptions
- 2. Executive Summary
- 2.1. Introduction
- 3. Market Dynamics
- 3.1. Introduction
- 3.2. Market Drivers
- 3.2.1. Increasing Mobile Traffic and Mobile Marketing Trends
- 3.3. Market Restrains
- 3.3.1. Security Challenges as the Data is shared with Third-party Vendors
- 3.4. Market Trends
- 3.4.1. Increasing Mobile Traffic and Mobile Marketing Trends is Expected to Drive the Market Growth
- 4. Market Factor Analysis
- 4.1. Porters Five Forces
- 4.2. Supply/Value Chain
- 4.3. PESTEL analysis
- 4.4. Market Entropy
- 4.5. Patent/Trademark Analysis
- 5. Global Mobile Accelerator Industry Analysis, Insights and Forecast, 2019-2031
- 5.1. Market Analysis, Insights and Forecast - by Device
- 5.1.1. Smartphones
- 5.1.2. Tablets
- 5.1.3. Other Devices
- 5.2. Market Analysis, Insights and Forecast - by Type
- 5.2.1. Content/Web Applications
- 5.2.2. Content Delivery Network Acceleration
- 5.2.3. WAN Optimization
- 5.2.4. Mobile Application Accelerator
- 5.2.5. Device/User End Acceleration
- 5.2.6. Other Types
- 5.3. Market Analysis, Insights and Forecast - by Application
- 5.3.1. Gaming Applications
- 5.3.2. M-Commerce Applications
- 5.3.3. Location-based Service Applications
- 5.3.4. Social Networking Applications
- 5.3.5. Music and Messaging Applications
- 5.3.6. Other Applications
- 5.4. Market Analysis, Insights and Forecast - by Region
- 5.4.1. North America
- 5.4.2. Europe
- 5.4.3. Asia Pacific
- 5.4.4. Latin America
- 5.4.5. Middle East and Africa
- 5.1. Market Analysis, Insights and Forecast - by Device
- 6. North America Mobile Accelerator Industry Analysis, Insights and Forecast, 2019-2031
- 6.1. Market Analysis, Insights and Forecast - by Device
- 6.1.1. Smartphones
- 6.1.2. Tablets
- 6.1.3. Other Devices
- 6.2. Market Analysis, Insights and Forecast - by Type
- 6.2.1. Content/Web Applications
- 6.2.2. Content Delivery Network Acceleration
- 6.2.3. WAN Optimization
- 6.2.4. Mobile Application Accelerator
- 6.2.5. Device/User End Acceleration
- 6.2.6. Other Types
- 6.3. Market Analysis, Insights and Forecast - by Application
- 6.3.1. Gaming Applications
- 6.3.2. M-Commerce Applications
- 6.3.3. Location-based Service Applications
- 6.3.4. Social Networking Applications
- 6.3.5. Music and Messaging Applications
- 6.3.6. Other Applications
- 6.1. Market Analysis, Insights and Forecast - by Device
- 7. Europe Mobile Accelerator Industry Analysis, Insights and Forecast, 2019-2031
- 7.1. Market Analysis, Insights and Forecast - by Device
- 7.1.1. Smartphones
- 7.1.2. Tablets
- 7.1.3. Other Devices
- 7.2. Market Analysis, Insights and Forecast - by Type
- 7.2.1. Content/Web Applications
- 7.2.2. Content Delivery Network Acceleration
- 7.2.3. WAN Optimization
- 7.2.4. Mobile Application Accelerator
- 7.2.5. Device/User End Acceleration
- 7.2.6. Other Types
- 7.3. Market Analysis, Insights and Forecast - by Application
- 7.3.1. Gaming Applications
- 7.3.2. M-Commerce Applications
- 7.3.3. Location-based Service Applications
- 7.3.4. Social Networking Applications
- 7.3.5. Music and Messaging Applications
- 7.3.6. Other Applications
- 7.1. Market Analysis, Insights and Forecast - by Device
- 8. Asia Pacific Mobile Accelerator Industry Analysis, Insights and Forecast, 2019-2031
- 8.1. Market Analysis, Insights and Forecast - by Device
- 8.1.1. Smartphones
- 8.1.2. Tablets
- 8.1.3. Other Devices
- 8.2. Market Analysis, Insights and Forecast - by Type
- 8.2.1. Content/Web Applications
- 8.2.2. Content Delivery Network Acceleration
- 8.2.3. WAN Optimization
- 8.2.4. Mobile Application Accelerator
- 8.2.5. Device/User End Acceleration
- 8.2.6. Other Types
- 8.3. Market Analysis, Insights and Forecast - by Application
- 8.3.1. Gaming Applications
- 8.3.2. M-Commerce Applications
- 8.3.3. Location-based Service Applications
- 8.3.4. Social Networking Applications
- 8.3.5. Music and Messaging Applications
- 8.3.6. Other Applications
- 8.1. Market Analysis, Insights and Forecast - by Device
- 9. Latin America Mobile Accelerator Industry Analysis, Insights and Forecast, 2019-2031
- 9.1. Market Analysis, Insights and Forecast - by Device
- 9.1.1. Smartphones
- 9.1.2. Tablets
- 9.1.3. Other Devices
- 9.2. Market Analysis, Insights and Forecast - by Type
- 9.2.1. Content/Web Applications
- 9.2.2. Content Delivery Network Acceleration
- 9.2.3. WAN Optimization
- 9.2.4. Mobile Application Accelerator
- 9.2.5. Device/User End Acceleration
- 9.2.6. Other Types
- 9.3. Market Analysis, Insights and Forecast - by Application
- 9.3.1. Gaming Applications
- 9.3.2. M-Commerce Applications
- 9.3.3. Location-based Service Applications
- 9.3.4. Social Networking Applications
- 9.3.5. Music and Messaging Applications
- 9.3.6. Other Applications
- 9.1. Market Analysis, Insights and Forecast - by Device
- 10. Middle East and Africa Mobile Accelerator Industry Analysis, Insights and Forecast, 2019-2031
- 10.1. Market Analysis, Insights and Forecast - by Device
- 10.1.1. Smartphones
- 10.1.2. Tablets
- 10.1.3. Other Devices
- 10.2. Market Analysis, Insights and Forecast - by Type
- 10.2.1. Content/Web Applications
- 10.2.2. Content Delivery Network Acceleration
- 10.2.3. WAN Optimization
- 10.2.4. Mobile Application Accelerator
- 10.2.5. Device/User End Acceleration
- 10.2.6. Other Types
- 10.3. Market Analysis, Insights and Forecast - by Application
- 10.3.1. Gaming Applications
- 10.3.2. M-Commerce Applications
- 10.3.3. Location-based Service Applications
- 10.3.4. Social Networking Applications
- 10.3.5. Music and Messaging Applications
- 10.3.6. Other Applications
- 10.1. Market Analysis, Insights and Forecast - by Device
- 11. North America Mobile Accelerator Industry Analysis, Insights and Forecast, 2019-2031
- 11.1. Market Analysis, Insights and Forecast - By Country/Sub-region
- 11.1.1 United States
- 11.1.2 Canada
- 11.1.3 Mexico
- 12. Europe Mobile Accelerator Industry Analysis, Insights and Forecast, 2019-2031
- 12.1. Market Analysis, Insights and Forecast - By Country/Sub-region
- 12.1.1 Germany
- 12.1.2 United Kingdom
- 12.1.3 France
- 12.1.4 Spain
- 12.1.5 Italy
- 12.1.6 Spain
- 12.1.7 Belgium
- 12.1.8 Netherland
- 12.1.9 Nordics
- 12.1.10 Rest of Europe
- 13. Asia Pacific Mobile Accelerator Industry Analysis, Insights and Forecast, 2019-2031
- 13.1. Market Analysis, Insights and Forecast - By Country/Sub-region
- 13.1.1 China
- 13.1.2 Japan
- 13.1.3 India
- 13.1.4 South Korea
- 13.1.5 Southeast Asia
- 13.1.6 Australia
- 13.1.7 Indonesia
- 13.1.8 Phillipes
- 13.1.9 Singapore
- 13.1.10 Thailandc
- 13.1.11 Rest of Asia Pacific
- 14. South America Mobile Accelerator Industry Analysis, Insights and Forecast, 2019-2031
- 14.1. Market Analysis, Insights and Forecast - By Country/Sub-region
- 14.1.1 Brazil
- 14.1.2 Argentina
- 14.1.3 Peru
- 14.1.4 Chile
- 14.1.5 Colombia
- 14.1.6 Ecuador
- 14.1.7 Venezuela
- 14.1.8 Rest of South America
- 15. North America Mobile Accelerator Industry Analysis, Insights and Forecast, 2019-2031
- 15.1. Market Analysis, Insights and Forecast - By Country/Sub-region
- 15.1.1 United States
- 15.1.2 Canada
- 15.1.3 Mexico
- 16. MEA Mobile Accelerator Industry Analysis, Insights and Forecast, 2019-2031
- 16.1. Market Analysis, Insights and Forecast - By Country/Sub-region
- 16.1.1 United Arab Emirates
- 16.1.2 Saudi Arabia
- 16.1.3 South Africa
- 16.1.4 Rest of Middle East and Africa
- 17. Competitive Analysis
- 17.1. Global Market Share Analysis 2024
- 17.2. Company Profiles
- 17.2.1 Mobidia Technology Inc *List Not Exhaustive
- 17.2.1.1. Overview
- 17.2.1.2. Products
- 17.2.1.3. SWOT Analysis
- 17.2.1.4. Recent Developments
- 17.2.1.5. Financials (Based on Availability)
- 17.2.2 Ascom Holding AG
- 17.2.2.1. Overview
- 17.2.2.2. Products
- 17.2.2.3. SWOT Analysis
- 17.2.2.4. Recent Developments
- 17.2.2.5. Financials (Based on Availability)
- 17.2.3 Akamai Technologies Inc
- 17.2.3.1. Overview
- 17.2.3.2. Products
- 17.2.3.3. SWOT Analysis
- 17.2.3.4. Recent Developments
- 17.2.3.5. Financials (Based on Availability)
- 17.2.4 Telefonaktiebolaget LM Ericsson
- 17.2.4.1. Overview
- 17.2.4.2. Products
- 17.2.4.3. SWOT Analysis
- 17.2.4.4. Recent Developments
- 17.2.4.5. Financials (Based on Availability)
- 17.2.5 Flash Networks Inc
- 17.2.5.1. Overview
- 17.2.5.2. Products
- 17.2.5.3. SWOT Analysis
- 17.2.5.4. Recent Developments
- 17.2.5.5. Financials (Based on Availability)
- 17.2.6 F5 Networks Inc
- 17.2.6.1. Overview
- 17.2.6.2. Products
- 17.2.6.3. SWOT Analysis
- 17.2.6.4. Recent Developments
- 17.2.6.5. Financials (Based on Availability)
- 17.2.7 Juniper Networks Inc
- 17.2.7.1. Overview
- 17.2.7.2. Products
- 17.2.7.3. SWOT Analysis
- 17.2.7.4. Recent Developments
- 17.2.7.5. Financials (Based on Availability)
- 17.2.8 Huawei Technologies Co Ltd
- 17.2.8.1. Overview
- 17.2.8.2. Products
- 17.2.8.3. SWOT Analysis
- 17.2.8.4. Recent Developments
- 17.2.8.5. Financials (Based on Availability)
- 17.2.9 Riverbed Technologies Inc
- 17.2.9.1. Overview
- 17.2.9.2. Products
- 17.2.9.3. SWOT Analysis
- 17.2.9.4. Recent Developments
- 17.2.9.5. Financials (Based on Availability)
- 17.2.10 Rockstart Inc
- 17.2.10.1. Overview
- 17.2.10.2. Products
- 17.2.10.3. SWOT Analysis
- 17.2.10.4. Recent Developments
- 17.2.10.5. Financials (Based on Availability)
- 17.2.11 Qualcomm Inc
- 17.2.11.1. Overview
- 17.2.11.2. Products
- 17.2.11.3. SWOT Analysis
- 17.2.11.4. Recent Developments
- 17.2.11.5. Financials (Based on Availability)
- 17.2.1 Mobidia Technology Inc *List Not Exhaustive
List of Figures
- Figure 1: Global Mobile Accelerator Industry Revenue Breakdown (Million, %) by Region 2024 & 2032
- Figure 2: North America Mobile Accelerator Industry Revenue (Million), by Country 2024 & 2032
- Figure 3: North America Mobile Accelerator Industry Revenue Share (%), by Country 2024 & 2032
- Figure 4: Europe Mobile Accelerator Industry Revenue (Million), by Country 2024 & 2032
- Figure 5: Europe Mobile Accelerator Industry Revenue Share (%), by Country 2024 & 2032
- Figure 6: Asia Pacific Mobile Accelerator Industry Revenue (Million), by Country 2024 & 2032
- Figure 7: Asia Pacific Mobile Accelerator Industry Revenue Share (%), by Country 2024 & 2032
- Figure 8: South America Mobile Accelerator Industry Revenue (Million), by Country 2024 & 2032
- Figure 9: South America Mobile Accelerator Industry Revenue Share (%), by Country 2024 & 2032
- Figure 10: North America Mobile Accelerator Industry Revenue (Million), by Country 2024 & 2032
- Figure 11: North America Mobile Accelerator Industry Revenue Share (%), by Country 2024 & 2032
- Figure 12: MEA Mobile Accelerator Industry Revenue (Million), by Country 2024 & 2032
- Figure 13: MEA Mobile Accelerator Industry Revenue Share (%), by Country 2024 & 2032
- Figure 14: North America Mobile Accelerator Industry Revenue (Million), by Device 2024 & 2032
- Figure 15: North America Mobile Accelerator Industry Revenue Share (%), by Device 2024 & 2032
- Figure 16: North America Mobile Accelerator Industry Revenue (Million), by Type 2024 & 2032
- Figure 17: North America Mobile Accelerator Industry Revenue Share (%), by Type 2024 & 2032
- Figure 18: North America Mobile Accelerator Industry Revenue (Million), by Application 2024 & 2032
- Figure 19: North America Mobile Accelerator Industry Revenue Share (%), by Application 2024 & 2032
- Figure 20: North America Mobile Accelerator Industry Revenue (Million), by Country 2024 & 2032
- Figure 21: North America Mobile Accelerator Industry Revenue Share (%), by Country 2024 & 2032
- Figure 22: Europe Mobile Accelerator Industry Revenue (Million), by Device 2024 & 2032
- Figure 23: Europe Mobile Accelerator Industry Revenue Share (%), by Device 2024 & 2032
- Figure 24: Europe Mobile Accelerator Industry Revenue (Million), by Type 2024 & 2032
- Figure 25: Europe Mobile Accelerator Industry Revenue Share (%), by Type 2024 & 2032
- Figure 26: Europe Mobile Accelerator Industry Revenue (Million), by Application 2024 & 2032
- Figure 27: Europe Mobile Accelerator Industry Revenue Share (%), by Application 2024 & 2032
- Figure 28: Europe Mobile Accelerator Industry Revenue (Million), by Country 2024 & 2032
- Figure 29: Europe Mobile Accelerator Industry Revenue Share (%), by Country 2024 & 2032
- Figure 30: Asia Pacific Mobile Accelerator Industry Revenue (Million), by Device 2024 & 2032
- Figure 31: Asia Pacific Mobile Accelerator Industry Revenue Share (%), by Device 2024 & 2032
- Figure 32: Asia Pacific Mobile Accelerator Industry Revenue (Million), by Type 2024 & 2032
- Figure 33: Asia Pacific Mobile Accelerator Industry Revenue Share (%), by Type 2024 & 2032
- Figure 34: Asia Pacific Mobile Accelerator Industry Revenue (Million), by Application 2024 & 2032
- Figure 35: Asia Pacific Mobile Accelerator Industry Revenue Share (%), by Application 2024 & 2032
- Figure 36: Asia Pacific Mobile Accelerator Industry Revenue (Million), by Country 2024 & 2032
- Figure 37: Asia Pacific Mobile Accelerator Industry Revenue Share (%), by Country 2024 & 2032
- Figure 38: Latin America Mobile Accelerator Industry Revenue (Million), by Device 2024 & 2032
- Figure 39: Latin America Mobile Accelerator Industry Revenue Share (%), by Device 2024 & 2032
- Figure 40: Latin America Mobile Accelerator Industry Revenue (Million), by Type 2024 & 2032
- Figure 41: Latin America Mobile Accelerator Industry Revenue Share (%), by Type 2024 & 2032
- Figure 42: Latin America Mobile Accelerator Industry Revenue (Million), by Application 2024 & 2032
- Figure 43: Latin America Mobile Accelerator Industry Revenue Share (%), by Application 2024 & 2032
- Figure 44: Latin America Mobile Accelerator Industry Revenue (Million), by Country 2024 & 2032
- Figure 45: Latin America Mobile Accelerator Industry Revenue Share (%), by Country 2024 & 2032
- Figure 46: Middle East and Africa Mobile Accelerator Industry Revenue (Million), by Device 2024 & 2032
- Figure 47: Middle East and Africa Mobile Accelerator Industry Revenue Share (%), by Device 2024 & 2032
- Figure 48: Middle East and Africa Mobile Accelerator Industry Revenue (Million), by Type 2024 & 2032
- Figure 49: Middle East and Africa Mobile Accelerator Industry Revenue Share (%), by Type 2024 & 2032
- Figure 50: Middle East and Africa Mobile Accelerator Industry Revenue (Million), by Application 2024 & 2032
- Figure 51: Middle East and Africa Mobile Accelerator Industry Revenue Share (%), by Application 2024 & 2032
- Figure 52: Middle East and Africa Mobile Accelerator Industry Revenue (Million), by Country 2024 & 2032
- Figure 53: Middle East and Africa Mobile Accelerator Industry Revenue Share (%), by Country 2024 & 2032
List of Tables
- Table 1: Global Mobile Accelerator Industry Revenue Million Forecast, by Region 2019 & 2032
- Table 2: Global Mobile Accelerator Industry Revenue Million Forecast, by Device 2019 & 2032
- Table 3: Global Mobile Accelerator Industry Revenue Million Forecast, by Type 2019 & 2032
- Table 4: Global Mobile Accelerator Industry Revenue Million Forecast, by Application 2019 & 2032
- Table 5: Global Mobile Accelerator Industry Revenue Million Forecast, by Region 2019 & 2032
- Table 6: Global Mobile Accelerator Industry Revenue Million Forecast, by Country 2019 & 2032
- Table 7: United States Mobile Accelerator Industry Revenue (Million) Forecast, by Application 2019 & 2032
- Table 8: Canada Mobile Accelerator Industry Revenue (Million) Forecast, by Application 2019 & 2032
- Table 9: Mexico Mobile Accelerator Industry Revenue (Million) Forecast, by Application 2019 & 2032
- Table 10: Global Mobile Accelerator Industry Revenue Million Forecast, by Country 2019 & 2032
- Table 11: Germany Mobile Accelerator Industry Revenue (Million) Forecast, by Application 2019 & 2032
- Table 12: United Kingdom Mobile Accelerator Industry Revenue (Million) Forecast, by Application 2019 & 2032
- Table 13: France Mobile Accelerator Industry Revenue (Million) Forecast, by Application 2019 & 2032
- Table 14: Spain Mobile Accelerator Industry Revenue (Million) Forecast, by Application 2019 & 2032
- Table 15: Italy Mobile Accelerator Industry Revenue (Million) Forecast, by Application 2019 & 2032
- Table 16: Spain Mobile Accelerator Industry Revenue (Million) Forecast, by Application 2019 & 2032
- Table 17: Belgium Mobile Accelerator Industry Revenue (Million) Forecast, by Application 2019 & 2032
- Table 18: Netherland Mobile Accelerator Industry Revenue (Million) Forecast, by Application 2019 & 2032
- Table 19: Nordics Mobile Accelerator Industry Revenue (Million) Forecast, by Application 2019 & 2032
- Table 20: Rest of Europe Mobile Accelerator Industry Revenue (Million) Forecast, by Application 2019 & 2032
- Table 21: Global Mobile Accelerator Industry Revenue Million Forecast, by Country 2019 & 2032
- Table 22: China Mobile Accelerator Industry Revenue (Million) Forecast, by Application 2019 & 2032
- Table 23: Japan Mobile Accelerator Industry Revenue (Million) Forecast, by Application 2019 & 2032
- Table 24: India Mobile Accelerator Industry Revenue (Million) Forecast, by Application 2019 & 2032
- Table 25: South Korea Mobile Accelerator Industry Revenue (Million) Forecast, by Application 2019 & 2032
- Table 26: Southeast Asia Mobile Accelerator Industry Revenue (Million) Forecast, by Application 2019 & 2032
- Table 27: Australia Mobile Accelerator Industry Revenue (Million) Forecast, by Application 2019 & 2032
- Table 28: Indonesia Mobile Accelerator Industry Revenue (Million) Forecast, by Application 2019 & 2032
- Table 29: Phillipes Mobile Accelerator Industry Revenue (Million) Forecast, by Application 2019 & 2032
- Table 30: Singapore Mobile Accelerator Industry Revenue (Million) Forecast, by Application 2019 & 2032
- Table 31: Thailandc Mobile Accelerator Industry Revenue (Million) Forecast, by Application 2019 & 2032
- Table 32: Rest of Asia Pacific Mobile Accelerator Industry Revenue (Million) Forecast, by Application 2019 & 2032
- Table 33: Global Mobile Accelerator Industry Revenue Million Forecast, by Country 2019 & 2032
- Table 34: Brazil Mobile Accelerator Industry Revenue (Million) Forecast, by Application 2019 & 2032
- Table 35: Argentina Mobile Accelerator Industry Revenue (Million) Forecast, by Application 2019 & 2032
- Table 36: Peru Mobile Accelerator Industry Revenue (Million) Forecast, by Application 2019 & 2032
- Table 37: Chile Mobile Accelerator Industry Revenue (Million) Forecast, by Application 2019 & 2032
- Table 38: Colombia Mobile Accelerator Industry Revenue (Million) Forecast, by Application 2019 & 2032
- Table 39: Ecuador Mobile Accelerator Industry Revenue (Million) Forecast, by Application 2019 & 2032
- Table 40: Venezuela Mobile Accelerator Industry Revenue (Million) Forecast, by Application 2019 & 2032
- Table 41: Rest of South America Mobile Accelerator Industry Revenue (Million) Forecast, by Application 2019 & 2032
- Table 42: Global Mobile Accelerator Industry Revenue Million Forecast, by Country 2019 & 2032
- Table 43: United States Mobile Accelerator Industry Revenue (Million) Forecast, by Application 2019 & 2032
- Table 44: Canada Mobile Accelerator Industry Revenue (Million) Forecast, by Application 2019 & 2032
- Table 45: Mexico Mobile Accelerator Industry Revenue (Million) Forecast, by Application 2019 & 2032
- Table 46: Global Mobile Accelerator Industry Revenue Million Forecast, by Country 2019 & 2032
- Table 47: United Arab Emirates Mobile Accelerator Industry Revenue (Million) Forecast, by Application 2019 & 2032
- Table 48: Saudi Arabia Mobile Accelerator Industry Revenue (Million) Forecast, by Application 2019 & 2032
- Table 49: South Africa Mobile Accelerator Industry Revenue (Million) Forecast, by Application 2019 & 2032
- Table 50: Rest of Middle East and Africa Mobile Accelerator Industry Revenue (Million) Forecast, by Application 2019 & 2032
- Table 51: Global Mobile Accelerator Industry Revenue Million Forecast, by Device 2019 & 2032
- Table 52: Global Mobile Accelerator Industry Revenue Million Forecast, by Type 2019 & 2032
- Table 53: Global Mobile Accelerator Industry Revenue Million Forecast, by Application 2019 & 2032
- Table 54: Global Mobile Accelerator Industry Revenue Million Forecast, by Country 2019 & 2032
- Table 55: Global Mobile Accelerator Industry Revenue Million Forecast, by Device 2019 & 2032
- Table 56: Global Mobile Accelerator Industry Revenue Million Forecast, by Type 2019 & 2032
- Table 57: Global Mobile Accelerator Industry Revenue Million Forecast, by Application 2019 & 2032
- Table 58: Global Mobile Accelerator Industry Revenue Million Forecast, by Country 2019 & 2032
- Table 59: Global Mobile Accelerator Industry Revenue Million Forecast, by Device 2019 & 2032
- Table 60: Global Mobile Accelerator Industry Revenue Million Forecast, by Type 2019 & 2032
- Table 61: Global Mobile Accelerator Industry Revenue Million Forecast, by Application 2019 & 2032
- Table 62: Global Mobile Accelerator Industry Revenue Million Forecast, by Country 2019 & 2032
- Table 63: Global Mobile Accelerator Industry Revenue Million Forecast, by Device 2019 & 2032
- Table 64: Global Mobile Accelerator Industry Revenue Million Forecast, by Type 2019 & 2032
- Table 65: Global Mobile Accelerator Industry Revenue Million Forecast, by Application 2019 & 2032
- Table 66: Global Mobile Accelerator Industry Revenue Million Forecast, by Country 2019 & 2032
- Table 67: Global Mobile Accelerator Industry Revenue Million Forecast, by Device 2019 & 2032
- Table 68: Global Mobile Accelerator Industry Revenue Million Forecast, by Type 2019 & 2032
- Table 69: Global Mobile Accelerator Industry Revenue Million Forecast, by Application 2019 & 2032
- Table 70: Global Mobile Accelerator Industry Revenue Million Forecast, by Country 2019 & 2032
Frequently Asked Questions
1. What is the projected Compound Annual Growth Rate (CAGR) of the Mobile Accelerator Industry?
The projected CAGR is approximately 30.24%.
2. Which companies are prominent players in the Mobile Accelerator Industry?
Key companies in the market include Mobidia Technology Inc *List Not Exhaustive, Ascom Holding AG, Akamai Technologies Inc, Telefonaktiebolaget LM Ericsson, Flash Networks Inc, F5 Networks Inc, Juniper Networks Inc, Huawei Technologies Co Ltd, Riverbed Technologies Inc, Rockstart Inc, Qualcomm Inc.
3. What are the main segments of the Mobile Accelerator Industry?
The market segments include Device, Type, Application.
4. Can you provide details about the market size?
The market size is estimated to be USD 7.05 Million as of 2022.
5. What are some drivers contributing to market growth?
Increasing Mobile Traffic and Mobile Marketing Trends.
6. What are the notable trends driving market growth?
Increasing Mobile Traffic and Mobile Marketing Trends is Expected to Drive the Market Growth.
7. Are there any restraints impacting market growth?
Security Challenges as the Data is shared with Third-party Vendors.
8. Can you provide examples of recent developments in the market?
November 2023 - Huawei Technologies Co. Ltd unveiled two new all-flash storage products, the OceanStor Pacific 9920 and OceanStor Dorado 2100, to promote the industry vision of All Flash for All Scenarios. The products have been designed to help customers build more efficient and reliable data centers.
9. What pricing options are available for accessing the report?
Pricing options include single-user, multi-user, and enterprise licenses priced at USD 4750, USD 5250, and USD 8750 respectively.
10. Is the market size provided in terms of value or volume?
The market size is provided in terms of value, measured in Million.
11. Are there any specific market keywords associated with the report?
Yes, the market keyword associated with the report is "Mobile Accelerator Industry," which aids in identifying and referencing the specific market segment covered.
12. How do I determine which pricing option suits my needs best?
The pricing options vary based on user requirements and access needs. Individual users may opt for single-user licenses, while businesses requiring broader access may choose multi-user or enterprise licenses for cost-effective access to the report.
13. Are there any additional resources or data provided in the Mobile Accelerator Industry report?
While the report offers comprehensive insights, it's advisable to review the specific contents or supplementary materials provided to ascertain if additional resources or data are available.
14. How can I stay updated on further developments or reports in the Mobile Accelerator Industry?
To stay informed about further developments, trends, and reports in the Mobile Accelerator Industry, consider subscribing to industry newsletters, following relevant companies and organizations, or regularly checking reputable industry news sources and publications.
Methodology
Step 1 - Identification of Relevant Samples Size from Population Database


Step 2 - Approaches for Defining Global Market Size (Value, Volume* & Price*)

Note*: In applicable scenarios
Step 3 - Data Sources
Primary Research
- Web Analytics
- Survey Reports
- Research Institute
- Latest Research Reports
- Opinion Leaders
Secondary Research
- Annual Reports
- White Paper
- Latest Press Release
- Industry Association
- Paid Database
- Investor Presentations

Step 4 - Data Triangulation
Involves using different sources of information in order to increase the validity of a study
These sources are likely to be stakeholders in a program - participants, other researchers, program staff, other community members, and so on.
Then we put all data in single framework & apply various statistical tools to find out the dynamic on the market.
During the analysis stage, feedback from the stakeholder groups would be compared to determine areas of agreement as well as areas of divergence


