
Key Insights
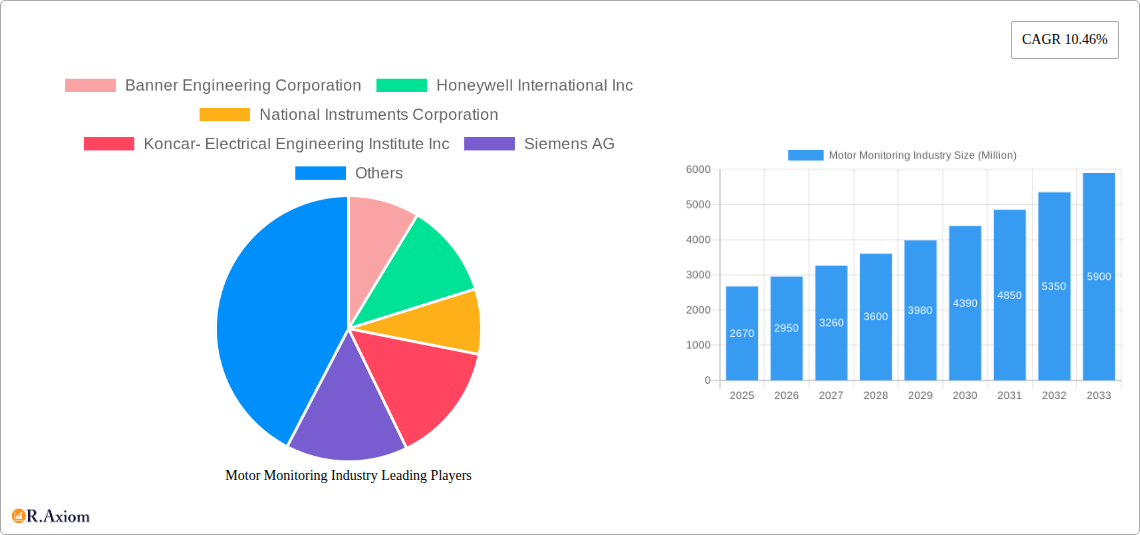
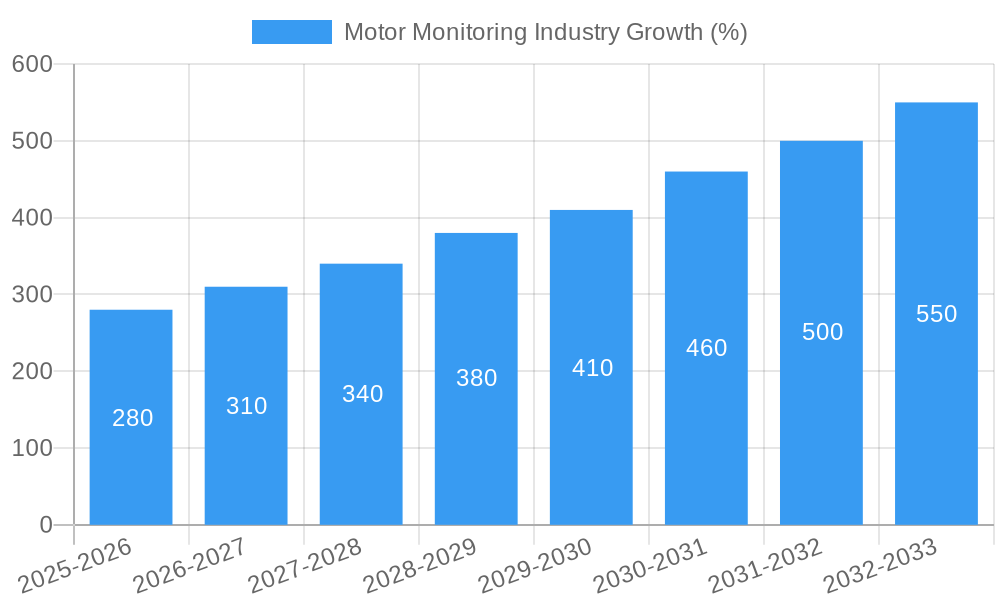
The global motor monitoring market, valued at $2.67 billion in 2025, is projected to experience robust growth, driven by increasing industrial automation, the rising demand for predictive maintenance, and stringent regulatory requirements for safety and efficiency across various sectors. The market's Compound Annual Growth Rate (CAGR) of 10.46% from 2025 to 2033 indicates significant expansion potential. Key drivers include the growing adoption of Industry 4.0 technologies, the need to minimize downtime and optimize operational efficiency, and the increasing availability of sophisticated, cost-effective monitoring solutions. The market is segmented by offering (hardware and software), deployment (cloud and on-premise), and end-user industries, with significant contributions from automotive, oil & gas, energy & power, and manufacturing sectors. The preference for cloud-based solutions is expected to increase due to their scalability, accessibility, and reduced infrastructure costs. However, challenges such as high initial investment costs for advanced systems, cybersecurity concerns, and the need for skilled personnel to implement and manage these systems could act as potential restraints on market growth.
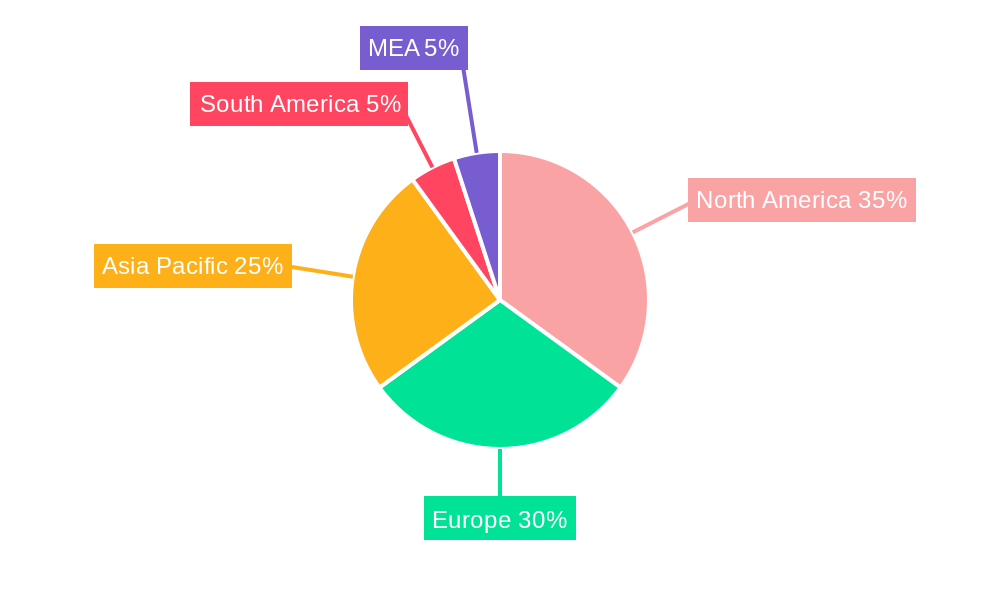
The competitive landscape is marked by the presence of both established players and emerging technology providers, including Banner Engineering, Honeywell, National Instruments, Siemens, ABB, and others. These companies are focusing on innovation, partnerships, and strategic acquisitions to gain a competitive edge. Regional growth is expected to vary, with North America and Europe maintaining strong positions due to advanced infrastructure and technological adoption. However, the Asia-Pacific region is anticipated to witness significant growth due to rapid industrialization and increasing investments in smart manufacturing. The continued expansion of the renewable energy sector and electric vehicle manufacturing will further fuel market demand. The forecast period of 2025-2033 offers promising prospects for growth, with continuous technological advancements and expanding applications further shaping the future of the motor monitoring market.
Motor Monitoring Industry Market Report: 2019-2033
This comprehensive report provides an in-depth analysis of the global motor monitoring industry, covering market size, segmentation, growth drivers, challenges, and key players. The study period spans from 2019 to 2033, with 2025 serving as the base and estimated year. The forecast period extends from 2025 to 2033, while the historical period covers 2019-2024. This report is essential for industry stakeholders, investors, and anyone seeking to understand the dynamics of this rapidly evolving market. The report projects a market value of $XX Million by 2033, exhibiting a CAGR of XX% during the forecast period.
Motor Monitoring Industry Market Concentration & Innovation
The motor monitoring industry is characterized by a moderately concentrated market structure, with several large multinational companies holding significant market share. Key players such as Honeywell International Inc, Siemens AG, and ABB Group compete intensely, driving innovation and technological advancements. The market share of these top 5 players is estimated at approximately 60% in 2025. Recent M&A activity has been relatively subdued, with deal values totaling approximately $XX Million in the past two years, primarily focused on smaller technology acquisitions to enhance product portfolios and capabilities.
- Market Concentration: High, with top 5 players holding approximately 60% market share (2025).
- Innovation Drivers: Demand for predictive maintenance, increasing automation in various industries, and stringent regulations for safety and efficiency.
- Regulatory Frameworks: Vary by region and industry, influencing product development and adoption. Compliance with safety standards (e.g., IEC 61850) is a significant factor.
- Product Substitutes: Limited, with alternatives primarily focused on simpler, less sophisticated monitoring solutions that lack advanced analytics capabilities.
- End-User Trends: Growing adoption of IoT-based solutions, cloud-based data analytics, and demand for remote monitoring capabilities.
- M&A Activities: Relatively low in recent years, with deal values totaling approximately $XX Million in the last two years.
Motor Monitoring Industry Industry Trends & Insights
The motor monitoring industry is experiencing robust growth driven by the increasing adoption of Industry 4.0 technologies, the rise of predictive maintenance strategies, and stringent regulatory requirements across various sectors. The growing demand for improved operational efficiency, reduced downtime, and enhanced safety across industries, such as automotive, oil & gas, and energy & power, is further fueling this market growth. Technological disruptions, particularly the integration of AI and machine learning into motor monitoring systems, are significantly enhancing predictive capabilities and enabling proactive maintenance, reducing costs and improving equipment lifespan. Consumer preferences are shifting towards cloud-based solutions and solutions offering seamless integration with existing industrial automation systems. Competitive dynamics are marked by technological innovation, strategic partnerships, and mergers and acquisitions, driving continuous improvement in product offerings and services. The global market is expected to reach $XX Million by 2033, exhibiting a CAGR of XX% from 2025 to 2033. Market penetration remains relatively low (approximately XX% in 2025) in certain emerging markets, presenting significant growth opportunities.
Dominant Markets & Segments in Motor Monitoring Industry
The North American region currently holds the largest market share in the motor monitoring industry, driven by robust industrial automation infrastructure and a strong focus on predictive maintenance strategies. Within the segments, Hardware constitutes the largest segment, owing to the need for advanced sensors and data acquisition systems. Cloud-based deployment is witnessing rapid growth, fueled by the increasing accessibility and affordability of cloud services and the need for remote monitoring capabilities. The Automotive and Oil & Gas sectors constitute the primary end-user markets, although penetration is increasing across other end-user segments.
- Key Drivers in North America: Strong industrial base, early adoption of Industry 4.0 technologies, favorable government policies supporting industrial automation and energy efficiency.
- Hardware Dominance: High demand for advanced sensors, data acquisition units, and control systems.
- Cloud Deployment Growth: Driven by scalability, cost-effectiveness, and remote accessibility of data.
- Automotive & Oil & Gas End-User: High value equipment, critical need for uptime maximization, and significant investment in advanced monitoring technologies.
Motor Monitoring Industry Product Developments
Recent product innovations are characterized by the integration of advanced analytics, AI, and machine learning algorithms into motor monitoring systems. This enables more accurate predictive maintenance, allowing for proactive intervention before equipment failure. Cloud connectivity and seamless integration with industrial IoT platforms enhance data accessibility and facilitate remote monitoring and control. This focus on predictive maintenance, rather than reactive maintenance, presents a significant competitive advantage, leading to cost savings and reduced downtime for end-users.
Report Scope & Segmentation Analysis
This report segments the motor monitoring market by offering (Hardware and Software), deployment (Cloud and On-Premise), and end-user (Automotive, Oil & Gas, Energy & Power, Mining, Food & Beverage, Chemicals, Aerospace & Defense, and Other End-Users). Each segment's market size, growth projections, and competitive dynamics are analyzed individually. For example, the Hardware segment is expected to witness robust growth due to the increasing demand for sophisticated sensors and data acquisition systems, while the cloud-based deployment segment is expected to experience the highest CAGR due to the advantages it offers in terms of scalability, flexibility, and cost-effectiveness. Detailed competitive landscapes for each segment are included.
Key Drivers of Motor Monitoring Industry Growth
Several factors contribute to the growth of the motor monitoring industry. Firstly, the increasing adoption of predictive maintenance strategies across various sectors helps optimize operational efficiency and reduces downtime. Secondly, stringent regulatory requirements for equipment safety and environmental compliance incentivize the adoption of sophisticated monitoring systems. Thirdly, technological advancements, such as AI and machine learning integration, enhance the accuracy and effectiveness of monitoring solutions. Finally, the rising connectivity of industrial equipment through IoT facilitates data-driven insights and remote monitoring capabilities.
Challenges in the Motor Monitoring Industry Sector
Despite the promising growth prospects, the motor monitoring industry faces several challenges. High initial investment costs for advanced monitoring systems can be a barrier to entry for smaller businesses. Integration complexities arising from diverse industrial systems and protocols can hinder seamless data acquisition and analysis. Furthermore, cybersecurity concerns related to data breaches and unauthorized access to sensitive industrial data pose a significant risk. The fluctuating prices of raw materials used in the manufacturing of hardware components also impact the overall profitability of the industry.
Emerging Opportunities in Motor Monitoring Industry
The motor monitoring industry offers several promising opportunities. The expanding adoption of Industry 4.0 technologies and the increasing focus on digital transformation provide fertile ground for innovation and growth. The rising penetration of motor monitoring systems in emerging economies presents a significant growth potential. The development of advanced analytics and AI-driven predictive maintenance solutions offers scope for improvement and differentiation. Finally, the rising adoption of sustainable practices in manufacturing and operations creates opportunities for eco-friendly motor monitoring solutions.
Leading Players in the Motor Monitoring Industry Market
- Banner Engineering Corporation
- Honeywell International Inc
- National Instruments Corporation
- Koncar- Electrical Engineering Institute Inc
- Siemens AG
- SKF Group (Baker Instrument Company)
- Dynapar Corporation
- ABB Group
- General Electric Company
- Iris Power LP
Key Developments in Motor Monitoring Industry Industry
- March 2023: Honeywell introduced its Versatilis Transmitters for condition-based monitoring of rotating equipment, improving availability, safety, and reliability.
- June 2023: Macnica, Inc. launched the Mpression Smart Motor Sensor, applicable to predictive maintenance and industrial automation across various industries.
Strategic Outlook for Motor Monitoring Industry Market
The future of the motor monitoring industry looks promising, driven by the continued adoption of advanced technologies, increased focus on predictive maintenance, and stringent regulatory mandates. The market is poised for significant growth, particularly in emerging economies and sectors experiencing rapid industrialization. Companies investing in R&D and strategic partnerships will be well-positioned to capitalize on the emerging opportunities and lead the market's evolution.
Motor Monitoring Industry Segmentation
-
1. Offering
- 1.1. Hardware
- 1.2. Software
-
2. Deployment
- 2.1. Cloud
- 2.2. On-Premise
-
3. End-User
- 3.1. Automotive
- 3.2. Oil & Gas
- 3.3. Energy & Power
- 3.4. Mining
- 3.5. Food & Beverage
- 3.6. Chemicals
- 3.7. Aerospace & Defense
- 3.8. Other End-Users
Motor Monitoring Industry Segmentation By Geography
-
1. North America
- 1.1. United States
- 1.2. Canada
-
2. Europe
- 2.1. Germany
- 2.2. United Kingdom
- 2.3. France
- 2.4. Rest of Europe
-
3. Asia Pacific
- 3.1. India
- 3.2. China
- 3.3. Japan
- 3.4. Rest of Asia Pacific
-
4. Rest of the World
- 4.1. Latin America
- 4.2. Middle East and Africa
Motor Monitoring Industry REPORT HIGHLIGHTS
| Aspects | Details |
|---|---|
| Study Period | 2019-2033 |
| Base Year | 2024 |
| Estimated Year | 2025 |
| Forecast Period | 2025-2033 |
| Historical Period | 2019-2024 |
| Growth Rate | CAGR of 10.46% from 2019-2033 |
| Segmentation |
|
Table of Contents
- 1. Introduction
- 1.1. Research Scope
- 1.2. Market Segmentation
- 1.3. Research Methodology
- 1.4. Definitions and Assumptions
- 2. Executive Summary
- 2.1. Introduction
- 3. Market Dynamics
- 3.1. Introduction
- 3.2. Market Drivers
- 3.2.1. Growing Awareness Toward Predictive Maintenance and Augmenting it With Analytics; Growing Adoption of Wireless Systems for Motor Monitoring
- 3.3. Market Restrains
- 3.3.1. Lack of Customization and High Initial Investment
- 3.4. Market Trends
- 3.4.1. Oil and Gas Segment is Anticipated to Witness Significant Growth
- 4. Market Factor Analysis
- 4.1. Porters Five Forces
- 4.2. Supply/Value Chain
- 4.3. PESTEL analysis
- 4.4. Market Entropy
- 4.5. Patent/Trademark Analysis
- 5. Global Motor Monitoring Industry Analysis, Insights and Forecast, 2019-2031
- 5.1. Market Analysis, Insights and Forecast - by Offering
- 5.1.1. Hardware
- 5.1.2. Software
- 5.2. Market Analysis, Insights and Forecast - by Deployment
- 5.2.1. Cloud
- 5.2.2. On-Premise
- 5.3. Market Analysis, Insights and Forecast - by End-User
- 5.3.1. Automotive
- 5.3.2. Oil & Gas
- 5.3.3. Energy & Power
- 5.3.4. Mining
- 5.3.5. Food & Beverage
- 5.3.6. Chemicals
- 5.3.7. Aerospace & Defense
- 5.3.8. Other End-Users
- 5.4. Market Analysis, Insights and Forecast - by Region
- 5.4.1. North America
- 5.4.2. Europe
- 5.4.3. Asia Pacific
- 5.4.4. Rest of the World
- 5.1. Market Analysis, Insights and Forecast - by Offering
- 6. North America Motor Monitoring Industry Analysis, Insights and Forecast, 2019-2031
- 6.1. Market Analysis, Insights and Forecast - by Offering
- 6.1.1. Hardware
- 6.1.2. Software
- 6.2. Market Analysis, Insights and Forecast - by Deployment
- 6.2.1. Cloud
- 6.2.2. On-Premise
- 6.3. Market Analysis, Insights and Forecast - by End-User
- 6.3.1. Automotive
- 6.3.2. Oil & Gas
- 6.3.3. Energy & Power
- 6.3.4. Mining
- 6.3.5. Food & Beverage
- 6.3.6. Chemicals
- 6.3.7. Aerospace & Defense
- 6.3.8. Other End-Users
- 6.1. Market Analysis, Insights and Forecast - by Offering
- 7. Europe Motor Monitoring Industry Analysis, Insights and Forecast, 2019-2031
- 7.1. Market Analysis, Insights and Forecast - by Offering
- 7.1.1. Hardware
- 7.1.2. Software
- 7.2. Market Analysis, Insights and Forecast - by Deployment
- 7.2.1. Cloud
- 7.2.2. On-Premise
- 7.3. Market Analysis, Insights and Forecast - by End-User
- 7.3.1. Automotive
- 7.3.2. Oil & Gas
- 7.3.3. Energy & Power
- 7.3.4. Mining
- 7.3.5. Food & Beverage
- 7.3.6. Chemicals
- 7.3.7. Aerospace & Defense
- 7.3.8. Other End-Users
- 7.1. Market Analysis, Insights and Forecast - by Offering
- 8. Asia Pacific Motor Monitoring Industry Analysis, Insights and Forecast, 2019-2031
- 8.1. Market Analysis, Insights and Forecast - by Offering
- 8.1.1. Hardware
- 8.1.2. Software
- 8.2. Market Analysis, Insights and Forecast - by Deployment
- 8.2.1. Cloud
- 8.2.2. On-Premise
- 8.3. Market Analysis, Insights and Forecast - by End-User
- 8.3.1. Automotive
- 8.3.2. Oil & Gas
- 8.3.3. Energy & Power
- 8.3.4. Mining
- 8.3.5. Food & Beverage
- 8.3.6. Chemicals
- 8.3.7. Aerospace & Defense
- 8.3.8. Other End-Users
- 8.1. Market Analysis, Insights and Forecast - by Offering
- 9. Rest of the World Motor Monitoring Industry Analysis, Insights and Forecast, 2019-2031
- 9.1. Market Analysis, Insights and Forecast - by Offering
- 9.1.1. Hardware
- 9.1.2. Software
- 9.2. Market Analysis, Insights and Forecast - by Deployment
- 9.2.1. Cloud
- 9.2.2. On-Premise
- 9.3. Market Analysis, Insights and Forecast - by End-User
- 9.3.1. Automotive
- 9.3.2. Oil & Gas
- 9.3.3. Energy & Power
- 9.3.4. Mining
- 9.3.5. Food & Beverage
- 9.3.6. Chemicals
- 9.3.7. Aerospace & Defense
- 9.3.8. Other End-Users
- 9.1. Market Analysis, Insights and Forecast - by Offering
- 10. North America Motor Monitoring Industry Analysis, Insights and Forecast, 2019-2031
- 10.1. Market Analysis, Insights and Forecast - By Country/Sub-region
- 10.1.1. undefined
- 11. Europe Motor Monitoring Industry Analysis, Insights and Forecast, 2019-2031
- 11.1. Market Analysis, Insights and Forecast - By Country/Sub-region
- 11.1.1. undefined
- 12. Asia Pacific Motor Monitoring Industry Analysis, Insights and Forecast, 2019-2031
- 12.1. Market Analysis, Insights and Forecast - By Country/Sub-region
- 12.1.1. undefined
- 13. South America Motor Monitoring Industry Analysis, Insights and Forecast, 2019-2031
- 13.1. Market Analysis, Insights and Forecast - By Country/Sub-region
- 13.1.1. undefined
- 14. North America Motor Monitoring Industry Analysis, Insights and Forecast, 2019-2031
- 14.1. Market Analysis, Insights and Forecast - By Country/Sub-region
- 14.1.1. undefined
- 15. MEA Motor Monitoring Industry Analysis, Insights and Forecast, 2019-2031
- 15.1. Market Analysis, Insights and Forecast - By Country/Sub-region
- 15.1.1. undefined
- 16. Competitive Analysis
- 16.1. Global Market Share Analysis 2024
- 16.2. Company Profiles
- 16.2.1 Banner Engineering Corporation
- 16.2.1.1. Overview
- 16.2.1.2. Products
- 16.2.1.3. SWOT Analysis
- 16.2.1.4. Recent Developments
- 16.2.1.5. Financials (Based on Availability)
- 16.2.2 Honeywell International Inc
- 16.2.2.1. Overview
- 16.2.2.2. Products
- 16.2.2.3. SWOT Analysis
- 16.2.2.4. Recent Developments
- 16.2.2.5. Financials (Based on Availability)
- 16.2.3 National Instruments Corporation
- 16.2.3.1. Overview
- 16.2.3.2. Products
- 16.2.3.3. SWOT Analysis
- 16.2.3.4. Recent Developments
- 16.2.3.5. Financials (Based on Availability)
- 16.2.4 Koncar- Electrical Engineering Institute Inc
- 16.2.4.1. Overview
- 16.2.4.2. Products
- 16.2.4.3. SWOT Analysis
- 16.2.4.4. Recent Developments
- 16.2.4.5. Financials (Based on Availability)
- 16.2.5 Siemens AG
- 16.2.5.1. Overview
- 16.2.5.2. Products
- 16.2.5.3. SWOT Analysis
- 16.2.5.4. Recent Developments
- 16.2.5.5. Financials (Based on Availability)
- 16.2.6 SKF Group (Baker Instrument Company)
- 16.2.6.1. Overview
- 16.2.6.2. Products
- 16.2.6.3. SWOT Analysis
- 16.2.6.4. Recent Developments
- 16.2.6.5. Financials (Based on Availability)
- 16.2.7 Dynapar Corporation
- 16.2.7.1. Overview
- 16.2.7.2. Products
- 16.2.7.3. SWOT Analysis
- 16.2.7.4. Recent Developments
- 16.2.7.5. Financials (Based on Availability)
- 16.2.8 ABB Group
- 16.2.8.1. Overview
- 16.2.8.2. Products
- 16.2.8.3. SWOT Analysis
- 16.2.8.4. Recent Developments
- 16.2.8.5. Financials (Based on Availability)
- 16.2.9 General Electric Company
- 16.2.9.1. Overview
- 16.2.9.2. Products
- 16.2.9.3. SWOT Analysis
- 16.2.9.4. Recent Developments
- 16.2.9.5. Financials (Based on Availability)
- 16.2.10 Iris Power LP
- 16.2.10.1. Overview
- 16.2.10.2. Products
- 16.2.10.3. SWOT Analysis
- 16.2.10.4. Recent Developments
- 16.2.10.5. Financials (Based on Availability)
- 16.2.1 Banner Engineering Corporation
List of Figures
- Figure 1: Global Motor Monitoring Industry Revenue Breakdown (Million, %) by Region 2024 & 2032
- Figure 2: Global Motor Monitoring Industry Volume Breakdown (K Unit, %) by Region 2024 & 2032
- Figure 3: North America Motor Monitoring Industry Revenue (Million), by Country 2024 & 2032
- Figure 4: North America Motor Monitoring Industry Volume (K Unit), by Country 2024 & 2032
- Figure 5: North America Motor Monitoring Industry Revenue Share (%), by Country 2024 & 2032
- Figure 6: North America Motor Monitoring Industry Volume Share (%), by Country 2024 & 2032
- Figure 7: Europe Motor Monitoring Industry Revenue (Million), by Country 2024 & 2032
- Figure 8: Europe Motor Monitoring Industry Volume (K Unit), by Country 2024 & 2032
- Figure 9: Europe Motor Monitoring Industry Revenue Share (%), by Country 2024 & 2032
- Figure 10: Europe Motor Monitoring Industry Volume Share (%), by Country 2024 & 2032
- Figure 11: Asia Pacific Motor Monitoring Industry Revenue (Million), by Country 2024 & 2032
- Figure 12: Asia Pacific Motor Monitoring Industry Volume (K Unit), by Country 2024 & 2032
- Figure 13: Asia Pacific Motor Monitoring Industry Revenue Share (%), by Country 2024 & 2032
- Figure 14: Asia Pacific Motor Monitoring Industry Volume Share (%), by Country 2024 & 2032
- Figure 15: South America Motor Monitoring Industry Revenue (Million), by Country 2024 & 2032
- Figure 16: South America Motor Monitoring Industry Volume (K Unit), by Country 2024 & 2032
- Figure 17: South America Motor Monitoring Industry Revenue Share (%), by Country 2024 & 2032
- Figure 18: South America Motor Monitoring Industry Volume Share (%), by Country 2024 & 2032
- Figure 19: North America Motor Monitoring Industry Revenue (Million), by Country 2024 & 2032
- Figure 20: North America Motor Monitoring Industry Volume (K Unit), by Country 2024 & 2032
- Figure 21: North America Motor Monitoring Industry Revenue Share (%), by Country 2024 & 2032
- Figure 22: North America Motor Monitoring Industry Volume Share (%), by Country 2024 & 2032
- Figure 23: MEA Motor Monitoring Industry Revenue (Million), by Country 2024 & 2032
- Figure 24: MEA Motor Monitoring Industry Volume (K Unit), by Country 2024 & 2032
- Figure 25: MEA Motor Monitoring Industry Revenue Share (%), by Country 2024 & 2032
- Figure 26: MEA Motor Monitoring Industry Volume Share (%), by Country 2024 & 2032
- Figure 27: North America Motor Monitoring Industry Revenue (Million), by Offering 2024 & 2032
- Figure 28: North America Motor Monitoring Industry Volume (K Unit), by Offering 2024 & 2032
- Figure 29: North America Motor Monitoring Industry Revenue Share (%), by Offering 2024 & 2032
- Figure 30: North America Motor Monitoring Industry Volume Share (%), by Offering 2024 & 2032
- Figure 31: North America Motor Monitoring Industry Revenue (Million), by Deployment 2024 & 2032
- Figure 32: North America Motor Monitoring Industry Volume (K Unit), by Deployment 2024 & 2032
- Figure 33: North America Motor Monitoring Industry Revenue Share (%), by Deployment 2024 & 2032
- Figure 34: North America Motor Monitoring Industry Volume Share (%), by Deployment 2024 & 2032
- Figure 35: North America Motor Monitoring Industry Revenue (Million), by End-User 2024 & 2032
- Figure 36: North America Motor Monitoring Industry Volume (K Unit), by End-User 2024 & 2032
- Figure 37: North America Motor Monitoring Industry Revenue Share (%), by End-User 2024 & 2032
- Figure 38: North America Motor Monitoring Industry Volume Share (%), by End-User 2024 & 2032
- Figure 39: North America Motor Monitoring Industry Revenue (Million), by Country 2024 & 2032
- Figure 40: North America Motor Monitoring Industry Volume (K Unit), by Country 2024 & 2032
- Figure 41: North America Motor Monitoring Industry Revenue Share (%), by Country 2024 & 2032
- Figure 42: North America Motor Monitoring Industry Volume Share (%), by Country 2024 & 2032
- Figure 43: Europe Motor Monitoring Industry Revenue (Million), by Offering 2024 & 2032
- Figure 44: Europe Motor Monitoring Industry Volume (K Unit), by Offering 2024 & 2032
- Figure 45: Europe Motor Monitoring Industry Revenue Share (%), by Offering 2024 & 2032
- Figure 46: Europe Motor Monitoring Industry Volume Share (%), by Offering 2024 & 2032
- Figure 47: Europe Motor Monitoring Industry Revenue (Million), by Deployment 2024 & 2032
- Figure 48: Europe Motor Monitoring Industry Volume (K Unit), by Deployment 2024 & 2032
- Figure 49: Europe Motor Monitoring Industry Revenue Share (%), by Deployment 2024 & 2032
- Figure 50: Europe Motor Monitoring Industry Volume Share (%), by Deployment 2024 & 2032
- Figure 51: Europe Motor Monitoring Industry Revenue (Million), by End-User 2024 & 2032
- Figure 52: Europe Motor Monitoring Industry Volume (K Unit), by End-User 2024 & 2032
- Figure 53: Europe Motor Monitoring Industry Revenue Share (%), by End-User 2024 & 2032
- Figure 54: Europe Motor Monitoring Industry Volume Share (%), by End-User 2024 & 2032
- Figure 55: Europe Motor Monitoring Industry Revenue (Million), by Country 2024 & 2032
- Figure 56: Europe Motor Monitoring Industry Volume (K Unit), by Country 2024 & 2032
- Figure 57: Europe Motor Monitoring Industry Revenue Share (%), by Country 2024 & 2032
- Figure 58: Europe Motor Monitoring Industry Volume Share (%), by Country 2024 & 2032
- Figure 59: Asia Pacific Motor Monitoring Industry Revenue (Million), by Offering 2024 & 2032
- Figure 60: Asia Pacific Motor Monitoring Industry Volume (K Unit), by Offering 2024 & 2032
- Figure 61: Asia Pacific Motor Monitoring Industry Revenue Share (%), by Offering 2024 & 2032
- Figure 62: Asia Pacific Motor Monitoring Industry Volume Share (%), by Offering 2024 & 2032
- Figure 63: Asia Pacific Motor Monitoring Industry Revenue (Million), by Deployment 2024 & 2032
- Figure 64: Asia Pacific Motor Monitoring Industry Volume (K Unit), by Deployment 2024 & 2032
- Figure 65: Asia Pacific Motor Monitoring Industry Revenue Share (%), by Deployment 2024 & 2032
- Figure 66: Asia Pacific Motor Monitoring Industry Volume Share (%), by Deployment 2024 & 2032
- Figure 67: Asia Pacific Motor Monitoring Industry Revenue (Million), by End-User 2024 & 2032
- Figure 68: Asia Pacific Motor Monitoring Industry Volume (K Unit), by End-User 2024 & 2032
- Figure 69: Asia Pacific Motor Monitoring Industry Revenue Share (%), by End-User 2024 & 2032
- Figure 70: Asia Pacific Motor Monitoring Industry Volume Share (%), by End-User 2024 & 2032
- Figure 71: Asia Pacific Motor Monitoring Industry Revenue (Million), by Country 2024 & 2032
- Figure 72: Asia Pacific Motor Monitoring Industry Volume (K Unit), by Country 2024 & 2032
- Figure 73: Asia Pacific Motor Monitoring Industry Revenue Share (%), by Country 2024 & 2032
- Figure 74: Asia Pacific Motor Monitoring Industry Volume Share (%), by Country 2024 & 2032
- Figure 75: Rest of the World Motor Monitoring Industry Revenue (Million), by Offering 2024 & 2032
- Figure 76: Rest of the World Motor Monitoring Industry Volume (K Unit), by Offering 2024 & 2032
- Figure 77: Rest of the World Motor Monitoring Industry Revenue Share (%), by Offering 2024 & 2032
- Figure 78: Rest of the World Motor Monitoring Industry Volume Share (%), by Offering 2024 & 2032
- Figure 79: Rest of the World Motor Monitoring Industry Revenue (Million), by Deployment 2024 & 2032
- Figure 80: Rest of the World Motor Monitoring Industry Volume (K Unit), by Deployment 2024 & 2032
- Figure 81: Rest of the World Motor Monitoring Industry Revenue Share (%), by Deployment 2024 & 2032
- Figure 82: Rest of the World Motor Monitoring Industry Volume Share (%), by Deployment 2024 & 2032
- Figure 83: Rest of the World Motor Monitoring Industry Revenue (Million), by End-User 2024 & 2032
- Figure 84: Rest of the World Motor Monitoring Industry Volume (K Unit), by End-User 2024 & 2032
- Figure 85: Rest of the World Motor Monitoring Industry Revenue Share (%), by End-User 2024 & 2032
- Figure 86: Rest of the World Motor Monitoring Industry Volume Share (%), by End-User 2024 & 2032
- Figure 87: Rest of the World Motor Monitoring Industry Revenue (Million), by Country 2024 & 2032
- Figure 88: Rest of the World Motor Monitoring Industry Volume (K Unit), by Country 2024 & 2032
- Figure 89: Rest of the World Motor Monitoring Industry Revenue Share (%), by Country 2024 & 2032
- Figure 90: Rest of the World Motor Monitoring Industry Volume Share (%), by Country 2024 & 2032
List of Tables
- Table 1: Global Motor Monitoring Industry Revenue Million Forecast, by Region 2019 & 2032
- Table 2: Global Motor Monitoring Industry Volume K Unit Forecast, by Region 2019 & 2032
- Table 3: Global Motor Monitoring Industry Revenue Million Forecast, by Offering 2019 & 2032
- Table 4: Global Motor Monitoring Industry Volume K Unit Forecast, by Offering 2019 & 2032
- Table 5: Global Motor Monitoring Industry Revenue Million Forecast, by Deployment 2019 & 2032
- Table 6: Global Motor Monitoring Industry Volume K Unit Forecast, by Deployment 2019 & 2032
- Table 7: Global Motor Monitoring Industry Revenue Million Forecast, by End-User 2019 & 2032
- Table 8: Global Motor Monitoring Industry Volume K Unit Forecast, by End-User 2019 & 2032
- Table 9: Global Motor Monitoring Industry Revenue Million Forecast, by Region 2019 & 2032
- Table 10: Global Motor Monitoring Industry Volume K Unit Forecast, by Region 2019 & 2032
- Table 11: Global Motor Monitoring Industry Revenue Million Forecast, by Country 2019 & 2032
- Table 12: Global Motor Monitoring Industry Volume K Unit Forecast, by Country 2019 & 2032
- Table 13: Global Motor Monitoring Industry Revenue Million Forecast, by Country 2019 & 2032
- Table 14: Global Motor Monitoring Industry Volume K Unit Forecast, by Country 2019 & 2032
- Table 15: Global Motor Monitoring Industry Revenue Million Forecast, by Country 2019 & 2032
- Table 16: Global Motor Monitoring Industry Volume K Unit Forecast, by Country 2019 & 2032
- Table 17: Global Motor Monitoring Industry Revenue Million Forecast, by Country 2019 & 2032
- Table 18: Global Motor Monitoring Industry Volume K Unit Forecast, by Country 2019 & 2032
- Table 19: Global Motor Monitoring Industry Revenue Million Forecast, by Country 2019 & 2032
- Table 20: Global Motor Monitoring Industry Volume K Unit Forecast, by Country 2019 & 2032
- Table 21: Global Motor Monitoring Industry Revenue Million Forecast, by Country 2019 & 2032
- Table 22: Global Motor Monitoring Industry Volume K Unit Forecast, by Country 2019 & 2032
- Table 23: Global Motor Monitoring Industry Revenue Million Forecast, by Offering 2019 & 2032
- Table 24: Global Motor Monitoring Industry Volume K Unit Forecast, by Offering 2019 & 2032
- Table 25: Global Motor Monitoring Industry Revenue Million Forecast, by Deployment 2019 & 2032
- Table 26: Global Motor Monitoring Industry Volume K Unit Forecast, by Deployment 2019 & 2032
- Table 27: Global Motor Monitoring Industry Revenue Million Forecast, by End-User 2019 & 2032
- Table 28: Global Motor Monitoring Industry Volume K Unit Forecast, by End-User 2019 & 2032
- Table 29: Global Motor Monitoring Industry Revenue Million Forecast, by Country 2019 & 2032
- Table 30: Global Motor Monitoring Industry Volume K Unit Forecast, by Country 2019 & 2032
- Table 31: United States Motor Monitoring Industry Revenue (Million) Forecast, by Application 2019 & 2032
- Table 32: United States Motor Monitoring Industry Volume (K Unit) Forecast, by Application 2019 & 2032
- Table 33: Canada Motor Monitoring Industry Revenue (Million) Forecast, by Application 2019 & 2032
- Table 34: Canada Motor Monitoring Industry Volume (K Unit) Forecast, by Application 2019 & 2032
- Table 35: Global Motor Monitoring Industry Revenue Million Forecast, by Offering 2019 & 2032
- Table 36: Global Motor Monitoring Industry Volume K Unit Forecast, by Offering 2019 & 2032
- Table 37: Global Motor Monitoring Industry Revenue Million Forecast, by Deployment 2019 & 2032
- Table 38: Global Motor Monitoring Industry Volume K Unit Forecast, by Deployment 2019 & 2032
- Table 39: Global Motor Monitoring Industry Revenue Million Forecast, by End-User 2019 & 2032
- Table 40: Global Motor Monitoring Industry Volume K Unit Forecast, by End-User 2019 & 2032
- Table 41: Global Motor Monitoring Industry Revenue Million Forecast, by Country 2019 & 2032
- Table 42: Global Motor Monitoring Industry Volume K Unit Forecast, by Country 2019 & 2032
- Table 43: Germany Motor Monitoring Industry Revenue (Million) Forecast, by Application 2019 & 2032
- Table 44: Germany Motor Monitoring Industry Volume (K Unit) Forecast, by Application 2019 & 2032
- Table 45: United Kingdom Motor Monitoring Industry Revenue (Million) Forecast, by Application 2019 & 2032
- Table 46: United Kingdom Motor Monitoring Industry Volume (K Unit) Forecast, by Application 2019 & 2032
- Table 47: France Motor Monitoring Industry Revenue (Million) Forecast, by Application 2019 & 2032
- Table 48: France Motor Monitoring Industry Volume (K Unit) Forecast, by Application 2019 & 2032
- Table 49: Rest of Europe Motor Monitoring Industry Revenue (Million) Forecast, by Application 2019 & 2032
- Table 50: Rest of Europe Motor Monitoring Industry Volume (K Unit) Forecast, by Application 2019 & 2032
- Table 51: Global Motor Monitoring Industry Revenue Million Forecast, by Offering 2019 & 2032
- Table 52: Global Motor Monitoring Industry Volume K Unit Forecast, by Offering 2019 & 2032
- Table 53: Global Motor Monitoring Industry Revenue Million Forecast, by Deployment 2019 & 2032
- Table 54: Global Motor Monitoring Industry Volume K Unit Forecast, by Deployment 2019 & 2032
- Table 55: Global Motor Monitoring Industry Revenue Million Forecast, by End-User 2019 & 2032
- Table 56: Global Motor Monitoring Industry Volume K Unit Forecast, by End-User 2019 & 2032
- Table 57: Global Motor Monitoring Industry Revenue Million Forecast, by Country 2019 & 2032
- Table 58: Global Motor Monitoring Industry Volume K Unit Forecast, by Country 2019 & 2032
- Table 59: India Motor Monitoring Industry Revenue (Million) Forecast, by Application 2019 & 2032
- Table 60: India Motor Monitoring Industry Volume (K Unit) Forecast, by Application 2019 & 2032
- Table 61: China Motor Monitoring Industry Revenue (Million) Forecast, by Application 2019 & 2032
- Table 62: China Motor Monitoring Industry Volume (K Unit) Forecast, by Application 2019 & 2032
- Table 63: Japan Motor Monitoring Industry Revenue (Million) Forecast, by Application 2019 & 2032
- Table 64: Japan Motor Monitoring Industry Volume (K Unit) Forecast, by Application 2019 & 2032
- Table 65: Rest of Asia Pacific Motor Monitoring Industry Revenue (Million) Forecast, by Application 2019 & 2032
- Table 66: Rest of Asia Pacific Motor Monitoring Industry Volume (K Unit) Forecast, by Application 2019 & 2032
- Table 67: Global Motor Monitoring Industry Revenue Million Forecast, by Offering 2019 & 2032
- Table 68: Global Motor Monitoring Industry Volume K Unit Forecast, by Offering 2019 & 2032
- Table 69: Global Motor Monitoring Industry Revenue Million Forecast, by Deployment 2019 & 2032
- Table 70: Global Motor Monitoring Industry Volume K Unit Forecast, by Deployment 2019 & 2032
- Table 71: Global Motor Monitoring Industry Revenue Million Forecast, by End-User 2019 & 2032
- Table 72: Global Motor Monitoring Industry Volume K Unit Forecast, by End-User 2019 & 2032
- Table 73: Global Motor Monitoring Industry Revenue Million Forecast, by Country 2019 & 2032
- Table 74: Global Motor Monitoring Industry Volume K Unit Forecast, by Country 2019 & 2032
- Table 75: Latin America Motor Monitoring Industry Revenue (Million) Forecast, by Application 2019 & 2032
- Table 76: Latin America Motor Monitoring Industry Volume (K Unit) Forecast, by Application 2019 & 2032
- Table 77: Middle East and Africa Motor Monitoring Industry Revenue (Million) Forecast, by Application 2019 & 2032
- Table 78: Middle East and Africa Motor Monitoring Industry Volume (K Unit) Forecast, by Application 2019 & 2032
Frequently Asked Questions
1. What is the projected Compound Annual Growth Rate (CAGR) of the Motor Monitoring Industry?
The projected CAGR is approximately 10.46%.
2. Which companies are prominent players in the Motor Monitoring Industry?
Key companies in the market include Banner Engineering Corporation, Honeywell International Inc, National Instruments Corporation, Koncar- Electrical Engineering Institute Inc, Siemens AG, SKF Group (Baker Instrument Company), Dynapar Corporation, ABB Group, General Electric Company, Iris Power LP.
3. What are the main segments of the Motor Monitoring Industry?
The market segments include Offering, Deployment, End-User.
4. Can you provide details about the market size?
The market size is estimated to be USD 2.67 Million as of 2022.
5. What are some drivers contributing to market growth?
Growing Awareness Toward Predictive Maintenance and Augmenting it With Analytics; Growing Adoption of Wireless Systems for Motor Monitoring.
6. What are the notable trends driving market growth?
Oil and Gas Segment is Anticipated to Witness Significant Growth.
7. Are there any restraints impacting market growth?
Lack of Customization and High Initial Investment.
8. Can you provide examples of recent developments in the market?
June 2023 - Macnica, Inc. launched the Mpression Smart Motor Sensor, a solution comprising products developed by Analog Devices, Inc. in Taiwan. A Macnica, Answer Technology Co., Ltd. subsidiary sells Mpression Smart Motor Sensor in Taiwan. Mpression Smart Motor Sensor can be applied to predictive maintenance, industrial automation, and monitoring, such as pharmaceutical, food & beverage, energy, water utilities, paper, and other industries.
9. What pricing options are available for accessing the report?
Pricing options include single-user, multi-user, and enterprise licenses priced at USD 4750, USD 5250, and USD 8750 respectively.
10. Is the market size provided in terms of value or volume?
The market size is provided in terms of value, measured in Million and volume, measured in K Unit.
11. Are there any specific market keywords associated with the report?
Yes, the market keyword associated with the report is "Motor Monitoring Industry," which aids in identifying and referencing the specific market segment covered.
12. How do I determine which pricing option suits my needs best?
The pricing options vary based on user requirements and access needs. Individual users may opt for single-user licenses, while businesses requiring broader access may choose multi-user or enterprise licenses for cost-effective access to the report.
13. Are there any additional resources or data provided in the Motor Monitoring Industry report?
While the report offers comprehensive insights, it's advisable to review the specific contents or supplementary materials provided to ascertain if additional resources or data are available.
14. How can I stay updated on further developments or reports in the Motor Monitoring Industry?
To stay informed about further developments, trends, and reports in the Motor Monitoring Industry, consider subscribing to industry newsletters, following relevant companies and organizations, or regularly checking reputable industry news sources and publications.
Methodology
Step 1 - Identification of Relevant Samples Size from Population Database


Step 2 - Approaches for Defining Global Market Size (Value, Volume* & Price*)

Note*: In applicable scenarios
Step 3 - Data Sources
Primary Research
- Web Analytics
- Survey Reports
- Research Institute
- Latest Research Reports
- Opinion Leaders
Secondary Research
- Annual Reports
- White Paper
- Latest Press Release
- Industry Association
- Paid Database
- Investor Presentations

Step 4 - Data Triangulation
Involves using different sources of information in order to increase the validity of a study
These sources are likely to be stakeholders in a program - participants, other researchers, program staff, other community members, and so on.
Then we put all data in single framework & apply various statistical tools to find out the dynamic on the market.
During the analysis stage, feedback from the stakeholder groups would be compared to determine areas of agreement as well as areas of divergence


