

Key Insights
The global market for Nano Alumina for Lithium Batteries is poised for significant expansion, projected to reach USD 217 million by 2025, with a robust Compound Annual Growth Rate (CAGR) of 7.2% through 2033. This dynamic growth is primarily fueled by the escalating demand for high-performance lithium-ion batteries across various sectors, including electric vehicles (EVs), consumer electronics, and energy storage systems. The inherent properties of nano alumina, such as its superior thermal conductivity, mechanical strength, and electrochemical stability, make it an indispensable component in enhancing battery safety, longevity, and overall efficiency. Its application as a coating for lithium battery separators not only prevents internal short circuits but also improves ion transport, leading to faster charging times and increased energy density. Furthermore, its role in lithium battery anodes contributes to improved cycling stability and capacity retention. The market is witnessing increasing adoption of higher purity grades like 4N Al2O3, driven by the need for premium battery performance.
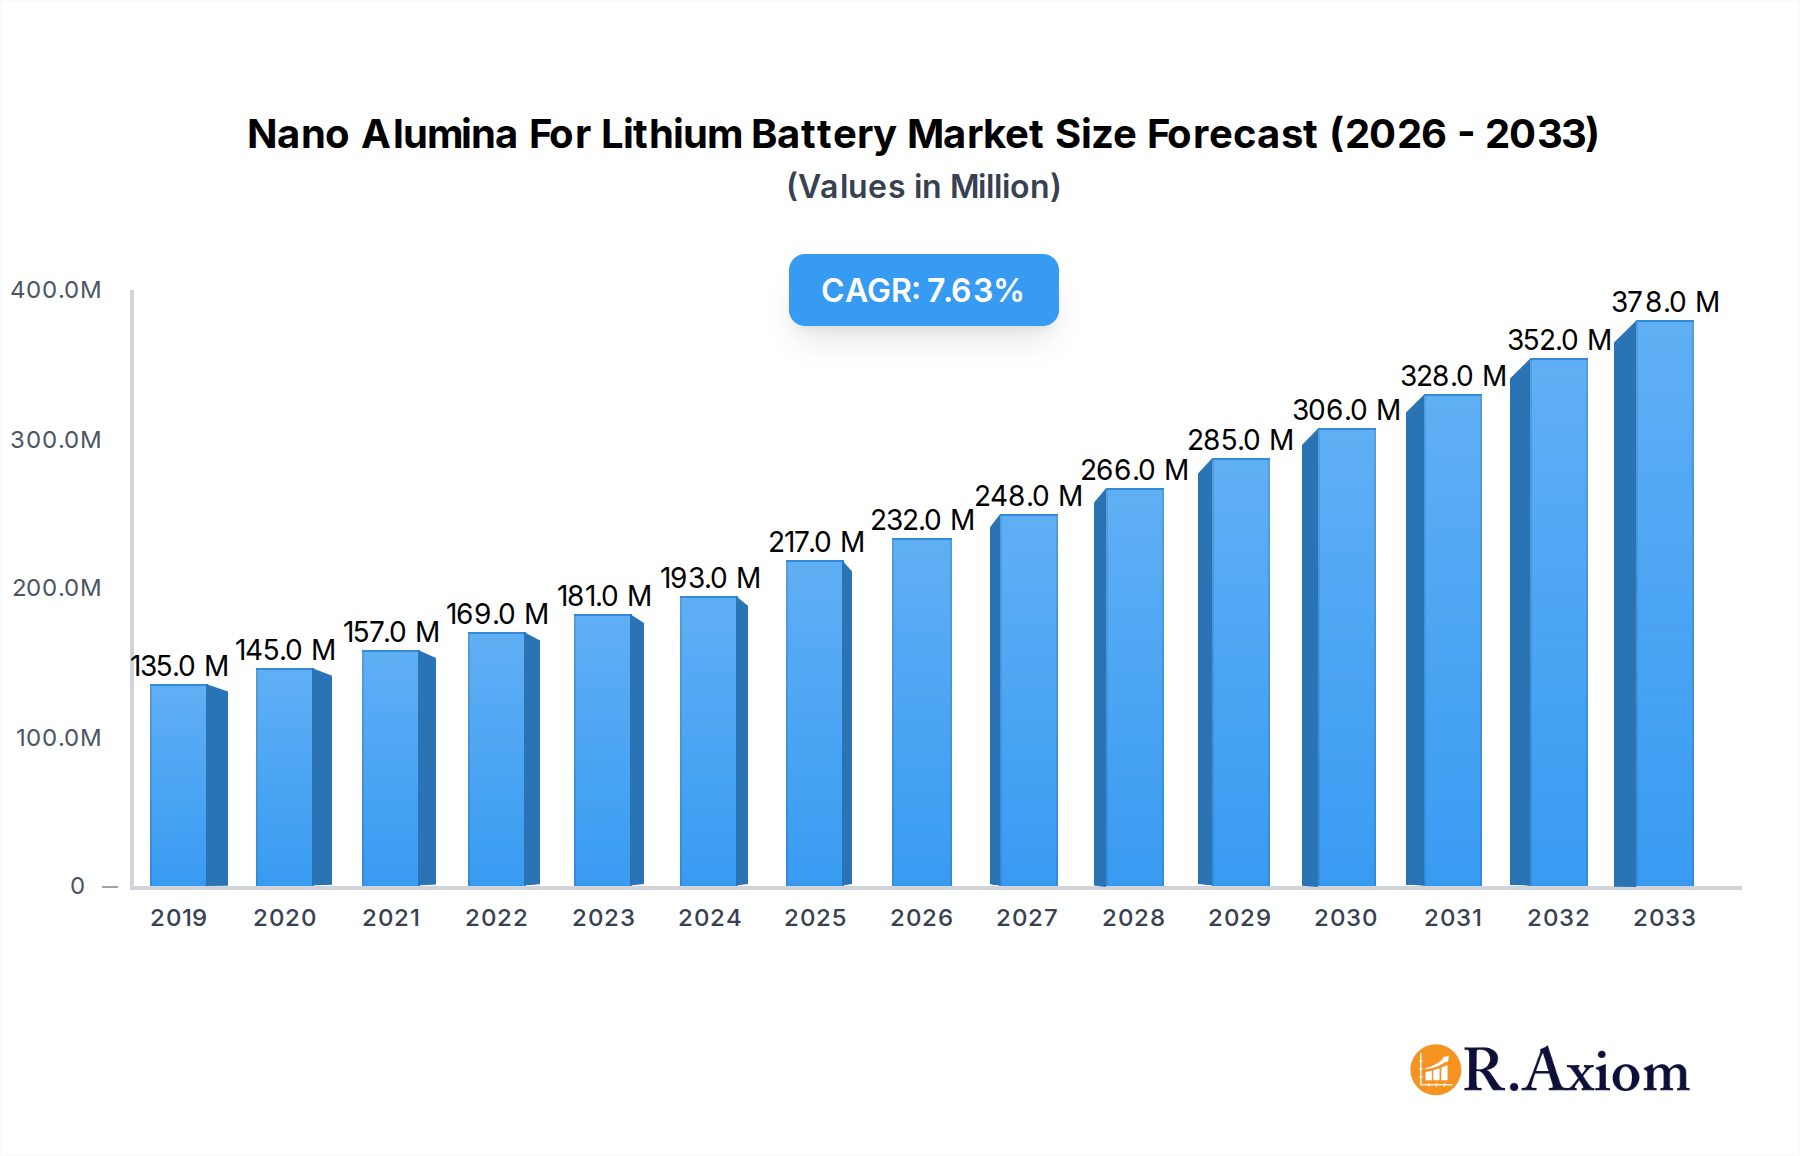
Nano Alumina For Lithium Battery Market Size (In Million)
Key drivers propelling this market forward include the rapid advancements in battery technology, stringent government regulations promoting the adoption of EVs and renewable energy sources, and the continuous innovation in material science leading to the development of more efficient nano alumina formulations. The Asia Pacific region, particularly China, is emerging as a dominant force due to its extensive manufacturing capabilities and burgeoning EV market. However, challenges such as the fluctuating raw material prices and the need for specialized manufacturing processes present some restraints. Emerging trends indicate a growing interest in eco-friendly and sustainable production methods for nano alumina. The competitive landscape features prominent players like Baikowski, Shandong Sinocera, and Shengnuo Optoelectronic Technology, all actively engaged in research and development to offer advanced solutions and capitalize on the immense market opportunities.

Nano Alumina For Lithium Battery Company Market Share
Nano Alumina For Lithium Battery Market Report: Comprehensive Analysis & Future Outlook (2019-2033)
This in-depth report provides a comprehensive analysis of the global Nano Alumina for Lithium Battery market, offering critical insights for stakeholders navigating this rapidly evolving sector. Covering the historical period (2019-2024), base year (2025), and forecast period (2025-2033), this study details market dynamics, growth drivers, emerging trends, and competitive landscapes. The report focuses on key segments including Lithium Battery Separator and Lithium Battery Anode applications, and 3N Al2O3 and 4N Al2O3 types. With an estimated market size projected to reach millions by 2025, this research is an indispensable resource for manufacturers, investors, and technology developers.
Nano Alumina For Lithium Battery Market Concentration & Innovation
The Nano Alumina for Lithium Battery market exhibits a moderate to high concentration, with a few key players holding significant market share, estimated at over millions of USD in value for leading companies. Innovation is a primary driver, fueled by the relentless demand for higher energy density, faster charging, and enhanced safety in lithium-ion batteries. Research and development efforts are focused on improving the purity, particle size distribution, and surface modification of nano alumina to optimize its performance in battery components. Regulatory frameworks, while still developing, are increasingly emphasizing safety and environmental sustainability in battery production, indirectly influencing nano alumina material specifications. Product substitutes for nano alumina in certain battery applications exist, but currently, none offer the same balance of performance, cost-effectiveness, and established integration. End-user trends, driven by the burgeoning electric vehicle (EV) and portable electronics markets, are pushing for continuous material advancements. Mergers and acquisitions (M&A) activity, with recent deals valued at tens of millions, are expected to continue as companies seek to consolidate market position, acquire new technologies, and expand their global reach within the lithium battery material sector.
Nano Alumina For Lithium Battery Industry Trends & Insights
The Nano Alumina for Lithium Battery industry is experiencing robust growth, propelled by several interconnected trends. The escalating demand for electric vehicles (EVs) is the most significant growth driver, as nano alumina plays a crucial role in enhancing the performance and safety of lithium-ion batteries powering these vehicles. This trend is further amplified by government mandates and incentives aimed at reducing carbon emissions. Technological disruptions are also shaping the market, with continuous advancements in battery chemistry and design requiring more sophisticated materials like nano alumina. The development of solid-state batteries, for instance, presents new opportunities for specialized nano alumina formulations. Consumer preferences are leaning towards longer battery life, faster charging capabilities, and improved safety, all of which nano alumina contributes to. The competitive dynamics are characterized by intense R&D investment, strategic partnerships, and a focus on cost optimization. Market penetration of nano alumina in advanced battery designs is steadily increasing, with a projected Compound Annual Growth Rate (CAGR) of approximately millions % over the forecast period. The increasing adoption of advanced battery technologies in consumer electronics, renewable energy storage, and industrial applications further solidifies the upward trajectory of the nano alumina market. The refinement of nano alumina synthesis techniques, leading to tighter particle size control and higher purity levels (e.g., 4N Al2O3), directly translates to improved electrochemical performance and cycle life in lithium batteries. Furthermore, the integration of nano alumina as a coating on battery separators enhances their thermal stability and mechanical strength, significantly reducing the risk of internal short circuits and thermal runaway, thereby boosting battery safety—a critical concern for consumers and manufacturers alike. The ongoing exploration of nano alumina for use in lithium battery anodes, aiming to improve volumetric energy density and cycling stability, represents another significant avenue for market expansion.
Dominant Markets & Segments in Nano Alumina For Lithium Battery
The Lithium Battery Separator segment currently dominates the Nano Alumina for Lithium Battery market, driven by its critical role in preventing direct contact between electrodes, thus averting short circuits. The superior thermal stability and mechanical strength imparted by nano alumina coatings on separators are paramount for enhancing battery safety and lifespan, making it indispensable for high-performance lithium-ion batteries used in EVs and energy storage systems. The 3N Al2O3 type of nano alumina is a prominent segment due to its cost-effectiveness and established performance in current separator coating technologies, with a market share estimated in the millions.
- Leading Region: Asia Pacific. This region, particularly China, South Korea, and Japan, is the epicenter of lithium-ion battery manufacturing and EV production. Robust government support, substantial investment in battery R&D, and a well-established supply chain for battery materials contribute to its dominance. Favorable economic policies promoting domestic production and consumption of EVs have significantly boosted the demand for nano alumina.
- Dominant Application: Lithium Battery Separator. The increasing stringency of safety regulations in the automotive and electronics industries has made advanced separator materials a top priority. Nano alumina's ability to improve the thermal shutdown characteristics and electrolyte wettability of separators positions it as a preferred choice.
- Dominant Type: 3N Al2O3. While 4N Al2O3 offers higher purity and potentially superior performance, the widespread adoption of 3N Al2O3 is attributed to its balance of performance characteristics and competitive pricing, making it a more accessible option for mass production of lithium batteries. The infrastructure development in the Asia Pacific region, including Gigafactories for battery production, directly fuels the demand for nano alumina as a key additive. Economic policies focused on energy independence and the adoption of electric mobility further solidify the dominance of this region and segment.
Nano Alumina For Lithium Battery Product Developments
Recent product developments in nano alumina for lithium batteries focus on enhanced purity, controlled particle morphology, and surface functionalization. These advancements aim to improve energy density, cycle life, and safety in lithium-ion batteries. Innovations in nano alumina coatings for battery separators offer superior thermal stability and electrolyte wettability, while new formulations for anode applications show promise in boosting volumetric energy density. The competitive advantage lies in developing cost-effective manufacturing processes that deliver consistent, high-performance nano alumina materials tailored for specific battery chemistries and applications.
Report Scope & Segmentation Analysis
This report segments the Nano Alumina for Lithium Battery market by Application and Type. The Application segments include Lithium Battery Separator, Lithium Battery Anode, and Other applications. The Type segments include 3N Al2O3, 4N Al2O3, and Other types. The Lithium Battery Separator segment is projected for substantial growth, with an estimated market size of millions by 2033. The Lithium Battery Anode segment, while currently smaller, presents significant growth potential as research into anode enhancement using nano alumina intensifies. The 3N Al2O3 segment is expected to maintain a strong market position due to its cost-effectiveness, while the 4N Al2O3 segment is poised for higher growth as performance demands increase.
Key Drivers of Nano Alumina For Lithium Battery Growth
The growth of the Nano Alumina for Lithium Battery market is primarily driven by the exponential rise in demand for electric vehicles (EVs) and the broader adoption of renewable energy storage systems. Technological advancements in battery technology, such as the pursuit of higher energy densities and faster charging capabilities, necessitate the use of high-performance materials like nano alumina. Furthermore, stringent global safety regulations for batteries are pushing manufacturers to incorporate materials that enhance thermal stability and prevent failures, directly benefiting nano alumina applications in separators. Government incentives and policies supporting the transition to sustainable energy and transportation further catalyze market expansion.
Challenges in the Nano Alumina For Lithium Battery Sector
Despite its promising growth, the Nano Alumina for Lithium Battery sector faces several challenges. The high cost of producing ultra-high purity nano alumina (e.g., 4N Al2O3) can be a deterrent for some manufacturers, impacting its widespread adoption compared to 3N Al2O3. Supply chain disruptions and fluctuations in raw material prices for alumina can affect production costs and availability. Moreover, the development of novel battery chemistries that may not require nano alumina or utilize alternative materials poses a competitive threat. Stringent environmental regulations concerning nanoparticle handling and disposal also require careful adherence and can add to operational costs.
Emerging Opportunities in Nano Alumina For Lithium Battery
Emerging opportunities in the Nano Alumina for Lithium Battery market are abundant, particularly in the development of next-generation battery technologies. The growing interest in solid-state batteries presents a significant opportunity for specialized nano alumina formulations that can act as solid electrolytes or binders. Advancements in surface modification techniques of nano alumina are opening doors for enhanced ion conductivity and improved interface stability within battery cells. Furthermore, the expansion of energy storage systems for grid-scale applications and the increasing adoption of portable electronics with higher power demands are creating sustained demand for advanced nano alumina materials, with potential market expansion into niche applications exceeding millions in value.
Leading Players in the Nano Alumina For Lithium Battery Market
- Baikowski
- Shandong Sinocera
- Shengnuo Optoelectronic Technology
- Zhejiang AITEK
- Suzhou Baird New Material Technology
- Hubei Huifu Nanomaterial
- Beijing Deke Daojin Science and Technology
Key Developments in Nano Alumina For Lithium Battery Industry
- 2023: Shandong Sinocera announces a significant expansion of its nano alumina production capacity to meet growing demand from the lithium battery sector.
- 2023: Baikowski introduces a new grade of ultra-high purity nano alumina (4N Al2O3) specifically engineered for advanced lithium battery separators.
- 2024: Zhejiang AITEK showcases innovative nano alumina coatings for lithium battery anodes, demonstrating enhanced energy density in prototype cells.
- 2024: Shengnuo Optoelectronic Technology secures a major supply agreement with a leading EV battery manufacturer, highlighting its growing market influence.
- 2025: Hubei Huifu Nanomaterial reports advancements in sustainable nano alumina synthesis, aiming to reduce production costs and environmental impact.
Strategic Outlook for Nano Alumina For Lithium Battery Market
The strategic outlook for the Nano Alumina for Lithium Battery market remains exceptionally positive. The sustained growth of the electric vehicle industry, coupled with the increasing demand for energy storage solutions, will continue to be the primary growth catalysts. Companies that invest in R&D to develop customized nano alumina solutions for next-generation battery technologies, such as solid-state batteries, will be well-positioned for future success. Focusing on cost-effective production methods, ensuring supply chain resilience, and forging strategic partnerships with battery manufacturers are crucial for capitalizing on the significant market potential, projected to reach millions in the coming years.
Nano Alumina For Lithium Battery Segmentation
-
1. Application
- 1.1. Lithium Battery Separator
- 1.2. Lithium Battery Anode
- 1.3. Other
-
2. Type
- 2.1. 3N Al2O3
- 2.2. 4N Al2O3
- 2.3. Other
Nano Alumina For Lithium Battery Segmentation By Geography
-
1. North America
- 1.1. United States
- 1.2. Canada
- 1.3. Mexico
-
2. South America
- 2.1. Brazil
- 2.2. Argentina
- 2.3. Rest of South America
-
3. Europe
- 3.1. United Kingdom
- 3.2. Germany
- 3.3. France
- 3.4. Italy
- 3.5. Spain
- 3.6. Russia
- 3.7. Benelux
- 3.8. Nordics
- 3.9. Rest of Europe
-
4. Middle East & Africa
- 4.1. Turkey
- 4.2. Israel
- 4.3. GCC
- 4.4. North Africa
- 4.5. South Africa
- 4.6. Rest of Middle East & Africa
-
5. Asia Pacific
- 5.1. China
- 5.2. India
- 5.3. Japan
- 5.4. South Korea
- 5.5. ASEAN
- 5.6. Oceania
- 5.7. Rest of Asia Pacific
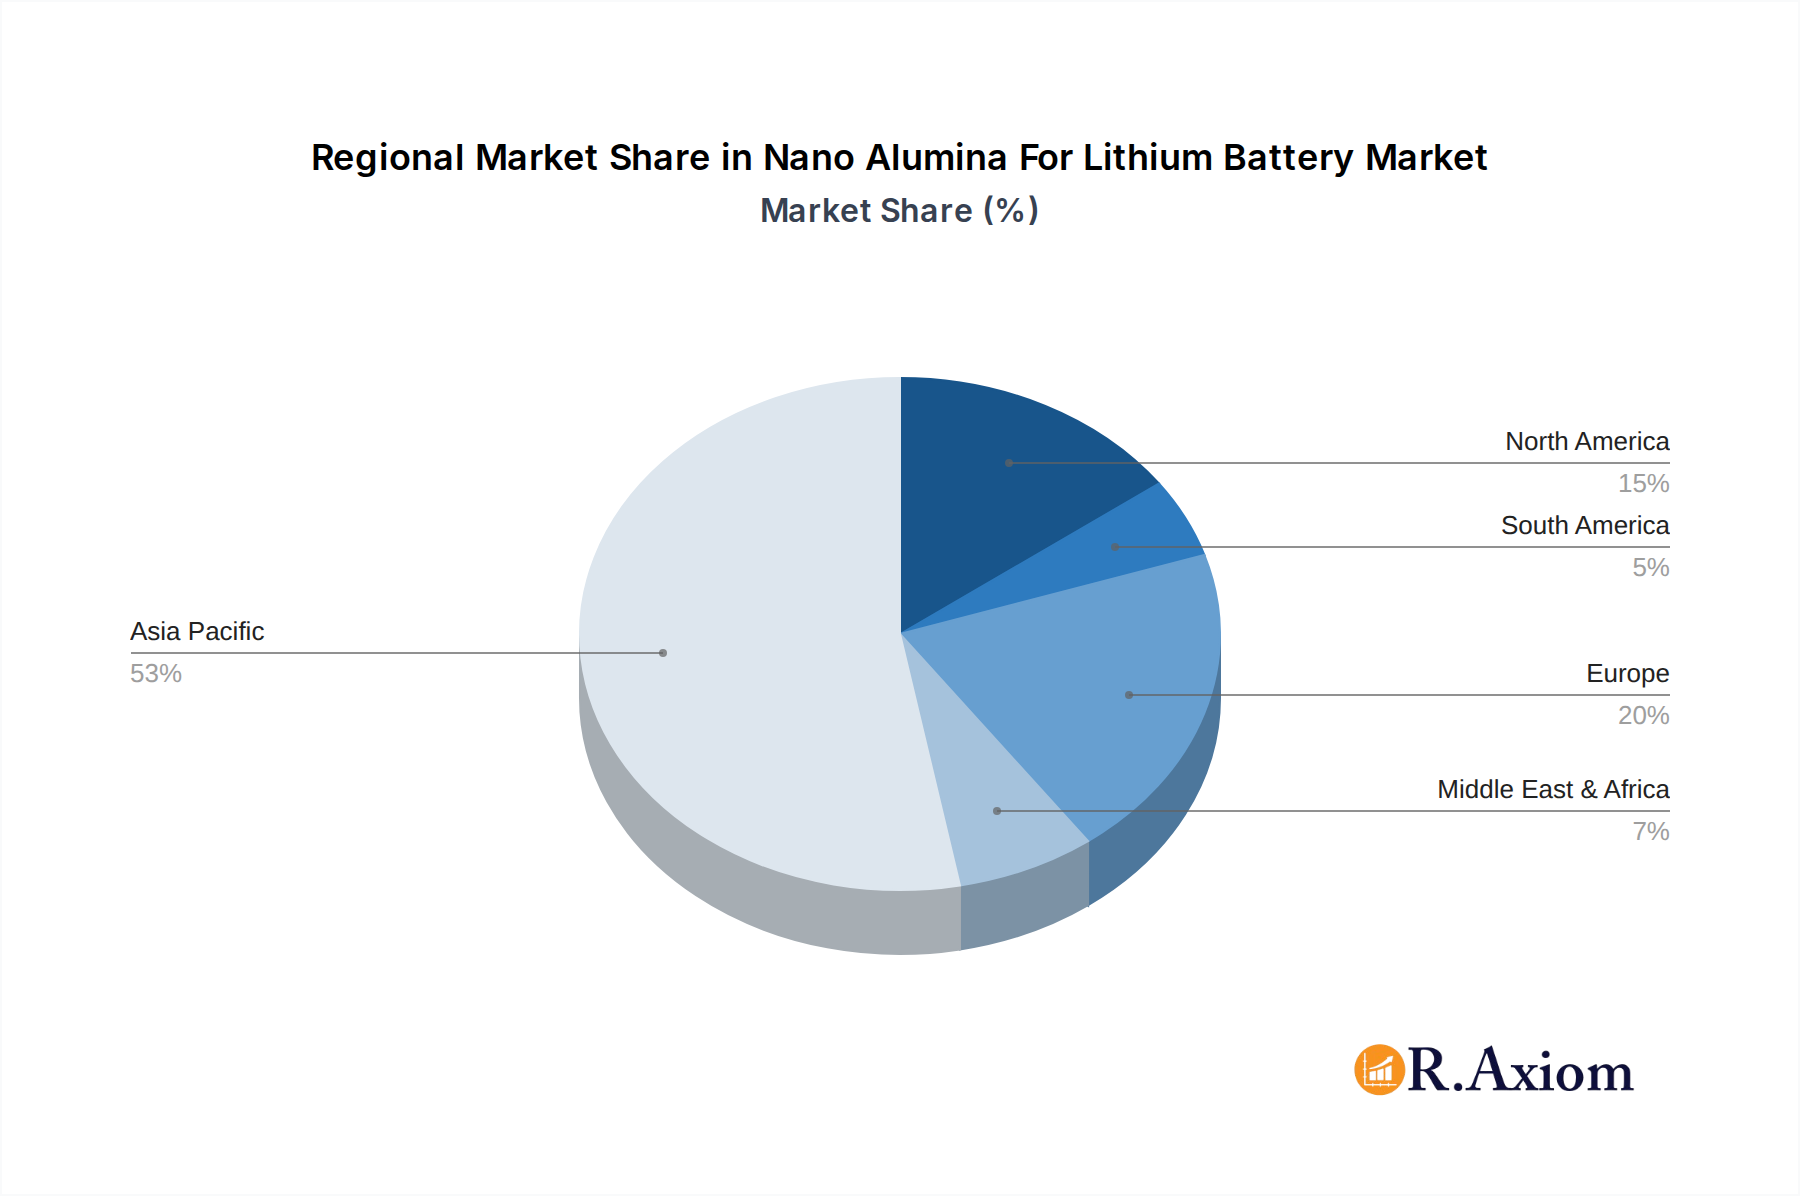
Nano Alumina For Lithium Battery Regional Market Share
Geographic Coverage of Nano Alumina For Lithium Battery
Nano Alumina For Lithium Battery REPORT HIGHLIGHTS
| Aspects | Details |
|---|---|
| Study Period | 2020-2034 |
| Base Year | 2025 |
| Estimated Year | 2026 |
| Forecast Period | 2026-2034 |
| Historical Period | 2020-2025 |
| Growth Rate | CAGR of 7.2% from 2020-2034 |
| Segmentation |
|
Table of Contents
- 1. Introduction
- 1.1. Research Scope
- 1.2. Market Segmentation
- 1.3. Research Objective
- 1.4. Definitions and Assumptions
- 2. Executive Summary
- 2.1. Market Snapshot
- 3. Market Dynamics
- 3.1. Market Drivers
- 3.2. Market Restrains
- 3.3. Market Trends
- 3.4. Market Opportunities
- 4. Market Factor Analysis
- 4.1. Porters Five Forces
- 4.1.1. Bargaining Power of Suppliers
- 4.1.2. Bargaining Power of Buyers
- 4.1.3. Threat of New Entrants
- 4.1.4. Threat of Substitutes
- 4.1.5. Competitive Rivalry
- 4.2. PESTEL analysis
- 4.3. BCG Analysis
- 4.3.1. Stars (High Growth, High Market Share)
- 4.3.2. Cash Cows (Low Growth, High Market Share)
- 4.3.3. Question Mark (High Growth, Low Market Share)
- 4.3.4. Dogs (Low Growth, Low Market Share)
- 4.4. Ansoff Matrix Analysis
- 4.5. Supply Chain Analysis
- 4.6. Regulatory Landscape
- 4.7. Current Market Potential and Opportunity Assessment (TAM–SAM–SOM Framework)
- 4.8. RAX Analyst Note
- 4.1. Porters Five Forces
- 5. Market Analysis, Insights and Forecast 2021-2033
- 5.1. Market Analysis, Insights and Forecast - by Application
- 5.1.1. Lithium Battery Separator
- 5.1.2. Lithium Battery Anode
- 5.1.3. Other
- 5.2. Market Analysis, Insights and Forecast - by Type
- 5.2.1. 3N Al2O3
- 5.2.2. 4N Al2O3
- 5.2.3. Other
- 5.3. Market Analysis, Insights and Forecast - by Region
- 5.3.1. North America
- 5.3.2. South America
- 5.3.3. Europe
- 5.3.4. Middle East & Africa
- 5.3.5. Asia Pacific
- 5.1. Market Analysis, Insights and Forecast - by Application
- 6. Global Nano Alumina For Lithium Battery Analysis, Insights and Forecast, 2021-2033
- 6.1. Market Analysis, Insights and Forecast - by Application
- 6.1.1. Lithium Battery Separator
- 6.1.2. Lithium Battery Anode
- 6.1.3. Other
- 6.2. Market Analysis, Insights and Forecast - by Type
- 6.2.1. 3N Al2O3
- 6.2.2. 4N Al2O3
- 6.2.3. Other
- 6.1. Market Analysis, Insights and Forecast - by Application
- 7. North America Nano Alumina For Lithium Battery Analysis, Insights and Forecast, 2020-2032
- 7.1. Market Analysis, Insights and Forecast - by Application
- 7.1.1. Lithium Battery Separator
- 7.1.2. Lithium Battery Anode
- 7.1.3. Other
- 7.2. Market Analysis, Insights and Forecast - by Type
- 7.2.1. 3N Al2O3
- 7.2.2. 4N Al2O3
- 7.2.3. Other
- 7.1. Market Analysis, Insights and Forecast - by Application
- 8. South America Nano Alumina For Lithium Battery Analysis, Insights and Forecast, 2020-2032
- 8.1. Market Analysis, Insights and Forecast - by Application
- 8.1.1. Lithium Battery Separator
- 8.1.2. Lithium Battery Anode
- 8.1.3. Other
- 8.2. Market Analysis, Insights and Forecast - by Type
- 8.2.1. 3N Al2O3
- 8.2.2. 4N Al2O3
- 8.2.3. Other
- 8.1. Market Analysis, Insights and Forecast - by Application
- 9. Europe Nano Alumina For Lithium Battery Analysis, Insights and Forecast, 2020-2032
- 9.1. Market Analysis, Insights and Forecast - by Application
- 9.1.1. Lithium Battery Separator
- 9.1.2. Lithium Battery Anode
- 9.1.3. Other
- 9.2. Market Analysis, Insights and Forecast - by Type
- 9.2.1. 3N Al2O3
- 9.2.2. 4N Al2O3
- 9.2.3. Other
- 9.1. Market Analysis, Insights and Forecast - by Application
- 10. Middle East & Africa Nano Alumina For Lithium Battery Analysis, Insights and Forecast, 2020-2032
- 10.1. Market Analysis, Insights and Forecast - by Application
- 10.1.1. Lithium Battery Separator
- 10.1.2. Lithium Battery Anode
- 10.1.3. Other
- 10.2. Market Analysis, Insights and Forecast - by Type
- 10.2.1. 3N Al2O3
- 10.2.2. 4N Al2O3
- 10.2.3. Other
- 10.1. Market Analysis, Insights and Forecast - by Application
- 11. Asia Pacific Nano Alumina For Lithium Battery Analysis, Insights and Forecast, 2020-2032
- 11.1. Market Analysis, Insights and Forecast - by Application
- 11.1.1. Lithium Battery Separator
- 11.1.2. Lithium Battery Anode
- 11.1.3. Other
- 11.2. Market Analysis, Insights and Forecast - by Type
- 11.2.1. 3N Al2O3
- 11.2.2. 4N Al2O3
- 11.2.3. Other
- 11.1. Market Analysis, Insights and Forecast - by Application
- 12. Competitive Analysis
- 12.1. Company Profiles
- 12.1.1 Baikowski
- 12.1.1.1. Company Overview
- 12.1.1.2. Products
- 12.1.1.3. Company Financials
- 12.1.1.4. SWOT Analysis
- 12.1.2 Shandong Sinocera
- 12.1.2.1. Company Overview
- 12.1.2.2. Products
- 12.1.2.3. Company Financials
- 12.1.2.4. SWOT Analysis
- 12.1.3 Shengnuo Optoelectronic Technology
- 12.1.3.1. Company Overview
- 12.1.3.2. Products
- 12.1.3.3. Company Financials
- 12.1.3.4. SWOT Analysis
- 12.1.4 Zhejiang AITEK
- 12.1.4.1. Company Overview
- 12.1.4.2. Products
- 12.1.4.3. Company Financials
- 12.1.4.4. SWOT Analysis
- 12.1.5 Suzhou Baird New Material Technology
- 12.1.5.1. Company Overview
- 12.1.5.2. Products
- 12.1.5.3. Company Financials
- 12.1.5.4. SWOT Analysis
- 12.1.6 Hubei Huifu Nanomaterial
- 12.1.6.1. Company Overview
- 12.1.6.2. Products
- 12.1.6.3. Company Financials
- 12.1.6.4. SWOT Analysis
- 12.1.7 Beijing Deke Daojin Science and Technology
- 12.1.7.1. Company Overview
- 12.1.7.2. Products
- 12.1.7.3. Company Financials
- 12.1.7.4. SWOT Analysis
- 12.1.1 Baikowski
- 12.2. Market Entropy
- 12.2.1 Company's Key Areas Served
- 12.2.2 Recent Developments
- 12.3. Company Market Share Analysis 2025
- 12.3.1 Top 5 Companies Market Share Analysis
- 12.3.2 Top 3 Companies Market Share Analysis
- 12.4. List of Potential Customers
- 13. Research Methodology
List of Figures
- Figure 1: Global Nano Alumina For Lithium Battery Revenue Breakdown (million, %) by Region 2025 & 2033
- Figure 2: Global Nano Alumina For Lithium Battery Volume Breakdown (K, %) by Region 2025 & 2033
- Figure 3: North America Nano Alumina For Lithium Battery Revenue (million), by Application 2025 & 2033
- Figure 4: North America Nano Alumina For Lithium Battery Volume (K), by Application 2025 & 2033
- Figure 5: North America Nano Alumina For Lithium Battery Revenue Share (%), by Application 2025 & 2033
- Figure 6: North America Nano Alumina For Lithium Battery Volume Share (%), by Application 2025 & 2033
- Figure 7: North America Nano Alumina For Lithium Battery Revenue (million), by Type 2025 & 2033
- Figure 8: North America Nano Alumina For Lithium Battery Volume (K), by Type 2025 & 2033
- Figure 9: North America Nano Alumina For Lithium Battery Revenue Share (%), by Type 2025 & 2033
- Figure 10: North America Nano Alumina For Lithium Battery Volume Share (%), by Type 2025 & 2033
- Figure 11: North America Nano Alumina For Lithium Battery Revenue (million), by Country 2025 & 2033
- Figure 12: North America Nano Alumina For Lithium Battery Volume (K), by Country 2025 & 2033
- Figure 13: North America Nano Alumina For Lithium Battery Revenue Share (%), by Country 2025 & 2033
- Figure 14: North America Nano Alumina For Lithium Battery Volume Share (%), by Country 2025 & 2033
- Figure 15: South America Nano Alumina For Lithium Battery Revenue (million), by Application 2025 & 2033
- Figure 16: South America Nano Alumina For Lithium Battery Volume (K), by Application 2025 & 2033
- Figure 17: South America Nano Alumina For Lithium Battery Revenue Share (%), by Application 2025 & 2033
- Figure 18: South America Nano Alumina For Lithium Battery Volume Share (%), by Application 2025 & 2033
- Figure 19: South America Nano Alumina For Lithium Battery Revenue (million), by Type 2025 & 2033
- Figure 20: South America Nano Alumina For Lithium Battery Volume (K), by Type 2025 & 2033
- Figure 21: South America Nano Alumina For Lithium Battery Revenue Share (%), by Type 2025 & 2033
- Figure 22: South America Nano Alumina For Lithium Battery Volume Share (%), by Type 2025 & 2033
- Figure 23: South America Nano Alumina For Lithium Battery Revenue (million), by Country 2025 & 2033
- Figure 24: South America Nano Alumina For Lithium Battery Volume (K), by Country 2025 & 2033
- Figure 25: South America Nano Alumina For Lithium Battery Revenue Share (%), by Country 2025 & 2033
- Figure 26: South America Nano Alumina For Lithium Battery Volume Share (%), by Country 2025 & 2033
- Figure 27: Europe Nano Alumina For Lithium Battery Revenue (million), by Application 2025 & 2033
- Figure 28: Europe Nano Alumina For Lithium Battery Volume (K), by Application 2025 & 2033
- Figure 29: Europe Nano Alumina For Lithium Battery Revenue Share (%), by Application 2025 & 2033
- Figure 30: Europe Nano Alumina For Lithium Battery Volume Share (%), by Application 2025 & 2033
- Figure 31: Europe Nano Alumina For Lithium Battery Revenue (million), by Type 2025 & 2033
- Figure 32: Europe Nano Alumina For Lithium Battery Volume (K), by Type 2025 & 2033
- Figure 33: Europe Nano Alumina For Lithium Battery Revenue Share (%), by Type 2025 & 2033
- Figure 34: Europe Nano Alumina For Lithium Battery Volume Share (%), by Type 2025 & 2033
- Figure 35: Europe Nano Alumina For Lithium Battery Revenue (million), by Country 2025 & 2033
- Figure 36: Europe Nano Alumina For Lithium Battery Volume (K), by Country 2025 & 2033
- Figure 37: Europe Nano Alumina For Lithium Battery Revenue Share (%), by Country 2025 & 2033
- Figure 38: Europe Nano Alumina For Lithium Battery Volume Share (%), by Country 2025 & 2033
- Figure 39: Middle East & Africa Nano Alumina For Lithium Battery Revenue (million), by Application 2025 & 2033
- Figure 40: Middle East & Africa Nano Alumina For Lithium Battery Volume (K), by Application 2025 & 2033
- Figure 41: Middle East & Africa Nano Alumina For Lithium Battery Revenue Share (%), by Application 2025 & 2033
- Figure 42: Middle East & Africa Nano Alumina For Lithium Battery Volume Share (%), by Application 2025 & 2033
- Figure 43: Middle East & Africa Nano Alumina For Lithium Battery Revenue (million), by Type 2025 & 2033
- Figure 44: Middle East & Africa Nano Alumina For Lithium Battery Volume (K), by Type 2025 & 2033
- Figure 45: Middle East & Africa Nano Alumina For Lithium Battery Revenue Share (%), by Type 2025 & 2033
- Figure 46: Middle East & Africa Nano Alumina For Lithium Battery Volume Share (%), by Type 2025 & 2033
- Figure 47: Middle East & Africa Nano Alumina For Lithium Battery Revenue (million), by Country 2025 & 2033
- Figure 48: Middle East & Africa Nano Alumina For Lithium Battery Volume (K), by Country 2025 & 2033
- Figure 49: Middle East & Africa Nano Alumina For Lithium Battery Revenue Share (%), by Country 2025 & 2033
- Figure 50: Middle East & Africa Nano Alumina For Lithium Battery Volume Share (%), by Country 2025 & 2033
- Figure 51: Asia Pacific Nano Alumina For Lithium Battery Revenue (million), by Application 2025 & 2033
- Figure 52: Asia Pacific Nano Alumina For Lithium Battery Volume (K), by Application 2025 & 2033
- Figure 53: Asia Pacific Nano Alumina For Lithium Battery Revenue Share (%), by Application 2025 & 2033
- Figure 54: Asia Pacific Nano Alumina For Lithium Battery Volume Share (%), by Application 2025 & 2033
- Figure 55: Asia Pacific Nano Alumina For Lithium Battery Revenue (million), by Type 2025 & 2033
- Figure 56: Asia Pacific Nano Alumina For Lithium Battery Volume (K), by Type 2025 & 2033
- Figure 57: Asia Pacific Nano Alumina For Lithium Battery Revenue Share (%), by Type 2025 & 2033
- Figure 58: Asia Pacific Nano Alumina For Lithium Battery Volume Share (%), by Type 2025 & 2033
- Figure 59: Asia Pacific Nano Alumina For Lithium Battery Revenue (million), by Country 2025 & 2033
- Figure 60: Asia Pacific Nano Alumina For Lithium Battery Volume (K), by Country 2025 & 2033
- Figure 61: Asia Pacific Nano Alumina For Lithium Battery Revenue Share (%), by Country 2025 & 2033
- Figure 62: Asia Pacific Nano Alumina For Lithium Battery Volume Share (%), by Country 2025 & 2033
List of Tables
- Table 1: Global Nano Alumina For Lithium Battery Revenue million Forecast, by Application 2020 & 2033
- Table 2: Global Nano Alumina For Lithium Battery Volume K Forecast, by Application 2020 & 2033
- Table 3: Global Nano Alumina For Lithium Battery Revenue million Forecast, by Type 2020 & 2033
- Table 4: Global Nano Alumina For Lithium Battery Volume K Forecast, by Type 2020 & 2033
- Table 5: Global Nano Alumina For Lithium Battery Revenue million Forecast, by Region 2020 & 2033
- Table 6: Global Nano Alumina For Lithium Battery Volume K Forecast, by Region 2020 & 2033
- Table 7: Global Nano Alumina For Lithium Battery Revenue million Forecast, by Application 2020 & 2033
- Table 8: Global Nano Alumina For Lithium Battery Volume K Forecast, by Application 2020 & 2033
- Table 9: Global Nano Alumina For Lithium Battery Revenue million Forecast, by Type 2020 & 2033
- Table 10: Global Nano Alumina For Lithium Battery Volume K Forecast, by Type 2020 & 2033
- Table 11: Global Nano Alumina For Lithium Battery Revenue million Forecast, by Country 2020 & 2033
- Table 12: Global Nano Alumina For Lithium Battery Volume K Forecast, by Country 2020 & 2033
- Table 13: United States Nano Alumina For Lithium Battery Revenue (million) Forecast, by Application 2020 & 2033
- Table 14: United States Nano Alumina For Lithium Battery Volume (K) Forecast, by Application 2020 & 2033
- Table 15: Canada Nano Alumina For Lithium Battery Revenue (million) Forecast, by Application 2020 & 2033
- Table 16: Canada Nano Alumina For Lithium Battery Volume (K) Forecast, by Application 2020 & 2033
- Table 17: Mexico Nano Alumina For Lithium Battery Revenue (million) Forecast, by Application 2020 & 2033
- Table 18: Mexico Nano Alumina For Lithium Battery Volume (K) Forecast, by Application 2020 & 2033
- Table 19: Global Nano Alumina For Lithium Battery Revenue million Forecast, by Application 2020 & 2033
- Table 20: Global Nano Alumina For Lithium Battery Volume K Forecast, by Application 2020 & 2033
- Table 21: Global Nano Alumina For Lithium Battery Revenue million Forecast, by Type 2020 & 2033
- Table 22: Global Nano Alumina For Lithium Battery Volume K Forecast, by Type 2020 & 2033
- Table 23: Global Nano Alumina For Lithium Battery Revenue million Forecast, by Country 2020 & 2033
- Table 24: Global Nano Alumina For Lithium Battery Volume K Forecast, by Country 2020 & 2033
- Table 25: Brazil Nano Alumina For Lithium Battery Revenue (million) Forecast, by Application 2020 & 2033
- Table 26: Brazil Nano Alumina For Lithium Battery Volume (K) Forecast, by Application 2020 & 2033
- Table 27: Argentina Nano Alumina For Lithium Battery Revenue (million) Forecast, by Application 2020 & 2033
- Table 28: Argentina Nano Alumina For Lithium Battery Volume (K) Forecast, by Application 2020 & 2033
- Table 29: Rest of South America Nano Alumina For Lithium Battery Revenue (million) Forecast, by Application 2020 & 2033
- Table 30: Rest of South America Nano Alumina For Lithium Battery Volume (K) Forecast, by Application 2020 & 2033
- Table 31: Global Nano Alumina For Lithium Battery Revenue million Forecast, by Application 2020 & 2033
- Table 32: Global Nano Alumina For Lithium Battery Volume K Forecast, by Application 2020 & 2033
- Table 33: Global Nano Alumina For Lithium Battery Revenue million Forecast, by Type 2020 & 2033
- Table 34: Global Nano Alumina For Lithium Battery Volume K Forecast, by Type 2020 & 2033
- Table 35: Global Nano Alumina For Lithium Battery Revenue million Forecast, by Country 2020 & 2033
- Table 36: Global Nano Alumina For Lithium Battery Volume K Forecast, by Country 2020 & 2033
- Table 37: United Kingdom Nano Alumina For Lithium Battery Revenue (million) Forecast, by Application 2020 & 2033
- Table 38: United Kingdom Nano Alumina For Lithium Battery Volume (K) Forecast, by Application 2020 & 2033
- Table 39: Germany Nano Alumina For Lithium Battery Revenue (million) Forecast, by Application 2020 & 2033
- Table 40: Germany Nano Alumina For Lithium Battery Volume (K) Forecast, by Application 2020 & 2033
- Table 41: France Nano Alumina For Lithium Battery Revenue (million) Forecast, by Application 2020 & 2033
- Table 42: France Nano Alumina For Lithium Battery Volume (K) Forecast, by Application 2020 & 2033
- Table 43: Italy Nano Alumina For Lithium Battery Revenue (million) Forecast, by Application 2020 & 2033
- Table 44: Italy Nano Alumina For Lithium Battery Volume (K) Forecast, by Application 2020 & 2033
- Table 45: Spain Nano Alumina For Lithium Battery Revenue (million) Forecast, by Application 2020 & 2033
- Table 46: Spain Nano Alumina For Lithium Battery Volume (K) Forecast, by Application 2020 & 2033
- Table 47: Russia Nano Alumina For Lithium Battery Revenue (million) Forecast, by Application 2020 & 2033
- Table 48: Russia Nano Alumina For Lithium Battery Volume (K) Forecast, by Application 2020 & 2033
- Table 49: Benelux Nano Alumina For Lithium Battery Revenue (million) Forecast, by Application 2020 & 2033
- Table 50: Benelux Nano Alumina For Lithium Battery Volume (K) Forecast, by Application 2020 & 2033
- Table 51: Nordics Nano Alumina For Lithium Battery Revenue (million) Forecast, by Application 2020 & 2033
- Table 52: Nordics Nano Alumina For Lithium Battery Volume (K) Forecast, by Application 2020 & 2033
- Table 53: Rest of Europe Nano Alumina For Lithium Battery Revenue (million) Forecast, by Application 2020 & 2033
- Table 54: Rest of Europe Nano Alumina For Lithium Battery Volume (K) Forecast, by Application 2020 & 2033
- Table 55: Global Nano Alumina For Lithium Battery Revenue million Forecast, by Application 2020 & 2033
- Table 56: Global Nano Alumina For Lithium Battery Volume K Forecast, by Application 2020 & 2033
- Table 57: Global Nano Alumina For Lithium Battery Revenue million Forecast, by Type 2020 & 2033
- Table 58: Global Nano Alumina For Lithium Battery Volume K Forecast, by Type 2020 & 2033
- Table 59: Global Nano Alumina For Lithium Battery Revenue million Forecast, by Country 2020 & 2033
- Table 60: Global Nano Alumina For Lithium Battery Volume K Forecast, by Country 2020 & 2033
- Table 61: Turkey Nano Alumina For Lithium Battery Revenue (million) Forecast, by Application 2020 & 2033
- Table 62: Turkey Nano Alumina For Lithium Battery Volume (K) Forecast, by Application 2020 & 2033
- Table 63: Israel Nano Alumina For Lithium Battery Revenue (million) Forecast, by Application 2020 & 2033
- Table 64: Israel Nano Alumina For Lithium Battery Volume (K) Forecast, by Application 2020 & 2033
- Table 65: GCC Nano Alumina For Lithium Battery Revenue (million) Forecast, by Application 2020 & 2033
- Table 66: GCC Nano Alumina For Lithium Battery Volume (K) Forecast, by Application 2020 & 2033
- Table 67: North Africa Nano Alumina For Lithium Battery Revenue (million) Forecast, by Application 2020 & 2033
- Table 68: North Africa Nano Alumina For Lithium Battery Volume (K) Forecast, by Application 2020 & 2033
- Table 69: South Africa Nano Alumina For Lithium Battery Revenue (million) Forecast, by Application 2020 & 2033
- Table 70: South Africa Nano Alumina For Lithium Battery Volume (K) Forecast, by Application 2020 & 2033
- Table 71: Rest of Middle East & Africa Nano Alumina For Lithium Battery Revenue (million) Forecast, by Application 2020 & 2033
- Table 72: Rest of Middle East & Africa Nano Alumina For Lithium Battery Volume (K) Forecast, by Application 2020 & 2033
- Table 73: Global Nano Alumina For Lithium Battery Revenue million Forecast, by Application 2020 & 2033
- Table 74: Global Nano Alumina For Lithium Battery Volume K Forecast, by Application 2020 & 2033
- Table 75: Global Nano Alumina For Lithium Battery Revenue million Forecast, by Type 2020 & 2033
- Table 76: Global Nano Alumina For Lithium Battery Volume K Forecast, by Type 2020 & 2033
- Table 77: Global Nano Alumina For Lithium Battery Revenue million Forecast, by Country 2020 & 2033
- Table 78: Global Nano Alumina For Lithium Battery Volume K Forecast, by Country 2020 & 2033
- Table 79: China Nano Alumina For Lithium Battery Revenue (million) Forecast, by Application 2020 & 2033
- Table 80: China Nano Alumina For Lithium Battery Volume (K) Forecast, by Application 2020 & 2033
- Table 81: India Nano Alumina For Lithium Battery Revenue (million) Forecast, by Application 2020 & 2033
- Table 82: India Nano Alumina For Lithium Battery Volume (K) Forecast, by Application 2020 & 2033
- Table 83: Japan Nano Alumina For Lithium Battery Revenue (million) Forecast, by Application 2020 & 2033
- Table 84: Japan Nano Alumina For Lithium Battery Volume (K) Forecast, by Application 2020 & 2033
- Table 85: South Korea Nano Alumina For Lithium Battery Revenue (million) Forecast, by Application 2020 & 2033
- Table 86: South Korea Nano Alumina For Lithium Battery Volume (K) Forecast, by Application 2020 & 2033
- Table 87: ASEAN Nano Alumina For Lithium Battery Revenue (million) Forecast, by Application 2020 & 2033
- Table 88: ASEAN Nano Alumina For Lithium Battery Volume (K) Forecast, by Application 2020 & 2033
- Table 89: Oceania Nano Alumina For Lithium Battery Revenue (million) Forecast, by Application 2020 & 2033
- Table 90: Oceania Nano Alumina For Lithium Battery Volume (K) Forecast, by Application 2020 & 2033
- Table 91: Rest of Asia Pacific Nano Alumina For Lithium Battery Revenue (million) Forecast, by Application 2020 & 2033
- Table 92: Rest of Asia Pacific Nano Alumina For Lithium Battery Volume (K) Forecast, by Application 2020 & 2033
Frequently Asked Questions
1. What is the projected Compound Annual Growth Rate (CAGR) of the Nano Alumina For Lithium Battery?
The projected CAGR is approximately 7.2%.
2. Which companies are prominent players in the Nano Alumina For Lithium Battery?
Key companies in the market include Baikowski, Shandong Sinocera, Shengnuo Optoelectronic Technology, Zhejiang AITEK, Suzhou Baird New Material Technology, Hubei Huifu Nanomaterial, Beijing Deke Daojin Science and Technology.
3. What are the main segments of the Nano Alumina For Lithium Battery?
The market segments include Application, Type.
4. Can you provide details about the market size?
The market size is estimated to be USD 217 million as of 2022.
5. What are some drivers contributing to market growth?
N/A
6. What are the notable trends driving market growth?
N/A
7. Are there any restraints impacting market growth?
N/A
8. Can you provide examples of recent developments in the market?
N/A
9. What pricing options are available for accessing the report?
Pricing options include single-user, multi-user, and enterprise licenses priced at USD 3950.00, USD 5925.00, and USD 7900.00 respectively.
10. Is the market size provided in terms of value or volume?
The market size is provided in terms of value, measured in million and volume, measured in K.
11. Are there any specific market keywords associated with the report?
Yes, the market keyword associated with the report is "Nano Alumina For Lithium Battery," which aids in identifying and referencing the specific market segment covered.
12. How do I determine which pricing option suits my needs best?
The pricing options vary based on user requirements and access needs. Individual users may opt for single-user licenses, while businesses requiring broader access may choose multi-user or enterprise licenses for cost-effective access to the report.
13. Are there any additional resources or data provided in the Nano Alumina For Lithium Battery report?
While the report offers comprehensive insights, it's advisable to review the specific contents or supplementary materials provided to ascertain if additional resources or data are available.
14. How can I stay updated on further developments or reports in the Nano Alumina For Lithium Battery?
To stay informed about further developments, trends, and reports in the Nano Alumina For Lithium Battery, consider subscribing to industry newsletters, following relevant companies and organizations, or regularly checking reputable industry news sources and publications.
Methodology
Step 1 - Identification of Relevant Samples Size from Population Database


Step 2 - Approaches for Defining Global Market Size (Value, Volume* & Price*)

Note*: In applicable scenarios
Step 3 - Data Sources
Primary Research
- Web Analytics
- Survey Reports
- Research Institute
- Latest Research Reports
- Opinion Leaders
Secondary Research
- Annual Reports
- White Paper
- Latest Press Release
- Industry Association
- Paid Database
- Investor Presentations

Step 4 - Data Triangulation
Involves using different sources of information in order to increase the validity of a study
These sources are likely to be stakeholders in a program - participants, other researchers, program staff, other community members, and so on.
Then we put all data in single framework & apply various statistical tools to find out the dynamic on the market.
During the analysis stage, feedback from the stakeholder groups would be compared to determine areas of agreement as well as areas of divergence