

Key Insights
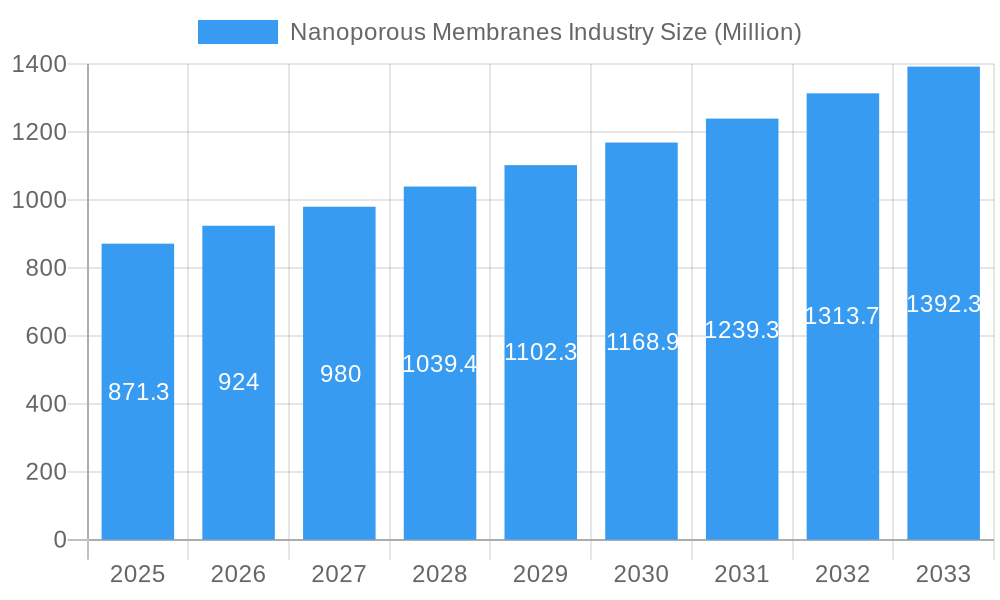
The nanoporous membranes market, valued at $871.3 million in 2025, is projected to experience robust growth, driven by increasing demand across diverse applications. A compound annual growth rate (CAGR) of 6% from 2025 to 2033 suggests a significant market expansion, reaching approximately $1.4 billion by 2033. Key drivers include the rising adoption of advanced water purification technologies, particularly in regions facing water scarcity. Furthermore, the expanding fuel cell industry and the burgeoning biomedical sector are fueling demand for high-performance nanoporous membranes. Growth is also propelled by advancements in material science, leading to the development of innovative membrane materials with enhanced selectivity, permeability, and durability. The organic segment currently holds a significant market share, but the inorganic segment, particularly those based on ceramics, carbon nanotubes, and graphene, is witnessing substantial growth due to superior chemical resistance and operational stability. Competition among key players is intense, with established companies like SUEZ Environnement SA and DowDuPont Inc. alongside emerging innovators continuously striving for market leadership through product innovation and strategic partnerships. Geographical expansion is also expected, with North America and Asia-Pacific currently leading the market, while other regions are poised for growth driven by increasing industrialization and infrastructure development.
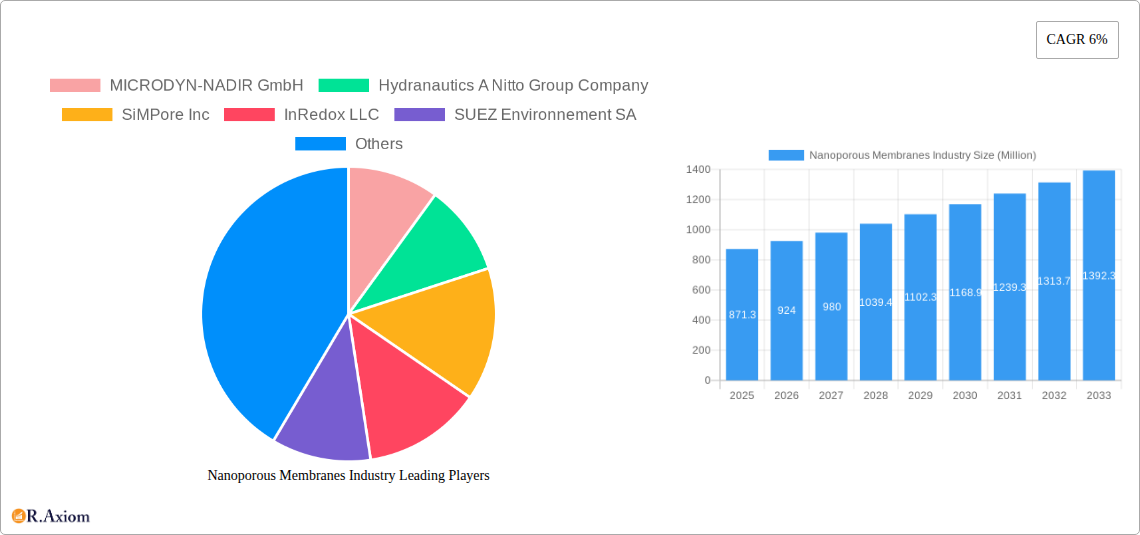
Nanoporous Membranes Industry Market Size (In Million)
The market segmentation reveals strong performance across various application areas. Water treatment is the dominant application, reflecting the global need for clean water. However, the fuel cell and biomedical sectors are experiencing rapid growth, driven by the increasing adoption of fuel cell vehicles and the expansion of the pharmaceutical and healthcare industries. Food processing and other applications also contribute significantly to overall market growth. The choice of material type often depends on the specific application, with organic membranes offering biocompatibility and cost-effectiveness in certain sectors, while inorganic membranes provide superior chemical resistance and thermal stability in others. Hybrid membranes are expected to show significant growth due to their ability to combine the advantages of both organic and inorganic materials. Regional disparities are expected to persist, with developed regions continuing to drive market growth initially, followed by rapid expansion in developing economies, fueled by governmental investments in infrastructure development and a growing awareness of the environmental and health benefits associated with advanced membrane technologies.
Nanoporous Membranes Industry Company Market Share
This in-depth report provides a comprehensive analysis of the global nanoporous membranes industry, covering market size, segmentation, growth drivers, challenges, and key players. The study period spans from 2019 to 2033, with 2025 serving as the base and estimated year. The report offers valuable insights for industry stakeholders, investors, and businesses seeking to understand and capitalize on the opportunities within this dynamic market. The total market value is projected to reach xx Million by 2033.
Nanoporous Membranes Industry Market Concentration & Innovation
The nanoporous membranes market exhibits a moderately concentrated landscape, with several major players holding significant market share. MICRODYN-NADIR GmbH, Hydranautics A Nitto Group Company, and Koch Membrane Systems Inc are among the leading companies, collectively accounting for an estimated xx% of the global market in 2025. However, the market is also characterized by the presence of numerous smaller, specialized companies focusing on niche applications.
Innovation is a key driver in this sector, fueled by advancements in materials science, nanotechnology, and membrane fabrication techniques. The development of novel materials like graphene and carbon nanotubes, along with improvements in membrane selectivity and durability, are driving growth. Stringent environmental regulations, particularly concerning water treatment and pollution control, are also stimulating innovation. The market is seeing increased investment in research and development (R&D), leading to the emergence of innovative membrane designs with enhanced performance and cost-effectiveness.
Significant M&A activity has further shaped market concentration. Over the historical period (2019-2024), the total value of M&A deals in the nanoporous membranes industry was estimated at xx Million, with several deals focusing on expanding product portfolios and geographical reach. The average deal size was approximately xx Million. This consolidation trend is expected to continue, particularly among companies seeking to leverage economies of scale and broaden their technological capabilities. Future M&A activity will likely focus on acquiring companies with specialized expertise in emerging applications or novel membrane technologies.
Nanoporous Membranes Industry Industry Trends & Insights
The nanoporous membranes market is experiencing robust growth, driven by increasing demand across diverse applications. The Compound Annual Growth Rate (CAGR) is projected to be xx% during the forecast period (2025-2033). This growth is fueled by several factors: the escalating demand for clean water and wastewater treatment solutions, the rising adoption of fuel cells for clean energy generation, and the expanding biomedical applications of nanoporous membranes for drug delivery and diagnostics.
Technological advancements are disrupting the market, with the development of advanced materials and manufacturing processes leading to higher-performing membranes with improved selectivity, permeability, and fouling resistance. Consumer preferences are increasingly shifting towards sustainable and eco-friendly solutions, which aligns with the benefits of nanoporous membrane technology. Competitive dynamics are characterized by continuous innovation, product differentiation, and strategic partnerships among industry players. Market penetration of nanoporous membranes in emerging applications, such as gas separation and desalination, is expected to increase significantly during the forecast period, contributing to overall market expansion.
Dominant Markets & Segments in Nanoporous Membranes Industry
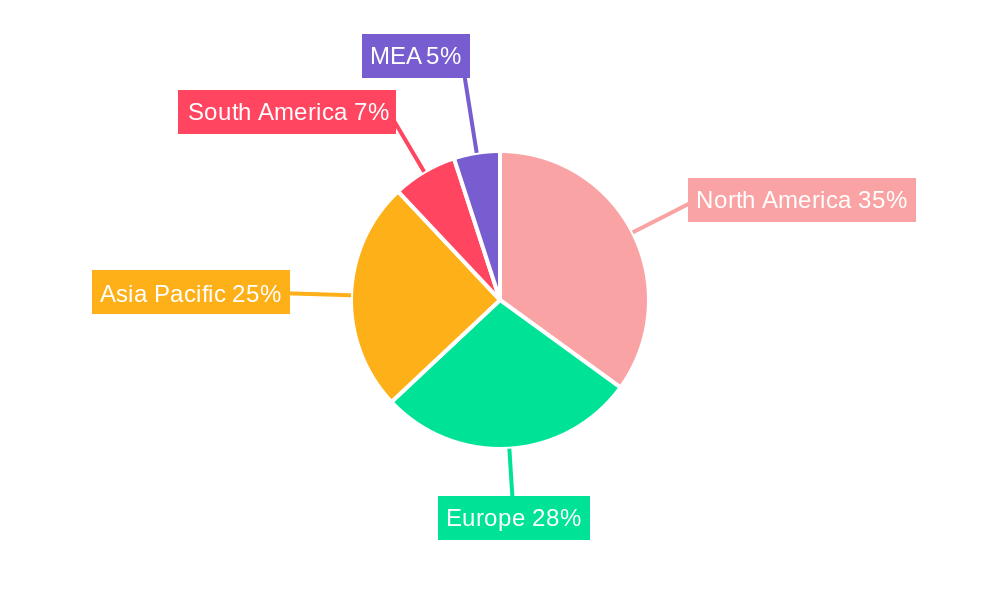
Dominant Regions & Countries: The North American and European markets currently dominate the global nanoporous membranes industry, driven by robust regulatory frameworks, high investments in R&D, and a well-established manufacturing base. However, the Asia-Pacific region is exhibiting the fastest growth, fueled by increasing industrialization, urbanization, and government initiatives promoting clean water technologies. China and India are key drivers of this growth.
Dominant Material Type: Inorganic materials, particularly ceramics, carbon nanotubes, and graphene, are gaining prominence due to their superior thermal and chemical stability, and enhanced mechanical strength compared to organic membranes. However, organic membranes still retain a significant market share due to their cost-effectiveness and ease of processing. Hybrid membranes, combining the advantages of both organic and inorganic materials, are emerging as a promising segment, characterized by superior performance and versatility.
Dominant Applications: The water treatment sector dominates the application landscape, driven by escalating water scarcity and stringent environmental regulations. Fuel cells are another significant application area, boosted by the growing interest in renewable energy. Biomedical applications, including drug delivery and tissue engineering, are also witnessing rapid growth.
- Key Drivers for Water Treatment: Stringent environmental regulations, increasing water scarcity, and the need for efficient water purification solutions.
- Key Drivers for Fuel Cells: Growing demand for clean energy, government incentives for renewable energy technologies, and advancements in fuel cell technology.
- Key Drivers for Biomedical: Rising healthcare expenditure, growing prevalence of chronic diseases, and advancements in drug delivery systems.
Nanoporous Membranes Industry Product Developments
Recent product innovations include the development of advanced composite membranes, incorporating novel materials like graphene and MXenes to enhance permeability and selectivity. Furthermore, advancements in membrane fabrication techniques, such as electrospinning and 3D printing, are enabling the creation of membranes with complex and customized architectures tailored for specific applications. These innovations offer enhanced performance, improved durability, and cost-effectiveness, leading to increased market adoption and driving competition among manufacturers. The focus is on developing membranes that can address specific challenges in various industries, such as fouling mitigation and scalability for industrial applications.
Report Scope & Segmentation Analysis
This report comprehensively analyzes the nanoporous membranes market based on material type (organic, inorganic – ceramics, carbon nanotubes, and graphene – and hybrid) and application (water treatment, fuel cells, biomedical, food processing, and other applications). Each segment is analyzed based on its current market size, growth projections, and competitive landscape. For instance, the water treatment segment is expected to maintain a significant market share throughout the forecast period, driven by rising concerns about water pollution and increasing demand for clean water. The biomedical segment is projected to witness the fastest growth due to the increasing use of nanoporous membranes in drug delivery systems.
Key Drivers of Nanoporous Membranes Industry Growth
The growth of the nanoporous membranes industry is primarily driven by the increasing demand for clean water and wastewater treatment, the escalating adoption of fuel cells for clean energy generation, and the expanding use of membranes in biomedical applications. Technological advancements, such as the development of high-performance membranes with improved selectivity and fouling resistance, are further driving market expansion. Government regulations promoting sustainable technologies and increasing investments in R&D are also key contributors to market growth.
Challenges in the Nanoporous Membranes Industry Sector
The nanoporous membranes industry faces challenges including the high cost of advanced membrane materials, the complexity of membrane fabrication processes, and the potential for membrane fouling. Supply chain disruptions, particularly regarding the availability of specialized materials and components, can also impact production and profitability. Furthermore, intense competition among numerous industry players, coupled with the need for continuous innovation, presents a significant challenge for maintaining market share and profitability. These challenges account for an estimated xx% reduction in the projected market growth.
Emerging Opportunities in Nanoporous Membranes Industry
Emerging opportunities lie in the development of novel membrane materials with enhanced properties, the exploration of new applications in diverse sectors such as gas separation, oil and gas, and environmental remediation. Advancements in membrane fabrication techniques, particularly those allowing for large-scale and cost-effective production, present significant opportunities. The growing focus on sustainability and environmental protection is creating a favorable market environment for the adoption of nanoporous membranes in various applications. The potential for customized membrane solutions tailored for specific applications is also an emerging opportunity.
Leading Players in the Nanoporous Membranes Industry Market
- MICRODYN-NADIR GmbH
- Hydranautics A Nitto Group Company
- SiMPore Inc
- InRedox LLC
- SUEZ Environnement SA
- Osmotech Membranes Pvt Ltd
- Hunan Keensen Technology Co Ltd
- Synder Filtration Inc
- AXEON Water Technologies Inc
- inopor GmbH
- BASF SE
- Toray Chemical Korea Inc
- DowDuPont Inc
- Koch Membrane Systems Inc
- SmartMembranes GmbH
- Applied Membranes Inc
- Alfa Laval AB
- Pure-Pro Water Corporation
Key Developments in Nanoporous Membranes Industry Industry
- 2022: Hydranautics launched a new line of high-flux reverse osmosis membranes for seawater desalination.
- 2023: Koch Membrane Systems announced a strategic partnership with a leading materials science company to develop novel membrane materials.
- 2024: Several smaller companies were acquired by larger players, leading to increased market consolidation. (Specific details unavailable, estimated xx Million in total M&A value).
Strategic Outlook for Nanoporous Membranes Industry Market
The nanoporous membranes market is poised for significant growth over the next decade, driven by continuous technological advancements, the increasing demand for clean water and energy solutions, and the expansion of membrane applications in various sectors. The development of advanced membrane materials, improved manufacturing processes, and the exploration of new applications will be key growth catalysts. Strategic partnerships and collaborations between industry players will play a crucial role in driving innovation and accelerating market adoption. The focus on sustainability and environmental protection creates a positive outlook for continued expansion and market opportunities in this sector.
Nanoporous Membranes Industry Segmentation
-
1. Material Type
- 1.1. Organic
- 1.2. Inorgani
- 1.3. Hybrid
-
2. Application
- 2.1. Water Treatment
- 2.2. Fuel Cells
- 2.3. Biomedical
- 2.4. Food Processing
- 2.5. Other Applications
Nanoporous Membranes Industry Segmentation By Geography
-
1. Asia Pacific
- 1.1. China
- 1.2. India
- 1.3. Japan
- 1.4. South Korea
- 1.5. ASEAN Countries
- 1.6. Rest of Asia Pacific
-
2. North America
- 2.1. United States
- 2.2. Canada
- 2.3. Rest of North America
-
3. Europe
- 3.1. Germany
- 3.2. United Kingdom
- 3.3. Italy
- 3.4. France
- 3.5. Spain
- 3.6. Rest of Europe
-
4. South America
- 4.1. Brazil
- 4.2. Argentina
- 4.3. Rest of South America
- 5. Middle East
-
6. Saudi Arabia
- 6.1. South Africa
- 6.2. Rest of Middle East
Nanoporous Membranes Industry Regional Market Share
Geographic Coverage of Nanoporous Membranes Industry
Nanoporous Membranes Industry REPORT HIGHLIGHTS
| Aspects | Details |
|---|---|
| Study Period | 2020-2034 |
| Base Year | 2025 |
| Estimated Year | 2026 |
| Forecast Period | 2026-2034 |
| Historical Period | 2020-2025 |
| Growth Rate | CAGR of 6% from 2020-2034 |
| Segmentation |
|
Table of Contents
- 1. Introduction
- 1.1. Research Scope
- 1.2. Market Segmentation
- 1.3. Research Objective
- 1.4. Definitions and Assumptions
- 2. Executive Summary
- 2.1. Market Snapshot
- 3. Market Dynamics
- 3.1. Market Drivers
- 3.2. Market Restrains
- 3.3. Market Trends
- 3.4. Market Opportunities
- 4. Market Factor Analysis
- 4.1. Porters Five Forces
- 4.1.1. Bargaining Power of Suppliers
- 4.1.2. Bargaining Power of Buyers
- 4.1.3. Threat of New Entrants
- 4.1.4. Threat of Substitutes
- 4.1.5. Competitive Rivalry
- 4.2. PESTEL analysis
- 4.3. BCG Analysis
- 4.3.1. Stars (High Growth, High Market Share)
- 4.3.2. Cash Cows (Low Growth, High Market Share)
- 4.3.3. Question Mark (High Growth, Low Market Share)
- 4.3.4. Dogs (Low Growth, Low Market Share)
- 4.4. Ansoff Matrix Analysis
- 4.5. Supply Chain Analysis
- 4.6. Regulatory Landscape
- 4.7. Current Market Potential and Opportunity Assessment (TAM–SAM–SOM Framework)
- 4.8. RAX Analyst Note
- 4.1. Porters Five Forces
- 5. Market Analysis, Insights and Forecast 2021-2033
- 5.1. Market Analysis, Insights and Forecast - by Material Type
- 5.1.1. Organic
- 5.1.2. Inorgani
- 5.1.3. Hybrid
- 5.2. Market Analysis, Insights and Forecast - by Application
- 5.2.1. Water Treatment
- 5.2.2. Fuel Cells
- 5.2.3. Biomedical
- 5.2.4. Food Processing
- 5.2.5. Other Applications
- 5.3. Market Analysis, Insights and Forecast - by Region
- 5.3.1. Asia Pacific
- 5.3.2. North America
- 5.3.3. Europe
- 5.3.4. South America
- 5.3.5. Middle East
- 5.3.6. Saudi Arabia
- 5.1. Market Analysis, Insights and Forecast - by Material Type
- 6. Global Nanoporous Membranes Industry Analysis, Insights and Forecast, 2021-2033
- 6.1. Market Analysis, Insights and Forecast - by Material Type
- 6.1.1. Organic
- 6.1.2. Inorgani
- 6.1.3. Hybrid
- 6.2. Market Analysis, Insights and Forecast - by Application
- 6.2.1. Water Treatment
- 6.2.2. Fuel Cells
- 6.2.3. Biomedical
- 6.2.4. Food Processing
- 6.2.5. Other Applications
- 6.1. Market Analysis, Insights and Forecast - by Material Type
- 7. Asia Pacific Nanoporous Membranes Industry Analysis, Insights and Forecast, 2020-2032
- 7.1. Market Analysis, Insights and Forecast - by Material Type
- 7.1.1. Organic
- 7.1.2. Inorgani
- 7.1.3. Hybrid
- 7.2. Market Analysis, Insights and Forecast - by Application
- 7.2.1. Water Treatment
- 7.2.2. Fuel Cells
- 7.2.3. Biomedical
- 7.2.4. Food Processing
- 7.2.5. Other Applications
- 7.1. Market Analysis, Insights and Forecast - by Material Type
- 8. North America Nanoporous Membranes Industry Analysis, Insights and Forecast, 2020-2032
- 8.1. Market Analysis, Insights and Forecast - by Material Type
- 8.1.1. Organic
- 8.1.2. Inorgani
- 8.1.3. Hybrid
- 8.2. Market Analysis, Insights and Forecast - by Application
- 8.2.1. Water Treatment
- 8.2.2. Fuel Cells
- 8.2.3. Biomedical
- 8.2.4. Food Processing
- 8.2.5. Other Applications
- 8.1. Market Analysis, Insights and Forecast - by Material Type
- 9. Europe Nanoporous Membranes Industry Analysis, Insights and Forecast, 2020-2032
- 9.1. Market Analysis, Insights and Forecast - by Material Type
- 9.1.1. Organic
- 9.1.2. Inorgani
- 9.1.3. Hybrid
- 9.2. Market Analysis, Insights and Forecast - by Application
- 9.2.1. Water Treatment
- 9.2.2. Fuel Cells
- 9.2.3. Biomedical
- 9.2.4. Food Processing
- 9.2.5. Other Applications
- 9.1. Market Analysis, Insights and Forecast - by Material Type
- 10. South America Nanoporous Membranes Industry Analysis, Insights and Forecast, 2020-2032
- 10.1. Market Analysis, Insights and Forecast - by Material Type
- 10.1.1. Organic
- 10.1.2. Inorgani
- 10.1.3. Hybrid
- 10.2. Market Analysis, Insights and Forecast - by Application
- 10.2.1. Water Treatment
- 10.2.2. Fuel Cells
- 10.2.3. Biomedical
- 10.2.4. Food Processing
- 10.2.5. Other Applications
- 10.1. Market Analysis, Insights and Forecast - by Material Type
- 11. Middle East Nanoporous Membranes Industry Analysis, Insights and Forecast, 2020-2032
- 11.1. Market Analysis, Insights and Forecast - by Material Type
- 11.1.1. Organic
- 11.1.2. Inorgani
- 11.1.3. Hybrid
- 11.2. Market Analysis, Insights and Forecast - by Application
- 11.2.1. Water Treatment
- 11.2.2. Fuel Cells
- 11.2.3. Biomedical
- 11.2.4. Food Processing
- 11.2.5. Other Applications
- 11.1. Market Analysis, Insights and Forecast - by Material Type
- 12. Saudi Arabia Nanoporous Membranes Industry Analysis, Insights and Forecast, 2020-2032
- 12.1. Market Analysis, Insights and Forecast - by Material Type
- 12.1.1. Organic
- 12.1.2. Inorgani
- 12.1.3. Hybrid
- 12.2. Market Analysis, Insights and Forecast - by Application
- 12.2.1. Water Treatment
- 12.2.2. Fuel Cells
- 12.2.3. Biomedical
- 12.2.4. Food Processing
- 12.2.5. Other Applications
- 12.1. Market Analysis, Insights and Forecast - by Material Type
- 13. Competitive Analysis
- 13.1. Company Profiles
- 13.1.1 MICRODYN-NADIR GmbH
- 13.1.1.1. Company Overview
- 13.1.1.2. Products
- 13.1.1.3. Company Financials
- 13.1.1.4. SWOT Analysis
- 13.1.2 Hydranautics A Nitto Group Company
- 13.1.2.1. Company Overview
- 13.1.2.2. Products
- 13.1.2.3. Company Financials
- 13.1.2.4. SWOT Analysis
- 13.1.3 SiMPore Inc
- 13.1.3.1. Company Overview
- 13.1.3.2. Products
- 13.1.3.3. Company Financials
- 13.1.3.4. SWOT Analysis
- 13.1.4 InRedox LLC
- 13.1.4.1. Company Overview
- 13.1.4.2. Products
- 13.1.4.3. Company Financials
- 13.1.4.4. SWOT Analysis
- 13.1.5 SUEZ Environnement SA
- 13.1.5.1. Company Overview
- 13.1.5.2. Products
- 13.1.5.3. Company Financials
- 13.1.5.4. SWOT Analysis
- 13.1.6 Osmotech Membranes Pvt Ltd
- 13.1.6.1. Company Overview
- 13.1.6.2. Products
- 13.1.6.3. Company Financials
- 13.1.6.4. SWOT Analysis
- 13.1.7 Hunan Keensen Technology Co Ltd
- 13.1.7.1. Company Overview
- 13.1.7.2. Products
- 13.1.7.3. Company Financials
- 13.1.7.4. SWOT Analysis
- 13.1.8 Synder Filtration Inc
- 13.1.8.1. Company Overview
- 13.1.8.2. Products
- 13.1.8.3. Company Financials
- 13.1.8.4. SWOT Analysis
- 13.1.9 AXEON Water Technologies Inc
- 13.1.9.1. Company Overview
- 13.1.9.2. Products
- 13.1.9.3. Company Financials
- 13.1.9.4. SWOT Analysis
- 13.1.10 inopor GmbH
- 13.1.10.1. Company Overview
- 13.1.10.2. Products
- 13.1.10.3. Company Financials
- 13.1.10.4. SWOT Analysis
- 13.1.11 BASF SE
- 13.1.11.1. Company Overview
- 13.1.11.2. Products
- 13.1.11.3. Company Financials
- 13.1.11.4. SWOT Analysis
- 13.1.12 Toray Chemical Korea Inc
- 13.1.12.1. Company Overview
- 13.1.12.2. Products
- 13.1.12.3. Company Financials
- 13.1.12.4. SWOT Analysis
- 13.1.13 DowDuPont Inc
- 13.1.13.1. Company Overview
- 13.1.13.2. Products
- 13.1.13.3. Company Financials
- 13.1.13.4. SWOT Analysis
- 13.1.14 Koch Membrane Systems Inc
- 13.1.14.1. Company Overview
- 13.1.14.2. Products
- 13.1.14.3. Company Financials
- 13.1.14.4. SWOT Analysis
- 13.1.15 SmartMembranes GmbH
- 13.1.15.1. Company Overview
- 13.1.15.2. Products
- 13.1.15.3. Company Financials
- 13.1.15.4. SWOT Analysis
- 13.1.16 Applied Membranes Inc
- 13.1.16.1. Company Overview
- 13.1.16.2. Products
- 13.1.16.3. Company Financials
- 13.1.16.4. SWOT Analysis
- 13.1.17 Alfa Laval AB
- 13.1.17.1. Company Overview
- 13.1.17.2. Products
- 13.1.17.3. Company Financials
- 13.1.17.4. SWOT Analysis
- 13.1.18 Pure-Pro Water Corporation
- 13.1.18.1. Company Overview
- 13.1.18.2. Products
- 13.1.18.3. Company Financials
- 13.1.18.4. SWOT Analysis
- 13.1.1 MICRODYN-NADIR GmbH
- 13.2. Market Entropy
- 13.2.1 Company's Key Areas Served
- 13.2.2 Recent Developments
- 13.3. Company Market Share Analysis 2025
- 13.3.1 Top 5 Companies Market Share Analysis
- 13.3.2 Top 3 Companies Market Share Analysis
- 13.4. List of Potential Customers
- 14. Research Methodology
List of Figures
- Figure 1: Global Nanoporous Membranes Industry Revenue Breakdown (Million, %) by Region 2025 & 2033
- Figure 2: Global Nanoporous Membranes Industry Volume Breakdown (K Units, %) by Region 2025 & 2033
- Figure 3: Asia Pacific Nanoporous Membranes Industry Revenue (Million), by Material Type 2025 & 2033
- Figure 4: Asia Pacific Nanoporous Membranes Industry Volume (K Units), by Material Type 2025 & 2033
- Figure 5: Asia Pacific Nanoporous Membranes Industry Revenue Share (%), by Material Type 2025 & 2033
- Figure 6: Asia Pacific Nanoporous Membranes Industry Volume Share (%), by Material Type 2025 & 2033
- Figure 7: Asia Pacific Nanoporous Membranes Industry Revenue (Million), by Application 2025 & 2033
- Figure 8: Asia Pacific Nanoporous Membranes Industry Volume (K Units), by Application 2025 & 2033
- Figure 9: Asia Pacific Nanoporous Membranes Industry Revenue Share (%), by Application 2025 & 2033
- Figure 10: Asia Pacific Nanoporous Membranes Industry Volume Share (%), by Application 2025 & 2033
- Figure 11: Asia Pacific Nanoporous Membranes Industry Revenue (Million), by Country 2025 & 2033
- Figure 12: Asia Pacific Nanoporous Membranes Industry Volume (K Units), by Country 2025 & 2033
- Figure 13: Asia Pacific Nanoporous Membranes Industry Revenue Share (%), by Country 2025 & 2033
- Figure 14: Asia Pacific Nanoporous Membranes Industry Volume Share (%), by Country 2025 & 2033
- Figure 15: North America Nanoporous Membranes Industry Revenue (Million), by Material Type 2025 & 2033
- Figure 16: North America Nanoporous Membranes Industry Volume (K Units), by Material Type 2025 & 2033
- Figure 17: North America Nanoporous Membranes Industry Revenue Share (%), by Material Type 2025 & 2033
- Figure 18: North America Nanoporous Membranes Industry Volume Share (%), by Material Type 2025 & 2033
- Figure 19: North America Nanoporous Membranes Industry Revenue (Million), by Application 2025 & 2033
- Figure 20: North America Nanoporous Membranes Industry Volume (K Units), by Application 2025 & 2033
- Figure 21: North America Nanoporous Membranes Industry Revenue Share (%), by Application 2025 & 2033
- Figure 22: North America Nanoporous Membranes Industry Volume Share (%), by Application 2025 & 2033
- Figure 23: North America Nanoporous Membranes Industry Revenue (Million), by Country 2025 & 2033
- Figure 24: North America Nanoporous Membranes Industry Volume (K Units), by Country 2025 & 2033
- Figure 25: North America Nanoporous Membranes Industry Revenue Share (%), by Country 2025 & 2033
- Figure 26: North America Nanoporous Membranes Industry Volume Share (%), by Country 2025 & 2033
- Figure 27: Europe Nanoporous Membranes Industry Revenue (Million), by Material Type 2025 & 2033
- Figure 28: Europe Nanoporous Membranes Industry Volume (K Units), by Material Type 2025 & 2033
- Figure 29: Europe Nanoporous Membranes Industry Revenue Share (%), by Material Type 2025 & 2033
- Figure 30: Europe Nanoporous Membranes Industry Volume Share (%), by Material Type 2025 & 2033
- Figure 31: Europe Nanoporous Membranes Industry Revenue (Million), by Application 2025 & 2033
- Figure 32: Europe Nanoporous Membranes Industry Volume (K Units), by Application 2025 & 2033
- Figure 33: Europe Nanoporous Membranes Industry Revenue Share (%), by Application 2025 & 2033
- Figure 34: Europe Nanoporous Membranes Industry Volume Share (%), by Application 2025 & 2033
- Figure 35: Europe Nanoporous Membranes Industry Revenue (Million), by Country 2025 & 2033
- Figure 36: Europe Nanoporous Membranes Industry Volume (K Units), by Country 2025 & 2033
- Figure 37: Europe Nanoporous Membranes Industry Revenue Share (%), by Country 2025 & 2033
- Figure 38: Europe Nanoporous Membranes Industry Volume Share (%), by Country 2025 & 2033
- Figure 39: South America Nanoporous Membranes Industry Revenue (Million), by Material Type 2025 & 2033
- Figure 40: South America Nanoporous Membranes Industry Volume (K Units), by Material Type 2025 & 2033
- Figure 41: South America Nanoporous Membranes Industry Revenue Share (%), by Material Type 2025 & 2033
- Figure 42: South America Nanoporous Membranes Industry Volume Share (%), by Material Type 2025 & 2033
- Figure 43: South America Nanoporous Membranes Industry Revenue (Million), by Application 2025 & 2033
- Figure 44: South America Nanoporous Membranes Industry Volume (K Units), by Application 2025 & 2033
- Figure 45: South America Nanoporous Membranes Industry Revenue Share (%), by Application 2025 & 2033
- Figure 46: South America Nanoporous Membranes Industry Volume Share (%), by Application 2025 & 2033
- Figure 47: South America Nanoporous Membranes Industry Revenue (Million), by Country 2025 & 2033
- Figure 48: South America Nanoporous Membranes Industry Volume (K Units), by Country 2025 & 2033
- Figure 49: South America Nanoporous Membranes Industry Revenue Share (%), by Country 2025 & 2033
- Figure 50: South America Nanoporous Membranes Industry Volume Share (%), by Country 2025 & 2033
- Figure 51: Middle East Nanoporous Membranes Industry Revenue (Million), by Material Type 2025 & 2033
- Figure 52: Middle East Nanoporous Membranes Industry Volume (K Units), by Material Type 2025 & 2033
- Figure 53: Middle East Nanoporous Membranes Industry Revenue Share (%), by Material Type 2025 & 2033
- Figure 54: Middle East Nanoporous Membranes Industry Volume Share (%), by Material Type 2025 & 2033
- Figure 55: Middle East Nanoporous Membranes Industry Revenue (Million), by Application 2025 & 2033
- Figure 56: Middle East Nanoporous Membranes Industry Volume (K Units), by Application 2025 & 2033
- Figure 57: Middle East Nanoporous Membranes Industry Revenue Share (%), by Application 2025 & 2033
- Figure 58: Middle East Nanoporous Membranes Industry Volume Share (%), by Application 2025 & 2033
- Figure 59: Middle East Nanoporous Membranes Industry Revenue (Million), by Country 2025 & 2033
- Figure 60: Middle East Nanoporous Membranes Industry Volume (K Units), by Country 2025 & 2033
- Figure 61: Middle East Nanoporous Membranes Industry Revenue Share (%), by Country 2025 & 2033
- Figure 62: Middle East Nanoporous Membranes Industry Volume Share (%), by Country 2025 & 2033
- Figure 63: Saudi Arabia Nanoporous Membranes Industry Revenue (Million), by Material Type 2025 & 2033
- Figure 64: Saudi Arabia Nanoporous Membranes Industry Volume (K Units), by Material Type 2025 & 2033
- Figure 65: Saudi Arabia Nanoporous Membranes Industry Revenue Share (%), by Material Type 2025 & 2033
- Figure 66: Saudi Arabia Nanoporous Membranes Industry Volume Share (%), by Material Type 2025 & 2033
- Figure 67: Saudi Arabia Nanoporous Membranes Industry Revenue (Million), by Application 2025 & 2033
- Figure 68: Saudi Arabia Nanoporous Membranes Industry Volume (K Units), by Application 2025 & 2033
- Figure 69: Saudi Arabia Nanoporous Membranes Industry Revenue Share (%), by Application 2025 & 2033
- Figure 70: Saudi Arabia Nanoporous Membranes Industry Volume Share (%), by Application 2025 & 2033
- Figure 71: Saudi Arabia Nanoporous Membranes Industry Revenue (Million), by Country 2025 & 2033
- Figure 72: Saudi Arabia Nanoporous Membranes Industry Volume (K Units), by Country 2025 & 2033
- Figure 73: Saudi Arabia Nanoporous Membranes Industry Revenue Share (%), by Country 2025 & 2033
- Figure 74: Saudi Arabia Nanoporous Membranes Industry Volume Share (%), by Country 2025 & 2033
List of Tables
- Table 1: Global Nanoporous Membranes Industry Revenue Million Forecast, by Material Type 2020 & 2033
- Table 2: Global Nanoporous Membranes Industry Volume K Units Forecast, by Material Type 2020 & 2033
- Table 3: Global Nanoporous Membranes Industry Revenue Million Forecast, by Application 2020 & 2033
- Table 4: Global Nanoporous Membranes Industry Volume K Units Forecast, by Application 2020 & 2033
- Table 5: Global Nanoporous Membranes Industry Revenue Million Forecast, by Region 2020 & 2033
- Table 6: Global Nanoporous Membranes Industry Volume K Units Forecast, by Region 2020 & 2033
- Table 7: Global Nanoporous Membranes Industry Revenue Million Forecast, by Material Type 2020 & 2033
- Table 8: Global Nanoporous Membranes Industry Volume K Units Forecast, by Material Type 2020 & 2033
- Table 9: Global Nanoporous Membranes Industry Revenue Million Forecast, by Application 2020 & 2033
- Table 10: Global Nanoporous Membranes Industry Volume K Units Forecast, by Application 2020 & 2033
- Table 11: Global Nanoporous Membranes Industry Revenue Million Forecast, by Country 2020 & 2033
- Table 12: Global Nanoporous Membranes Industry Volume K Units Forecast, by Country 2020 & 2033
- Table 13: China Nanoporous Membranes Industry Revenue (Million) Forecast, by Application 2020 & 2033
- Table 14: China Nanoporous Membranes Industry Volume (K Units) Forecast, by Application 2020 & 2033
- Table 15: India Nanoporous Membranes Industry Revenue (Million) Forecast, by Application 2020 & 2033
- Table 16: India Nanoporous Membranes Industry Volume (K Units) Forecast, by Application 2020 & 2033
- Table 17: Japan Nanoporous Membranes Industry Revenue (Million) Forecast, by Application 2020 & 2033
- Table 18: Japan Nanoporous Membranes Industry Volume (K Units) Forecast, by Application 2020 & 2033
- Table 19: South Korea Nanoporous Membranes Industry Revenue (Million) Forecast, by Application 2020 & 2033
- Table 20: South Korea Nanoporous Membranes Industry Volume (K Units) Forecast, by Application 2020 & 2033
- Table 21: ASEAN Countries Nanoporous Membranes Industry Revenue (Million) Forecast, by Application 2020 & 2033
- Table 22: ASEAN Countries Nanoporous Membranes Industry Volume (K Units) Forecast, by Application 2020 & 2033
- Table 23: Rest of Asia Pacific Nanoporous Membranes Industry Revenue (Million) Forecast, by Application 2020 & 2033
- Table 24: Rest of Asia Pacific Nanoporous Membranes Industry Volume (K Units) Forecast, by Application 2020 & 2033
- Table 25: Global Nanoporous Membranes Industry Revenue Million Forecast, by Material Type 2020 & 2033
- Table 26: Global Nanoporous Membranes Industry Volume K Units Forecast, by Material Type 2020 & 2033
- Table 27: Global Nanoporous Membranes Industry Revenue Million Forecast, by Application 2020 & 2033
- Table 28: Global Nanoporous Membranes Industry Volume K Units Forecast, by Application 2020 & 2033
- Table 29: Global Nanoporous Membranes Industry Revenue Million Forecast, by Country 2020 & 2033
- Table 30: Global Nanoporous Membranes Industry Volume K Units Forecast, by Country 2020 & 2033
- Table 31: United States Nanoporous Membranes Industry Revenue (Million) Forecast, by Application 2020 & 2033
- Table 32: United States Nanoporous Membranes Industry Volume (K Units) Forecast, by Application 2020 & 2033
- Table 33: Canada Nanoporous Membranes Industry Revenue (Million) Forecast, by Application 2020 & 2033
- Table 34: Canada Nanoporous Membranes Industry Volume (K Units) Forecast, by Application 2020 & 2033
- Table 35: Rest of North America Nanoporous Membranes Industry Revenue (Million) Forecast, by Application 2020 & 2033
- Table 36: Rest of North America Nanoporous Membranes Industry Volume (K Units) Forecast, by Application 2020 & 2033
- Table 37: Global Nanoporous Membranes Industry Revenue Million Forecast, by Material Type 2020 & 2033
- Table 38: Global Nanoporous Membranes Industry Volume K Units Forecast, by Material Type 2020 & 2033
- Table 39: Global Nanoporous Membranes Industry Revenue Million Forecast, by Application 2020 & 2033
- Table 40: Global Nanoporous Membranes Industry Volume K Units Forecast, by Application 2020 & 2033
- Table 41: Global Nanoporous Membranes Industry Revenue Million Forecast, by Country 2020 & 2033
- Table 42: Global Nanoporous Membranes Industry Volume K Units Forecast, by Country 2020 & 2033
- Table 43: Germany Nanoporous Membranes Industry Revenue (Million) Forecast, by Application 2020 & 2033
- Table 44: Germany Nanoporous Membranes Industry Volume (K Units) Forecast, by Application 2020 & 2033
- Table 45: United Kingdom Nanoporous Membranes Industry Revenue (Million) Forecast, by Application 2020 & 2033
- Table 46: United Kingdom Nanoporous Membranes Industry Volume (K Units) Forecast, by Application 2020 & 2033
- Table 47: Italy Nanoporous Membranes Industry Revenue (Million) Forecast, by Application 2020 & 2033
- Table 48: Italy Nanoporous Membranes Industry Volume (K Units) Forecast, by Application 2020 & 2033
- Table 49: France Nanoporous Membranes Industry Revenue (Million) Forecast, by Application 2020 & 2033
- Table 50: France Nanoporous Membranes Industry Volume (K Units) Forecast, by Application 2020 & 2033
- Table 51: Spain Nanoporous Membranes Industry Revenue (Million) Forecast, by Application 2020 & 2033
- Table 52: Spain Nanoporous Membranes Industry Volume (K Units) Forecast, by Application 2020 & 2033
- Table 53: Rest of Europe Nanoporous Membranes Industry Revenue (Million) Forecast, by Application 2020 & 2033
- Table 54: Rest of Europe Nanoporous Membranes Industry Volume (K Units) Forecast, by Application 2020 & 2033
- Table 55: Global Nanoporous Membranes Industry Revenue Million Forecast, by Material Type 2020 & 2033
- Table 56: Global Nanoporous Membranes Industry Volume K Units Forecast, by Material Type 2020 & 2033
- Table 57: Global Nanoporous Membranes Industry Revenue Million Forecast, by Application 2020 & 2033
- Table 58: Global Nanoporous Membranes Industry Volume K Units Forecast, by Application 2020 & 2033
- Table 59: Global Nanoporous Membranes Industry Revenue Million Forecast, by Country 2020 & 2033
- Table 60: Global Nanoporous Membranes Industry Volume K Units Forecast, by Country 2020 & 2033
- Table 61: Brazil Nanoporous Membranes Industry Revenue (Million) Forecast, by Application 2020 & 2033
- Table 62: Brazil Nanoporous Membranes Industry Volume (K Units) Forecast, by Application 2020 & 2033
- Table 63: Argentina Nanoporous Membranes Industry Revenue (Million) Forecast, by Application 2020 & 2033
- Table 64: Argentina Nanoporous Membranes Industry Volume (K Units) Forecast, by Application 2020 & 2033
- Table 65: Rest of South America Nanoporous Membranes Industry Revenue (Million) Forecast, by Application 2020 & 2033
- Table 66: Rest of South America Nanoporous Membranes Industry Volume (K Units) Forecast, by Application 2020 & 2033
- Table 67: Global Nanoporous Membranes Industry Revenue Million Forecast, by Material Type 2020 & 2033
- Table 68: Global Nanoporous Membranes Industry Volume K Units Forecast, by Material Type 2020 & 2033
- Table 69: Global Nanoporous Membranes Industry Revenue Million Forecast, by Application 2020 & 2033
- Table 70: Global Nanoporous Membranes Industry Volume K Units Forecast, by Application 2020 & 2033
- Table 71: Global Nanoporous Membranes Industry Revenue Million Forecast, by Country 2020 & 2033
- Table 72: Global Nanoporous Membranes Industry Volume K Units Forecast, by Country 2020 & 2033
- Table 73: Global Nanoporous Membranes Industry Revenue Million Forecast, by Material Type 2020 & 2033
- Table 74: Global Nanoporous Membranes Industry Volume K Units Forecast, by Material Type 2020 & 2033
- Table 75: Global Nanoporous Membranes Industry Revenue Million Forecast, by Application 2020 & 2033
- Table 76: Global Nanoporous Membranes Industry Volume K Units Forecast, by Application 2020 & 2033
- Table 77: Global Nanoporous Membranes Industry Revenue Million Forecast, by Country 2020 & 2033
- Table 78: Global Nanoporous Membranes Industry Volume K Units Forecast, by Country 2020 & 2033
- Table 79: South Africa Nanoporous Membranes Industry Revenue (Million) Forecast, by Application 2020 & 2033
- Table 80: South Africa Nanoporous Membranes Industry Volume (K Units) Forecast, by Application 2020 & 2033
- Table 81: Rest of Middle East Nanoporous Membranes Industry Revenue (Million) Forecast, by Application 2020 & 2033
- Table 82: Rest of Middle East Nanoporous Membranes Industry Volume (K Units) Forecast, by Application 2020 & 2033
Frequently Asked Questions
1. What is the projected Compound Annual Growth Rate (CAGR) of the Nanoporous Membranes Industry?
The projected CAGR is approximately 6%.
2. Which companies are prominent players in the Nanoporous Membranes Industry?
Key companies in the market include MICRODYN-NADIR GmbH, Hydranautics A Nitto Group Company, SiMPore Inc, InRedox LLC, SUEZ Environnement SA, Osmotech Membranes Pvt Ltd, Hunan Keensen Technology Co Ltd, Synder Filtration Inc, AXEON Water Technologies Inc, inopor GmbH, BASF SE, Toray Chemical Korea Inc, DowDuPont Inc, Koch Membrane Systems Inc, SmartMembranes GmbH, Applied Membranes Inc, Alfa Laval AB, Pure-Pro Water Corporation.
3. What are the main segments of the Nanoporous Membranes Industry?
The market segments include Material Type, Application.
4. Can you provide details about the market size?
The market size is estimated to be USD 871.3 Million as of 2022.
5. What are some drivers contributing to market growth?
; Growing Need to Treat Wastewater; Rising Water Desalination Activities.
6. What are the notable trends driving market growth?
Growing Demand from Water Treatment Application.
7. Are there any restraints impacting market growth?
; Low Adoption in the Developing Countries; Poor Fouling Resistance of Nanoporous Membranes; Supply Deficiency of Nanomaterials.
8. Can you provide examples of recent developments in the market?
N/A
9. What pricing options are available for accessing the report?
Pricing options include single-user, multi-user, and enterprise licenses priced at USD 4750, USD 5250, and USD 8750 respectively.
10. Is the market size provided in terms of value or volume?
The market size is provided in terms of value, measured in Million and volume, measured in K Units.
11. Are there any specific market keywords associated with the report?
Yes, the market keyword associated with the report is "Nanoporous Membranes Industry," which aids in identifying and referencing the specific market segment covered.
12. How do I determine which pricing option suits my needs best?
The pricing options vary based on user requirements and access needs. Individual users may opt for single-user licenses, while businesses requiring broader access may choose multi-user or enterprise licenses for cost-effective access to the report.
13. Are there any additional resources or data provided in the Nanoporous Membranes Industry report?
While the report offers comprehensive insights, it's advisable to review the specific contents or supplementary materials provided to ascertain if additional resources or data are available.
14. How can I stay updated on further developments or reports in the Nanoporous Membranes Industry?
To stay informed about further developments, trends, and reports in the Nanoporous Membranes Industry, consider subscribing to industry newsletters, following relevant companies and organizations, or regularly checking reputable industry news sources and publications.
Methodology
Step 1 - Identification of Relevant Samples Size from Population Database


Step 2 - Approaches for Defining Global Market Size (Value, Volume* & Price*)

Note*: In applicable scenarios
Step 3 - Data Sources
Primary Research
- Web Analytics
- Survey Reports
- Research Institute
- Latest Research Reports
- Opinion Leaders
Secondary Research
- Annual Reports
- White Paper
- Latest Press Release
- Industry Association
- Paid Database
- Investor Presentations

Step 4 - Data Triangulation
Involves using different sources of information in order to increase the validity of a study
These sources are likely to be stakeholders in a program - participants, other researchers, program staff, other community members, and so on.
Then we put all data in single framework & apply various statistical tools to find out the dynamic on the market.
During the analysis stage, feedback from the stakeholder groups would be compared to determine areas of agreement as well as areas of divergence