

Key Insights
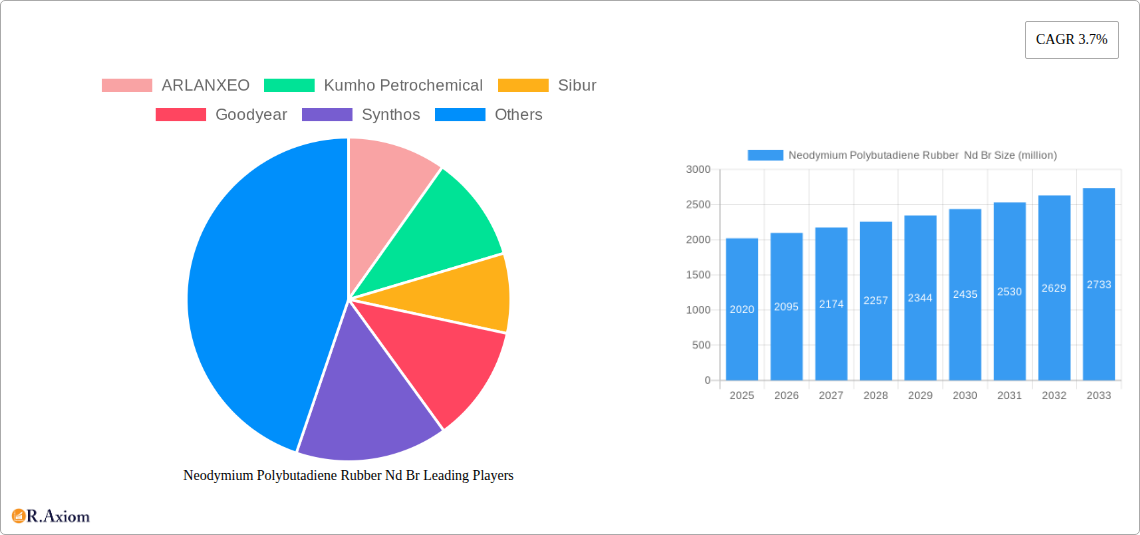
The Neodymium Polybutadiene Rubber (NdPBR) market, valued at approximately $1944 million in 2024, is projected to experience steady growth, exhibiting a Compound Annual Growth Rate (CAGR) of 3.7% from 2025 to 2033. This growth is fueled by increasing demand from the tire industry, particularly in high-performance and electric vehicle tires where NdPBR's superior properties, such as high abrasion resistance and excellent grip, are highly valued. The automotive sector's continued expansion, coupled with rising consumer preference for fuel-efficient vehicles, further bolsters market prospects. Technological advancements focused on enhancing NdPBR's production efficiency and cost-effectiveness are also contributing to its market penetration. Key players like ARLANXEO, Kumho Petrochemical, and Sibur are actively investing in research and development, aiming to improve product performance and expand their market share. Competitive landscape dynamics, including mergers and acquisitions, further shape market evolution.
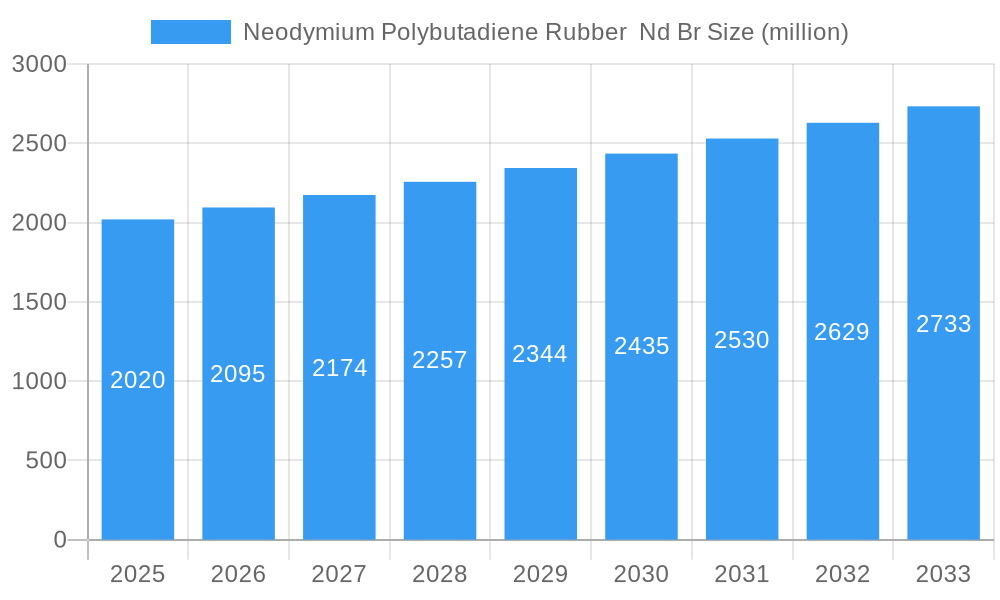
Neodymium Polybutadiene Rubber Nd Br Market Size (In Billion)
However, certain restraints could impact the market's trajectory. Fluctuations in raw material prices, particularly neodymium and butadiene, pose a significant challenge. Furthermore, stringent environmental regulations concerning the manufacturing process and potential health and safety concerns related to certain NdPBR components could necessitate substantial investments in compliance measures and potentially curb growth. Despite these challenges, the market is anticipated to remain robust, driven primarily by the continued expansion of the automotive and tire industries. The increasing adoption of advanced manufacturing techniques and the ongoing research into newer applications beyond tires are expected to open up new avenues for growth during the forecast period.
Neodymium Polybutadiene Rubber Nd Br Company Market Share
This comprehensive report provides an in-depth analysis of the global Neodymium Polybutadiene Rubber (NdBR) market, offering valuable insights for industry stakeholders, investors, and strategic decision-makers. The report covers the period from 2019 to 2033, with a focus on the forecast period from 2025 to 2033, utilizing 2025 as the base year and estimated year. This detailed analysis incorporates market size estimations in millions, exploring key trends, challenges, and opportunities shaping this dynamic market.
Neodymium Polybutadiene Rubber Nd Br Market Concentration & Innovation
This section analyzes the competitive landscape of the NdBR market, focusing on market concentration, innovation drivers, regulatory influences, substitute products, end-user trends, and mergers & acquisitions (M&A) activity. The global NdBR market exhibits a moderately concentrated structure, with a few major players controlling a significant market share. For example, ARLANXEO, Kumho Petrochemical, and Sibur collectively hold an estimated xx% market share in 2025. Innovation is driven by the need for enhanced performance characteristics like improved strength, durability, and processability.
Market Share (2025 Estimates in millions):
- ARLANXEO: xx%
- Kumho Petrochemical: xx%
- Sibur: xx%
- Goodyear: xx%
- Others: xx%
M&A Activity: The NdBR market has witnessed xx M&A deals valued at approximately $xx million in the historical period (2019-2024). These transactions reflect consolidation efforts and strategic expansion by leading players. Regulatory frameworks related to environmental compliance and product safety significantly influence innovation and manufacturing processes. The presence of substitute materials, such as styrene-butadiene rubber (SBR), poses a competitive challenge. End-user trends toward lightweighting and improved fuel efficiency are driving demand for high-performance NdBR.
Neodymium Polybutadiene Rubber Nd Br Industry Trends & Insights
The global NdBR market is experiencing robust growth, driven by increasing demand from various end-use industries. The market's Compound Annual Growth Rate (CAGR) during the forecast period (2025-2033) is projected at xx%. This growth is fueled by several factors, including the rising demand for high-performance tires, increased adoption of NdBR in various automotive components, and its increasing use in industrial applications. Technological advancements in polymerization processes and improved product formulations are enhancing the properties and applications of NdBR. Changing consumer preferences towards fuel-efficient vehicles and improved tire performance further stimulate market growth. Competitive dynamics are characterized by intense rivalry among established players and emerging companies focused on cost optimization, product differentiation, and strategic partnerships. Market penetration is highest in the tire industry, with significant growth potential anticipated in other sectors.
Dominant Markets & Segments in Neodymium Polybutadiene Rubber Nd Br
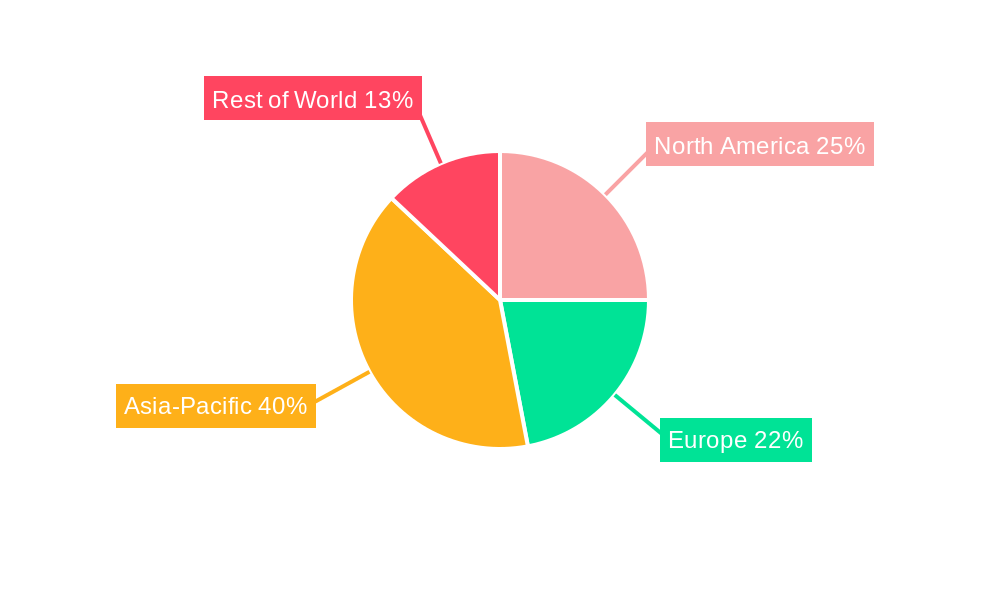
The Asia-Pacific region, particularly China, dominates the global NdBR market. This dominance is attributed to a combination of factors.
- Key Drivers (Asia-Pacific):
- Rapid growth of the automotive industry.
- Expansion of tire manufacturing capacity.
- Favorable government policies supporting industrial development.
- Increasing infrastructure investments.
- Rising disposable incomes and consumer demand.
The dominance stems from the region's significant automotive and tire manufacturing industries, supported by robust economic growth and increasing infrastructure development. Europe and North America represent significant but smaller market segments.
Neodymium Polybutadiene Rubber Nd Br Product Developments
Recent advancements in NdBR technology have focused on enhancing its properties through tailored polymerization techniques and the incorporation of functional additives. This includes the development of NdBR grades with improved tensile strength, tear resistance, and processability. These innovations are expanding the applications of NdBR into high-performance tires, automotive parts, and industrial products. The market is witnessing a trend toward more environmentally friendly NdBR production methods, responding to increasing sustainability concerns.
Report Scope & Segmentation Analysis
This report segments the NdBR market based on several factors, including:
- By Type: This segment covers various types of NdBR based on their chemical properties and applications.
- By Application: This segment covers various uses of NdBR including tires, automotive parts, industrial products, and others.
- By Region: This segment analyzes the market across various geographical regions including Asia-Pacific, North America, Europe, and the rest of the world.
Each segment’s growth projection, market size, and competitive dynamics are analyzed in detail, providing a complete overview of the market structure.
Key Drivers of Neodymium Polybutadiene Rubber Nd Br Growth
The growth of the NdBR market is primarily driven by the expanding automotive and tire industries, a surge in demand for high-performance tires, coupled with the increasing use of NdBR in automotive components and industrial applications. Technological advancements in polymerization methods contribute to enhanced product properties. Favorable government regulations and investments in infrastructure further support market expansion.
Challenges in the Neodymium Polybutadiene Rubber Nd Br Sector
The NdBR market faces challenges such as fluctuating raw material prices, intense competition among established and emerging players, and stringent environmental regulations. Supply chain disruptions can impact production and increase costs, while the threat of substitute materials adds further competitive pressure. These factors pose limitations to market growth and profitability.
Emerging Opportunities in Neodymium Polybutadiene Rubber Nd Br
Emerging opportunities in the NdBR market include the development of specialized NdBR grades with enhanced properties for specific applications (like electric vehicle tires), the growing use of NdBR in high-value applications (e.g., aerospace components), and increased demand in developing economies. Furthermore, exploring sustainable manufacturing practices and bio-based NdBR offer significant growth potential.
Key Developments in Neodymium Polybutadiene Rubber Nd Br Industry
- 2022 Q4: ARLANXEO launched a new high-performance NdBR grade.
- 2023 Q1: Kumho Petrochemical invested in expanding its NdBR production capacity.
- 2023 Q3: A significant M&A deal involving two major NdBR producers was announced. (Further details would be included in the full report)
- Further key developments (with specific dates) would be included in the full report.
Strategic Outlook for Neodymium Polybutadiene Rubber Nd Br Market
The NdBR market is poised for continued growth, driven by increasing demand from key sectors and technological innovation. Opportunities exist in developing specialized grades, expanding into new applications, and focusing on sustainability. Companies with a strong focus on R&D, efficient manufacturing processes, and strategic partnerships are expected to achieve market leadership. The market’s long-term outlook remains positive, fueled by a dynamic industry landscape and significant global demand.
Neodymium Polybutadiene Rubber Nd Br Segmentation
-
1. Application
- 1.1. Tires
- 1.2. Golf Balls
- 1.3. Conveyor Belts
- 1.4. Footwear Soles
- 1.5. Others
-
2. Type
- 2.1. Cis Content ≥ 97%
- 2.2. Cis Content <97%
Neodymium Polybutadiene Rubber Nd Br Segmentation By Geography
-
1. North America
- 1.1. United States
- 1.2. Canada
- 1.3. Mexico
-
2. South America
- 2.1. Brazil
- 2.2. Argentina
- 2.3. Rest of South America
-
3. Europe
- 3.1. United Kingdom
- 3.2. Germany
- 3.3. France
- 3.4. Italy
- 3.5. Spain
- 3.6. Russia
- 3.7. Benelux
- 3.8. Nordics
- 3.9. Rest of Europe
-
4. Middle East & Africa
- 4.1. Turkey
- 4.2. Israel
- 4.3. GCC
- 4.4. North Africa
- 4.5. South Africa
- 4.6. Rest of Middle East & Africa
-
5. Asia Pacific
- 5.1. China
- 5.2. India
- 5.3. Japan
- 5.4. South Korea
- 5.5. ASEAN
- 5.6. Oceania
- 5.7. Rest of Asia Pacific
Neodymium Polybutadiene Rubber Nd Br Regional Market Share
Geographic Coverage of Neodymium Polybutadiene Rubber Nd Br
Neodymium Polybutadiene Rubber Nd Br REPORT HIGHLIGHTS
| Aspects | Details |
|---|---|
| Study Period | 2020-2034 |
| Base Year | 2025 |
| Estimated Year | 2026 |
| Forecast Period | 2026-2034 |
| Historical Period | 2020-2025 |
| Growth Rate | CAGR of 3.7% from 2020-2034 |
| Segmentation |
|
Table of Contents
- 1. Introduction
- 1.1. Research Scope
- 1.2. Market Segmentation
- 1.3. Research Objective
- 1.4. Definitions and Assumptions
- 2. Executive Summary
- 2.1. Market Snapshot
- 3. Market Dynamics
- 3.1. Market Drivers
- 3.2. Market Restrains
- 3.3. Market Trends
- 3.4. Market Opportunities
- 4. Market Factor Analysis
- 4.1. Porters Five Forces
- 4.1.1. Bargaining Power of Suppliers
- 4.1.2. Bargaining Power of Buyers
- 4.1.3. Threat of New Entrants
- 4.1.4. Threat of Substitutes
- 4.1.5. Competitive Rivalry
- 4.2. PESTEL analysis
- 4.3. BCG Analysis
- 4.3.1. Stars (High Growth, High Market Share)
- 4.3.2. Cash Cows (Low Growth, High Market Share)
- 4.3.3. Question Mark (High Growth, Low Market Share)
- 4.3.4. Dogs (Low Growth, Low Market Share)
- 4.4. Ansoff Matrix Analysis
- 4.5. Supply Chain Analysis
- 4.6. Regulatory Landscape
- 4.7. Current Market Potential and Opportunity Assessment (TAM–SAM–SOM Framework)
- 4.8. RAX Analyst Note
- 4.1. Porters Five Forces
- 5. Market Analysis, Insights and Forecast 2021-2033
- 5.1. Market Analysis, Insights and Forecast - by Application
- 5.1.1. Tires
- 5.1.2. Golf Balls
- 5.1.3. Conveyor Belts
- 5.1.4. Footwear Soles
- 5.1.5. Others
- 5.2. Market Analysis, Insights and Forecast - by Type
- 5.2.1. Cis Content ≥ 97%
- 5.2.2. Cis Content <97%
- 5.3. Market Analysis, Insights and Forecast - by Region
- 5.3.1. North America
- 5.3.2. South America
- 5.3.3. Europe
- 5.3.4. Middle East & Africa
- 5.3.5. Asia Pacific
- 5.1. Market Analysis, Insights and Forecast - by Application
- 6. Global Neodymium Polybutadiene Rubber Nd Br Analysis, Insights and Forecast, 2021-2033
- 6.1. Market Analysis, Insights and Forecast - by Application
- 6.1.1. Tires
- 6.1.2. Golf Balls
- 6.1.3. Conveyor Belts
- 6.1.4. Footwear Soles
- 6.1.5. Others
- 6.2. Market Analysis, Insights and Forecast - by Type
- 6.2.1. Cis Content ≥ 97%
- 6.2.2. Cis Content <97%
- 6.1. Market Analysis, Insights and Forecast - by Application
- 7. North America Neodymium Polybutadiene Rubber Nd Br Analysis, Insights and Forecast, 2020-2032
- 7.1. Market Analysis, Insights and Forecast - by Application
- 7.1.1. Tires
- 7.1.2. Golf Balls
- 7.1.3. Conveyor Belts
- 7.1.4. Footwear Soles
- 7.1.5. Others
- 7.2. Market Analysis, Insights and Forecast - by Type
- 7.2.1. Cis Content ≥ 97%
- 7.2.2. Cis Content <97%
- 7.1. Market Analysis, Insights and Forecast - by Application
- 8. South America Neodymium Polybutadiene Rubber Nd Br Analysis, Insights and Forecast, 2020-2032
- 8.1. Market Analysis, Insights and Forecast - by Application
- 8.1.1. Tires
- 8.1.2. Golf Balls
- 8.1.3. Conveyor Belts
- 8.1.4. Footwear Soles
- 8.1.5. Others
- 8.2. Market Analysis, Insights and Forecast - by Type
- 8.2.1. Cis Content ≥ 97%
- 8.2.2. Cis Content <97%
- 8.1. Market Analysis, Insights and Forecast - by Application
- 9. Europe Neodymium Polybutadiene Rubber Nd Br Analysis, Insights and Forecast, 2020-2032
- 9.1. Market Analysis, Insights and Forecast - by Application
- 9.1.1. Tires
- 9.1.2. Golf Balls
- 9.1.3. Conveyor Belts
- 9.1.4. Footwear Soles
- 9.1.5. Others
- 9.2. Market Analysis, Insights and Forecast - by Type
- 9.2.1. Cis Content ≥ 97%
- 9.2.2. Cis Content <97%
- 9.1. Market Analysis, Insights and Forecast - by Application
- 10. Middle East & Africa Neodymium Polybutadiene Rubber Nd Br Analysis, Insights and Forecast, 2020-2032
- 10.1. Market Analysis, Insights and Forecast - by Application
- 10.1.1. Tires
- 10.1.2. Golf Balls
- 10.1.3. Conveyor Belts
- 10.1.4. Footwear Soles
- 10.1.5. Others
- 10.2. Market Analysis, Insights and Forecast - by Type
- 10.2.1. Cis Content ≥ 97%
- 10.2.2. Cis Content <97%
- 10.1. Market Analysis, Insights and Forecast - by Application
- 11. Asia Pacific Neodymium Polybutadiene Rubber Nd Br Analysis, Insights and Forecast, 2020-2032
- 11.1. Market Analysis, Insights and Forecast - by Application
- 11.1.1. Tires
- 11.1.2. Golf Balls
- 11.1.3. Conveyor Belts
- 11.1.4. Footwear Soles
- 11.1.5. Others
- 11.2. Market Analysis, Insights and Forecast - by Type
- 11.2.1. Cis Content ≥ 97%
- 11.2.2. Cis Content <97%
- 11.1. Market Analysis, Insights and Forecast - by Application
- 12. Competitive Analysis
- 12.1. Company Profiles
- 12.1.1 ARLANXEO
- 12.1.1.1. Company Overview
- 12.1.1.2. Products
- 12.1.1.3. Company Financials
- 12.1.1.4. SWOT Analysis
- 12.1.2 Kumho Petrochemical
- 12.1.2.1. Company Overview
- 12.1.2.2. Products
- 12.1.2.3. Company Financials
- 12.1.2.4. SWOT Analysis
- 12.1.3 Sibur
- 12.1.3.1. Company Overview
- 12.1.3.2. Products
- 12.1.3.3. Company Financials
- 12.1.3.4. SWOT Analysis
- 12.1.4 Goodyear
- 12.1.4.1. Company Overview
- 12.1.4.2. Products
- 12.1.4.3. Company Financials
- 12.1.4.4. SWOT Analysis
- 12.1.5 Synthos
- 12.1.5.1. Company Overview
- 12.1.5.2. Products
- 12.1.5.3. Company Financials
- 12.1.5.4. SWOT Analysis
- 12.1.6 Versalis
- 12.1.6.1. Company Overview
- 12.1.6.2. Products
- 12.1.6.3. Company Financials
- 12.1.6.4. SWOT Analysis
- 12.1.7 Chimei
- 12.1.7.1. Company Overview
- 12.1.7.2. Products
- 12.1.7.3. Company Financials
- 12.1.7.4. SWOT Analysis
- 12.1.8 Michelin
- 12.1.8.1. Company Overview
- 12.1.8.2. Products
- 12.1.8.3. Company Financials
- 12.1.8.4. SWOT Analysis
- 12.1.9 LG Chem
- 12.1.9.1. Company Overview
- 12.1.9.2. Products
- 12.1.9.3. Company Financials
- 12.1.9.4. SWOT Analysis
- 12.1.10 CPNC
- 12.1.10.1. Company Overview
- 12.1.10.2. Products
- 12.1.10.3. Company Financials
- 12.1.10.4. SWOT Analysis
- 12.1.11 Sinopec
- 12.1.11.1. Company Overview
- 12.1.11.2. Products
- 12.1.11.3. Company Financials
- 12.1.11.4. SWOT Analysis
- 12.1.12 Zhejiang Transfar
- 12.1.12.1. Company Overview
- 12.1.12.2. Products
- 12.1.12.3. Company Financials
- 12.1.12.4. SWOT Analysis
- 12.1.1 ARLANXEO
- 12.2. Market Entropy
- 12.2.1 Company's Key Areas Served
- 12.2.2 Recent Developments
- 12.3. Company Market Share Analysis 2025
- 12.3.1 Top 5 Companies Market Share Analysis
- 12.3.2 Top 3 Companies Market Share Analysis
- 12.4. List of Potential Customers
- 13. Research Methodology
List of Figures
- Figure 1: Global Neodymium Polybutadiene Rubber Nd Br Revenue Breakdown (million, %) by Region 2025 & 2033
- Figure 2: North America Neodymium Polybutadiene Rubber Nd Br Revenue (million), by Application 2025 & 2033
- Figure 3: North America Neodymium Polybutadiene Rubber Nd Br Revenue Share (%), by Application 2025 & 2033
- Figure 4: North America Neodymium Polybutadiene Rubber Nd Br Revenue (million), by Type 2025 & 2033
- Figure 5: North America Neodymium Polybutadiene Rubber Nd Br Revenue Share (%), by Type 2025 & 2033
- Figure 6: North America Neodymium Polybutadiene Rubber Nd Br Revenue (million), by Country 2025 & 2033
- Figure 7: North America Neodymium Polybutadiene Rubber Nd Br Revenue Share (%), by Country 2025 & 2033
- Figure 8: South America Neodymium Polybutadiene Rubber Nd Br Revenue (million), by Application 2025 & 2033
- Figure 9: South America Neodymium Polybutadiene Rubber Nd Br Revenue Share (%), by Application 2025 & 2033
- Figure 10: South America Neodymium Polybutadiene Rubber Nd Br Revenue (million), by Type 2025 & 2033
- Figure 11: South America Neodymium Polybutadiene Rubber Nd Br Revenue Share (%), by Type 2025 & 2033
- Figure 12: South America Neodymium Polybutadiene Rubber Nd Br Revenue (million), by Country 2025 & 2033
- Figure 13: South America Neodymium Polybutadiene Rubber Nd Br Revenue Share (%), by Country 2025 & 2033
- Figure 14: Europe Neodymium Polybutadiene Rubber Nd Br Revenue (million), by Application 2025 & 2033
- Figure 15: Europe Neodymium Polybutadiene Rubber Nd Br Revenue Share (%), by Application 2025 & 2033
- Figure 16: Europe Neodymium Polybutadiene Rubber Nd Br Revenue (million), by Type 2025 & 2033
- Figure 17: Europe Neodymium Polybutadiene Rubber Nd Br Revenue Share (%), by Type 2025 & 2033
- Figure 18: Europe Neodymium Polybutadiene Rubber Nd Br Revenue (million), by Country 2025 & 2033
- Figure 19: Europe Neodymium Polybutadiene Rubber Nd Br Revenue Share (%), by Country 2025 & 2033
- Figure 20: Middle East & Africa Neodymium Polybutadiene Rubber Nd Br Revenue (million), by Application 2025 & 2033
- Figure 21: Middle East & Africa Neodymium Polybutadiene Rubber Nd Br Revenue Share (%), by Application 2025 & 2033
- Figure 22: Middle East & Africa Neodymium Polybutadiene Rubber Nd Br Revenue (million), by Type 2025 & 2033
- Figure 23: Middle East & Africa Neodymium Polybutadiene Rubber Nd Br Revenue Share (%), by Type 2025 & 2033
- Figure 24: Middle East & Africa Neodymium Polybutadiene Rubber Nd Br Revenue (million), by Country 2025 & 2033
- Figure 25: Middle East & Africa Neodymium Polybutadiene Rubber Nd Br Revenue Share (%), by Country 2025 & 2033
- Figure 26: Asia Pacific Neodymium Polybutadiene Rubber Nd Br Revenue (million), by Application 2025 & 2033
- Figure 27: Asia Pacific Neodymium Polybutadiene Rubber Nd Br Revenue Share (%), by Application 2025 & 2033
- Figure 28: Asia Pacific Neodymium Polybutadiene Rubber Nd Br Revenue (million), by Type 2025 & 2033
- Figure 29: Asia Pacific Neodymium Polybutadiene Rubber Nd Br Revenue Share (%), by Type 2025 & 2033
- Figure 30: Asia Pacific Neodymium Polybutadiene Rubber Nd Br Revenue (million), by Country 2025 & 2033
- Figure 31: Asia Pacific Neodymium Polybutadiene Rubber Nd Br Revenue Share (%), by Country 2025 & 2033
List of Tables
- Table 1: Global Neodymium Polybutadiene Rubber Nd Br Revenue million Forecast, by Application 2020 & 2033
- Table 2: Global Neodymium Polybutadiene Rubber Nd Br Revenue million Forecast, by Type 2020 & 2033
- Table 3: Global Neodymium Polybutadiene Rubber Nd Br Revenue million Forecast, by Region 2020 & 2033
- Table 4: Global Neodymium Polybutadiene Rubber Nd Br Revenue million Forecast, by Application 2020 & 2033
- Table 5: Global Neodymium Polybutadiene Rubber Nd Br Revenue million Forecast, by Type 2020 & 2033
- Table 6: Global Neodymium Polybutadiene Rubber Nd Br Revenue million Forecast, by Country 2020 & 2033
- Table 7: United States Neodymium Polybutadiene Rubber Nd Br Revenue (million) Forecast, by Application 2020 & 2033
- Table 8: Canada Neodymium Polybutadiene Rubber Nd Br Revenue (million) Forecast, by Application 2020 & 2033
- Table 9: Mexico Neodymium Polybutadiene Rubber Nd Br Revenue (million) Forecast, by Application 2020 & 2033
- Table 10: Global Neodymium Polybutadiene Rubber Nd Br Revenue million Forecast, by Application 2020 & 2033
- Table 11: Global Neodymium Polybutadiene Rubber Nd Br Revenue million Forecast, by Type 2020 & 2033
- Table 12: Global Neodymium Polybutadiene Rubber Nd Br Revenue million Forecast, by Country 2020 & 2033
- Table 13: Brazil Neodymium Polybutadiene Rubber Nd Br Revenue (million) Forecast, by Application 2020 & 2033
- Table 14: Argentina Neodymium Polybutadiene Rubber Nd Br Revenue (million) Forecast, by Application 2020 & 2033
- Table 15: Rest of South America Neodymium Polybutadiene Rubber Nd Br Revenue (million) Forecast, by Application 2020 & 2033
- Table 16: Global Neodymium Polybutadiene Rubber Nd Br Revenue million Forecast, by Application 2020 & 2033
- Table 17: Global Neodymium Polybutadiene Rubber Nd Br Revenue million Forecast, by Type 2020 & 2033
- Table 18: Global Neodymium Polybutadiene Rubber Nd Br Revenue million Forecast, by Country 2020 & 2033
- Table 19: United Kingdom Neodymium Polybutadiene Rubber Nd Br Revenue (million) Forecast, by Application 2020 & 2033
- Table 20: Germany Neodymium Polybutadiene Rubber Nd Br Revenue (million) Forecast, by Application 2020 & 2033
- Table 21: France Neodymium Polybutadiene Rubber Nd Br Revenue (million) Forecast, by Application 2020 & 2033
- Table 22: Italy Neodymium Polybutadiene Rubber Nd Br Revenue (million) Forecast, by Application 2020 & 2033
- Table 23: Spain Neodymium Polybutadiene Rubber Nd Br Revenue (million) Forecast, by Application 2020 & 2033
- Table 24: Russia Neodymium Polybutadiene Rubber Nd Br Revenue (million) Forecast, by Application 2020 & 2033
- Table 25: Benelux Neodymium Polybutadiene Rubber Nd Br Revenue (million) Forecast, by Application 2020 & 2033
- Table 26: Nordics Neodymium Polybutadiene Rubber Nd Br Revenue (million) Forecast, by Application 2020 & 2033
- Table 27: Rest of Europe Neodymium Polybutadiene Rubber Nd Br Revenue (million) Forecast, by Application 2020 & 2033
- Table 28: Global Neodymium Polybutadiene Rubber Nd Br Revenue million Forecast, by Application 2020 & 2033
- Table 29: Global Neodymium Polybutadiene Rubber Nd Br Revenue million Forecast, by Type 2020 & 2033
- Table 30: Global Neodymium Polybutadiene Rubber Nd Br Revenue million Forecast, by Country 2020 & 2033
- Table 31: Turkey Neodymium Polybutadiene Rubber Nd Br Revenue (million) Forecast, by Application 2020 & 2033
- Table 32: Israel Neodymium Polybutadiene Rubber Nd Br Revenue (million) Forecast, by Application 2020 & 2033
- Table 33: GCC Neodymium Polybutadiene Rubber Nd Br Revenue (million) Forecast, by Application 2020 & 2033
- Table 34: North Africa Neodymium Polybutadiene Rubber Nd Br Revenue (million) Forecast, by Application 2020 & 2033
- Table 35: South Africa Neodymium Polybutadiene Rubber Nd Br Revenue (million) Forecast, by Application 2020 & 2033
- Table 36: Rest of Middle East & Africa Neodymium Polybutadiene Rubber Nd Br Revenue (million) Forecast, by Application 2020 & 2033
- Table 37: Global Neodymium Polybutadiene Rubber Nd Br Revenue million Forecast, by Application 2020 & 2033
- Table 38: Global Neodymium Polybutadiene Rubber Nd Br Revenue million Forecast, by Type 2020 & 2033
- Table 39: Global Neodymium Polybutadiene Rubber Nd Br Revenue million Forecast, by Country 2020 & 2033
- Table 40: China Neodymium Polybutadiene Rubber Nd Br Revenue (million) Forecast, by Application 2020 & 2033
- Table 41: India Neodymium Polybutadiene Rubber Nd Br Revenue (million) Forecast, by Application 2020 & 2033
- Table 42: Japan Neodymium Polybutadiene Rubber Nd Br Revenue (million) Forecast, by Application 2020 & 2033
- Table 43: South Korea Neodymium Polybutadiene Rubber Nd Br Revenue (million) Forecast, by Application 2020 & 2033
- Table 44: ASEAN Neodymium Polybutadiene Rubber Nd Br Revenue (million) Forecast, by Application 2020 & 2033
- Table 45: Oceania Neodymium Polybutadiene Rubber Nd Br Revenue (million) Forecast, by Application 2020 & 2033
- Table 46: Rest of Asia Pacific Neodymium Polybutadiene Rubber Nd Br Revenue (million) Forecast, by Application 2020 & 2033
Frequently Asked Questions
1. What is the projected Compound Annual Growth Rate (CAGR) of the Neodymium Polybutadiene Rubber Nd Br?
The projected CAGR is approximately 3.7%.
2. Which companies are prominent players in the Neodymium Polybutadiene Rubber Nd Br?
Key companies in the market include ARLANXEO, Kumho Petrochemical, Sibur, Goodyear, Synthos, Versalis, Chimei, Michelin, LG Chem, CPNC, Sinopec, Zhejiang Transfar.
3. What are the main segments of the Neodymium Polybutadiene Rubber Nd Br?
The market segments include Application, Type.
4. Can you provide details about the market size?
The market size is estimated to be USD 1944 million as of 2022.
5. What are some drivers contributing to market growth?
N/A
6. What are the notable trends driving market growth?
N/A
7. Are there any restraints impacting market growth?
N/A
8. Can you provide examples of recent developments in the market?
N/A
9. What pricing options are available for accessing the report?
Pricing options include single-user, multi-user, and enterprise licenses priced at USD 4250.00, USD 6375.00, and USD 8500.00 respectively.
10. Is the market size provided in terms of value or volume?
The market size is provided in terms of value, measured in million.
11. Are there any specific market keywords associated with the report?
Yes, the market keyword associated with the report is "Neodymium Polybutadiene Rubber Nd Br," which aids in identifying and referencing the specific market segment covered.
12. How do I determine which pricing option suits my needs best?
The pricing options vary based on user requirements and access needs. Individual users may opt for single-user licenses, while businesses requiring broader access may choose multi-user or enterprise licenses for cost-effective access to the report.
13. Are there any additional resources or data provided in the Neodymium Polybutadiene Rubber Nd Br report?
While the report offers comprehensive insights, it's advisable to review the specific contents or supplementary materials provided to ascertain if additional resources or data are available.
14. How can I stay updated on further developments or reports in the Neodymium Polybutadiene Rubber Nd Br?
To stay informed about further developments, trends, and reports in the Neodymium Polybutadiene Rubber Nd Br, consider subscribing to industry newsletters, following relevant companies and organizations, or regularly checking reputable industry news sources and publications.
Methodology
Step 1 - Identification of Relevant Samples Size from Population Database


Step 2 - Approaches for Defining Global Market Size (Value, Volume* & Price*)

Note*: In applicable scenarios
Step 3 - Data Sources
Primary Research
- Web Analytics
- Survey Reports
- Research Institute
- Latest Research Reports
- Opinion Leaders
Secondary Research
- Annual Reports
- White Paper
- Latest Press Release
- Industry Association
- Paid Database
- Investor Presentations

Step 4 - Data Triangulation
Involves using different sources of information in order to increase the validity of a study
These sources are likely to be stakeholders in a program - participants, other researchers, program staff, other community members, and so on.
Then we put all data in single framework & apply various statistical tools to find out the dynamic on the market.
During the analysis stage, feedback from the stakeholder groups would be compared to determine areas of agreement as well as areas of divergence