
Key Insights
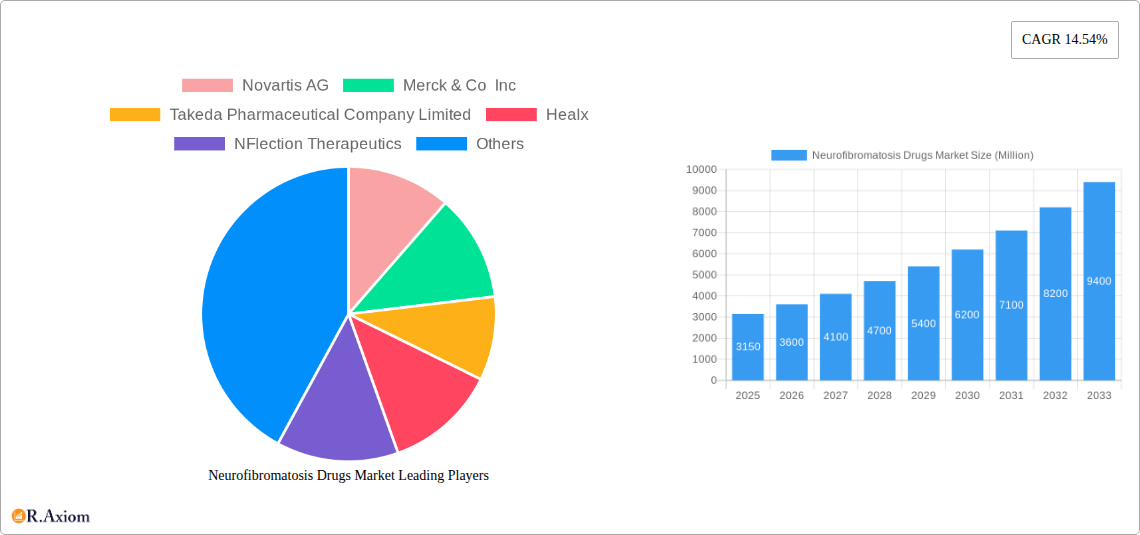
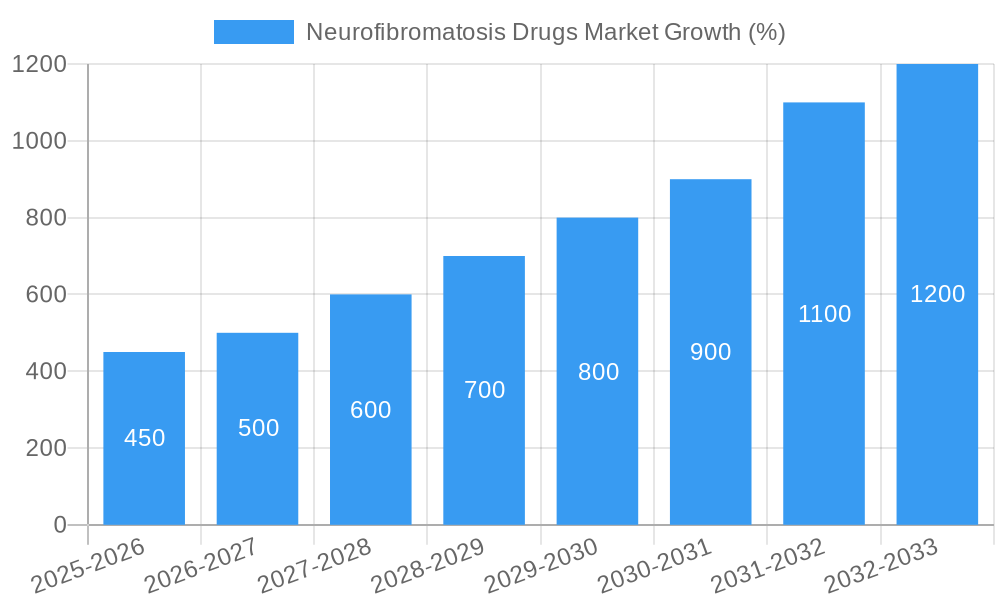
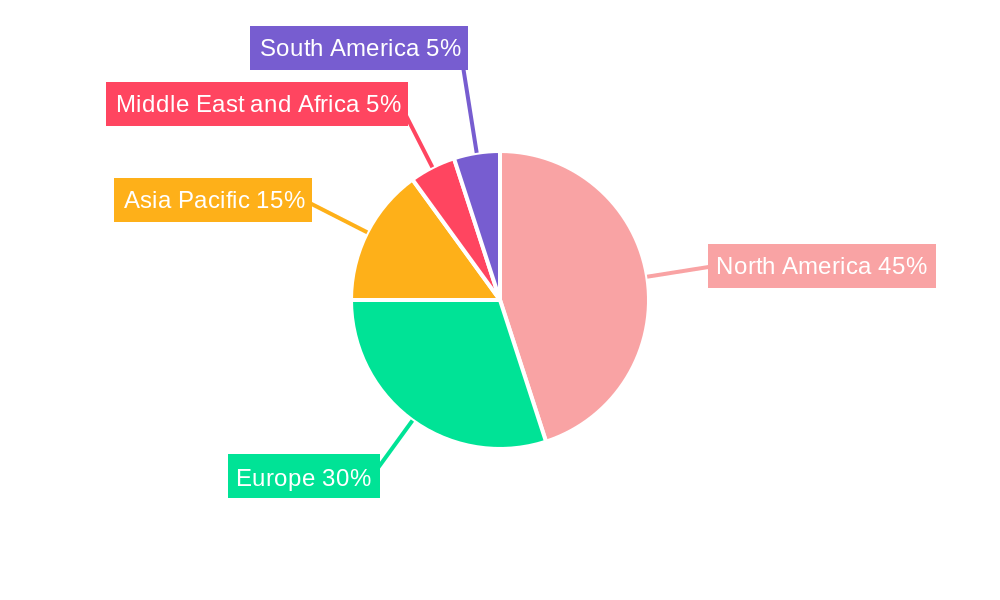
The Neurofibromatosis (NF) drugs market, valued at $3.15 billion in 2025, is poised for robust growth, projected to expand at a Compound Annual Growth Rate (CAGR) of 14.54% from 2025 to 2033. This significant expansion is driven by several factors. Increasing prevalence of NF1, NF2, and Schwannomatosis, coupled with heightened awareness and improved diagnostics, fuels demand for effective treatment options. The pipeline of novel therapies, including targeted therapies and gene therapies, offers substantial promise for improving patient outcomes and driving market growth. Furthermore, the growing involvement of pharmaceutical companies in research and development, along with increased investment in clinical trials, will significantly contribute to market expansion. The market is segmented by disease type (NF1, NF2, Schwannomatosis) and end-user (hospital pharmacies, drug stores, online pharmacies), with hospital pharmacies currently holding the largest market share due to the complex nature of NF treatment often requiring inpatient care. North America currently dominates the market, driven by high healthcare expenditure and advanced healthcare infrastructure, but the Asia Pacific region is anticipated to exhibit the highest growth rate due to increasing healthcare spending and rising prevalence of NF in developing economies.
The market's growth is, however, subject to certain restraints. The relatively low prevalence of NF compared to other neurological disorders, coupled with the complexities associated with drug development for rare diseases, might limit rapid market expansion. Additionally, high treatment costs and the need for long-term medication adherence could present challenges. However, ongoing research and development efforts focused on more targeted and effective therapies, along with supportive government initiatives aimed at enhancing patient access to these treatments, are expected to mitigate some of these limitations. The market's future trajectory will heavily depend on the success of ongoing clinical trials and the subsequent market entry of novel therapies. The successful launch of innovative therapies for specific NF subtypes will have a substantial impact on market size and segmentation.
Neurofibromatosis Drugs Market: A Comprehensive Report (2019-2033)
This detailed report provides a comprehensive analysis of the Neurofibromatosis Drugs Market from 2019 to 2033, offering invaluable insights for stakeholders across the pharmaceutical industry. The study period covers 2019-2024 (Historical Period), with 2025 as the Base Year and Estimated Year. The forecast period extends from 2025 to 2033. This report leverages rigorous data analysis to uncover key trends, opportunities, and challenges within this evolving market, focusing on market size (in Millions), CAGR, and competitive dynamics.
Neurofibromatosis Drugs Market Concentration & Innovation
The Neurofibromatosis drugs market exhibits a moderately concentrated landscape, with a few key players holding significant market share. While precise market share figures for each company remain proprietary, Novartis AG, Merck & Co Inc, and Takeda Pharmaceutical Company Limited are anticipated to be among the leading players, given their established presence in the oncology and rare disease therapeutics space. The market is witnessing a surge in innovation driven by advancements in targeted therapies, including the use of AI and machine learning in drug discovery. The regulatory framework, while stringent, is supportive of therapies addressing unmet medical needs such as those prevalent in neurofibromatosis. The competitive landscape is dynamic, characterized by strategic partnerships, mergers and acquisitions (M&A), and the continuous influx of novel drug candidates.
- M&A Activity: Recent M&A activity has been driven by the pursuit of promising drug pipelines and expansion into niche therapeutic areas. Deal values for major acquisitions in this space are currently estimated at xx Million. Smaller acquisitions and licensing agreements for specific molecules remain prevalent.
- Product Substitutes: Currently, there is a limited availability of effective substitutes for specific neurofibromatosis therapies. However, ongoing research into novel treatment modalities could present potential competition in the future.
- End-User Trends: Hospitals and specialized clinics form a key end-user segment due to the complex nature of Neurofibromatosis treatment. The shift towards personalized medicine is also shaping end-user preferences.
Neurofibromatosis Drugs Market Industry Trends & Insights
The Neurofibromatosis drugs market is characterized by robust growth, driven by increasing awareness of these rare disorders, advancements in targeted therapies, and a growing focus on personalized medicine approaches. The market witnessed a CAGR of xx% during the historical period (2019-2024), and is projected to maintain a healthy CAGR of xx% during the forecast period (2025-2033). This growth is further fueled by technological advancements that are accelerating the identification of novel therapeutic targets and improving diagnostic capabilities. The increasing availability of genetic testing is facilitating earlier diagnosis and the potential for prompt intervention. Market penetration of currently available treatments remains relatively low, providing significant room for expansion. The competitive landscape is fiercely competitive, with major pharmaceutical companies investing heavily in R&D and seeking strategic partnerships to bolster their drug pipelines.
Dominant Markets & Segments in Neurofibromatosis Drugs Market
The Neurofibromatosis drugs market is geographically diverse, with significant market presence across North America, Europe, and Asia-Pacific regions. While precise market share data for each region/country is confidential, North America is expected to dominate the market due to its advanced healthcare infrastructure and high level of awareness regarding rare diseases.
Disease Type Dominance:
- Neurofibromatosis Type 1 (NF1): This segment is expected to represent the largest share of the market due to its higher prevalence.
- Neurofibromatosis Type 2 (NF2): Although less prevalent than NF1, NF2 presents significant unmet medical needs, driving research and development efforts.
- Schwannomatosis: This rare form of neurofibromatosis represents a smaller market segment but possesses high growth potential given the lack of effective treatment options.
End-User Segment Dominance:
- Hospital Pharmacies: These facilities remain the primary distribution channel due to the complexities of these treatments.
- Drug Stores: While these outlets may play a secondary role, their accessibility could impact market expansion in the future.
- Online Pharmacies: The adoption of online pharmacies for specialized medications might increase, impacting market distribution dynamics.
Key Drivers:
- Increased healthcare expenditure: Growing healthcare spending in developed and emerging economies fuel market growth.
- Advancements in technology: Innovative technologies such as precision medicine and AI-powered drug discovery accelerate therapeutic development.
- Government initiatives and funding: Increased funding for rare disease research and treatment drives progress.
Neurofibromatosis Drugs Market Product Developments
The Neurofibromatosis drugs market is witnessing significant product innovations, driven by advancements in targeted therapies and a greater understanding of the disease mechanisms. New drug candidates are emerging, focused on inhibiting specific molecular pathways involved in tumor growth and progression. This includes the development of novel small molecules, biologics, and gene therapies. Many companies are leveraging AI-powered drug discovery platforms to expedite the identification and development of novel therapeutic agents. The focus on developing personalized therapies and treatment combinations based on patient genetic profiles is also driving market innovation.
Report Scope & Segmentation Analysis
This report segments the Neurofibromatosis drugs market across several key parameters:
Disease Type: Neurofibromatosis Type 1 (NF1), Neurofibromatosis Type 2 (NF2), Schwannomatosis. Each segment is analyzed based on its prevalence, treatment landscape, and projected growth.
End User: Hospital Pharmacies, Drug Stores, Online Pharmacies. Each segment's contribution to market size and future growth prospects are assessed.
The report includes granular market size estimations, CAGR projections, and a comprehensive competitive analysis for each segment. Competitive dynamics within each segment are deeply explored, including detailed competitive intensity assessments and an examination of strategic competitive moves.
Key Drivers of Neurofibromatosis Drugs Market Growth
The Neurofibromatosis drugs market's growth is driven by several factors: increasing prevalence of neurofibromatosis, significant unmet medical needs, ongoing R&D efforts focusing on targeted therapies, growing awareness among patients and healthcare professionals, supportive regulatory frameworks, and increased funding for rare disease research. The rising adoption of precision medicine approaches tailored to individual patient genetic profiles is another crucial driver. Technological advancements like AI in drug discovery and advanced imaging techniques contribute to the development of more effective treatment strategies.
Challenges in the Neurofibromatosis Drugs Market Sector
The Neurofibromatosis drugs market faces challenges such as the high cost of drug development and commercialization for rare diseases, limited reimbursement policies in certain regions, the complexities inherent in conducting clinical trials for rare diseases due to lower patient populations, and the potential for unforeseen side effects associated with novel therapeutic agents. Furthermore, competitive pressure from emerging biotech firms, regulatory hurdles, and challenges with patient enrollment in clinical trials can also impede market growth. The limited market size, compared to more prevalent diseases, makes investment less attractive for some larger pharma companies.
Emerging Opportunities in Neurofibromatosis Drugs Market
Significant opportunities exist for players in the Neurofibromatosis drugs market. These include the development of novel treatment approaches targeting specific molecular pathways, expansion into underserved geographical markets, leveraging AI and machine learning to accelerate drug discovery, personalized medicine approaches tailored to genetic variations and disease subtypes, and exploring innovative treatment combinations to enhance efficacy. Further opportunities involve strategic partnerships with patient advocacy groups to improve awareness and accessibility to treatments.
Leading Players in the Neurofibromatosis Drugs Market Market
- Novartis AG (Novartis)
- Merck & Co Inc (Merck)
- Takeda Pharmaceutical Company Limited (Takeda)
- Healx
- NFlection Therapeutics
- Recursion Pharmaceuticals
- SpringWorks Therapeutics
- AstraZeneca Pharmaceuticals (AstraZeneca)
- Fosun Pharmaceutical (Fosun Pharma)
- Pfizer Inc (Pfizer)
Key Developments in Neurofibromatosis Drugs Market Industry
- March 2024: SpringWorks Therapeutics initiated a new drug application for mirdametinib in pediatric and adult patients with neurofibromatosis type 1-associated plexiform neurofibromas. This development significantly impacts the market by offering a potentially new treatment option.
- April 2024: Healx entered an investment agreement with the Children's Tumor Foundation (CTF). This partnership, supporting the advancement of Healx's AI-powered neurofibromatosis strategy, including its lead molecule HLX-1502, which is about to enter a Phase 2 clinical trial, could accelerate the development of novel therapies and significantly influence market dynamics.
Strategic Outlook for Neurofibromatosis Drugs Market Market
The Neurofibromatosis drugs market holds substantial growth potential. Ongoing research and development efforts, coupled with the increasing focus on precision medicine, will fuel market expansion. The entry of novel therapeutic agents into the market and the continuous improvement of diagnostic tools will enhance treatment options. Strategic collaborations between pharmaceutical companies, research institutions, and patient advocacy groups will drive innovation and improve the overall market landscape. The market's future growth will be significantly influenced by the success of ongoing clinical trials and the regulatory approvals of new therapies. Companies focused on personalized medicine approaches stand to gain significant market share.
Neurofibromatosis Drugs Market Segmentation
-
1. Disease Type
- 1.1. Neurofibromatosis Type 1 (NF1)
- 1.2. Neurofibromatosis Type 2 (NF2)
- 1.3. Schwannomatosis
-
2. End User
- 2.1. Hospital Pharmacies
- 2.2. Drug Stores
- 2.3. Online Pharmacies
Neurofibromatosis Drugs Market Segmentation By Geography
-
1. North America
- 1.1. United States
- 1.2. Canada
- 1.3. Mexico
-
2. Europe
- 2.1. Germany
- 2.2. United Kingdom
- 2.3. France
- 2.4. Italy
- 2.5. Spain
- 2.6. Rest of Europe
-
3. Asia Pacific
- 3.1. China
- 3.2. Japan
- 3.3. India
- 3.4. Australia
- 3.5. South Korea
- 3.6. Rest of Asia Pacific
-
4. Middle East and Africa
- 4.1. GCC
- 4.2. South Africa
- 4.3. Rest of Middle East and Africa
-
5. South America
- 5.1. Brazil
- 5.2. Argentina
- 5.3. Rest of South America
Neurofibromatosis Drugs Market REPORT HIGHLIGHTS
| Aspects | Details |
|---|---|
| Study Period | 2019-2033 |
| Base Year | 2024 |
| Estimated Year | 2025 |
| Forecast Period | 2025-2033 |
| Historical Period | 2019-2024 |
| Growth Rate | CAGR of 14.54% from 2019-2033 |
| Segmentation |
|
Table of Contents
- 1. Introduction
- 1.1. Research Scope
- 1.2. Market Segmentation
- 1.3. Research Methodology
- 1.4. Definitions and Assumptions
- 2. Executive Summary
- 2.1. Introduction
- 3. Market Dynamics
- 3.1. Introduction
- 3.2. Market Drivers
- 3.2.1. Increased Focus on Research and Development of Novel Therapies; Support from Regulatory Authorities
- 3.3. Market Restrains
- 3.3.1. Difficulty in Conducting Clinical Trials for Pediatric Population; Low treatment Rate in Developing Countries due to Lack of Treatment Options
- 3.4. Market Trends
- 3.4.1. Neurofibromatosis Type 1 (NF1) is Expected to Show Healthy Market Growth During the Forecast Period
- 4. Market Factor Analysis
- 4.1. Porters Five Forces
- 4.2. Supply/Value Chain
- 4.3. PESTEL analysis
- 4.4. Market Entropy
- 4.5. Patent/Trademark Analysis
- 5. Global Neurofibromatosis Drugs Market Analysis, Insights and Forecast, 2019-2031
- 5.1. Market Analysis, Insights and Forecast - by Disease Type
- 5.1.1. Neurofibromatosis Type 1 (NF1)
- 5.1.2. Neurofibromatosis Type 2 (NF2)
- 5.1.3. Schwannomatosis
- 5.2. Market Analysis, Insights and Forecast - by End User
- 5.2.1. Hospital Pharmacies
- 5.2.2. Drug Stores
- 5.2.3. Online Pharmacies
- 5.3. Market Analysis, Insights and Forecast - by Region
- 5.3.1. North America
- 5.3.2. Europe
- 5.3.3. Asia Pacific
- 5.3.4. Middle East and Africa
- 5.3.5. South America
- 5.1. Market Analysis, Insights and Forecast - by Disease Type
- 6. North America Neurofibromatosis Drugs Market Analysis, Insights and Forecast, 2019-2031
- 6.1. Market Analysis, Insights and Forecast - by Disease Type
- 6.1.1. Neurofibromatosis Type 1 (NF1)
- 6.1.2. Neurofibromatosis Type 2 (NF2)
- 6.1.3. Schwannomatosis
- 6.2. Market Analysis, Insights and Forecast - by End User
- 6.2.1. Hospital Pharmacies
- 6.2.2. Drug Stores
- 6.2.3. Online Pharmacies
- 6.1. Market Analysis, Insights and Forecast - by Disease Type
- 7. Europe Neurofibromatosis Drugs Market Analysis, Insights and Forecast, 2019-2031
- 7.1. Market Analysis, Insights and Forecast - by Disease Type
- 7.1.1. Neurofibromatosis Type 1 (NF1)
- 7.1.2. Neurofibromatosis Type 2 (NF2)
- 7.1.3. Schwannomatosis
- 7.2. Market Analysis, Insights and Forecast - by End User
- 7.2.1. Hospital Pharmacies
- 7.2.2. Drug Stores
- 7.2.3. Online Pharmacies
- 7.1. Market Analysis, Insights and Forecast - by Disease Type
- 8. Asia Pacific Neurofibromatosis Drugs Market Analysis, Insights and Forecast, 2019-2031
- 8.1. Market Analysis, Insights and Forecast - by Disease Type
- 8.1.1. Neurofibromatosis Type 1 (NF1)
- 8.1.2. Neurofibromatosis Type 2 (NF2)
- 8.1.3. Schwannomatosis
- 8.2. Market Analysis, Insights and Forecast - by End User
- 8.2.1. Hospital Pharmacies
- 8.2.2. Drug Stores
- 8.2.3. Online Pharmacies
- 8.1. Market Analysis, Insights and Forecast - by Disease Type
- 9. Middle East and Africa Neurofibromatosis Drugs Market Analysis, Insights and Forecast, 2019-2031
- 9.1. Market Analysis, Insights and Forecast - by Disease Type
- 9.1.1. Neurofibromatosis Type 1 (NF1)
- 9.1.2. Neurofibromatosis Type 2 (NF2)
- 9.1.3. Schwannomatosis
- 9.2. Market Analysis, Insights and Forecast - by End User
- 9.2.1. Hospital Pharmacies
- 9.2.2. Drug Stores
- 9.2.3. Online Pharmacies
- 9.1. Market Analysis, Insights and Forecast - by Disease Type
- 10. South America Neurofibromatosis Drugs Market Analysis, Insights and Forecast, 2019-2031
- 10.1. Market Analysis, Insights and Forecast - by Disease Type
- 10.1.1. Neurofibromatosis Type 1 (NF1)
- 10.1.2. Neurofibromatosis Type 2 (NF2)
- 10.1.3. Schwannomatosis
- 10.2. Market Analysis, Insights and Forecast - by End User
- 10.2.1. Hospital Pharmacies
- 10.2.2. Drug Stores
- 10.2.3. Online Pharmacies
- 10.1. Market Analysis, Insights and Forecast - by Disease Type
- 11. North America Neurofibromatosis Drugs Market Analysis, Insights and Forecast, 2019-2031
- 11.1. Market Analysis, Insights and Forecast - By Country/Sub-region
- 11.1.1. undefined
- 12. Europe Neurofibromatosis Drugs Market Analysis, Insights and Forecast, 2019-2031
- 12.1. Market Analysis, Insights and Forecast - By Country/Sub-region
- 12.1.1. undefined
- 13. Asia Pacific Neurofibromatosis Drugs Market Analysis, Insights and Forecast, 2019-2031
- 13.1. Market Analysis, Insights and Forecast - By Country/Sub-region
- 13.1.1. undefined
- 14. Middle East and Africa Neurofibromatosis Drugs Market Analysis, Insights and Forecast, 2019-2031
- 14.1. Market Analysis, Insights and Forecast - By Country/Sub-region
- 14.1.1. undefined
- 15. South America Neurofibromatosis Drugs Market Analysis, Insights and Forecast, 2019-2031
- 15.1. Market Analysis, Insights and Forecast - By Country/Sub-region
- 15.1.1. undefined
- 16. Competitive Analysis
- 16.1. Global Market Share Analysis 2024
- 16.2. Company Profiles
- 16.2.1 Novartis AG
- 16.2.1.1. Overview
- 16.2.1.2. Products
- 16.2.1.3. SWOT Analysis
- 16.2.1.4. Recent Developments
- 16.2.1.5. Financials (Based on Availability)
- 16.2.2 Merck & Co Inc
- 16.2.2.1. Overview
- 16.2.2.2. Products
- 16.2.2.3. SWOT Analysis
- 16.2.2.4. Recent Developments
- 16.2.2.5. Financials (Based on Availability)
- 16.2.3 Takeda Pharmaceutical Company Limited
- 16.2.3.1. Overview
- 16.2.3.2. Products
- 16.2.3.3. SWOT Analysis
- 16.2.3.4. Recent Developments
- 16.2.3.5. Financials (Based on Availability)
- 16.2.4 Healx
- 16.2.4.1. Overview
- 16.2.4.2. Products
- 16.2.4.3. SWOT Analysis
- 16.2.4.4. Recent Developments
- 16.2.4.5. Financials (Based on Availability)
- 16.2.5 NFlection Therapeutics
- 16.2.5.1. Overview
- 16.2.5.2. Products
- 16.2.5.3. SWOT Analysis
- 16.2.5.4. Recent Developments
- 16.2.5.5. Financials (Based on Availability)
- 16.2.6 Recursion Pharmaceuticals
- 16.2.6.1. Overview
- 16.2.6.2. Products
- 16.2.6.3. SWOT Analysis
- 16.2.6.4. Recent Developments
- 16.2.6.5. Financials (Based on Availability)
- 16.2.7 SpringWorks Therapeutics
- 16.2.7.1. Overview
- 16.2.7.2. Products
- 16.2.7.3. SWOT Analysis
- 16.2.7.4. Recent Developments
- 16.2.7.5. Financials (Based on Availability)
- 16.2.8 AstraZeneca Pharmaceuticals
- 16.2.8.1. Overview
- 16.2.8.2. Products
- 16.2.8.3. SWOT Analysis
- 16.2.8.4. Recent Developments
- 16.2.8.5. Financials (Based on Availability)
- 16.2.9 Fosun Pharmaceutical
- 16.2.9.1. Overview
- 16.2.9.2. Products
- 16.2.9.3. SWOT Analysis
- 16.2.9.4. Recent Developments
- 16.2.9.5. Financials (Based on Availability)
- 16.2.10 Pfizer Inc
- 16.2.10.1. Overview
- 16.2.10.2. Products
- 16.2.10.3. SWOT Analysis
- 16.2.10.4. Recent Developments
- 16.2.10.5. Financials (Based on Availability)
- 16.2.1 Novartis AG
List of Figures
- Figure 1: Global Neurofibromatosis Drugs Market Revenue Breakdown (Million, %) by Region 2024 & 2032
- Figure 2: Global Neurofibromatosis Drugs Market Volume Breakdown (K Unit, %) by Region 2024 & 2032
- Figure 3: North America Neurofibromatosis Drugs Market Revenue (Million), by Country 2024 & 2032
- Figure 4: North America Neurofibromatosis Drugs Market Volume (K Unit), by Country 2024 & 2032
- Figure 5: North America Neurofibromatosis Drugs Market Revenue Share (%), by Country 2024 & 2032
- Figure 6: North America Neurofibromatosis Drugs Market Volume Share (%), by Country 2024 & 2032
- Figure 7: Europe Neurofibromatosis Drugs Market Revenue (Million), by Country 2024 & 2032
- Figure 8: Europe Neurofibromatosis Drugs Market Volume (K Unit), by Country 2024 & 2032
- Figure 9: Europe Neurofibromatosis Drugs Market Revenue Share (%), by Country 2024 & 2032
- Figure 10: Europe Neurofibromatosis Drugs Market Volume Share (%), by Country 2024 & 2032
- Figure 11: Asia Pacific Neurofibromatosis Drugs Market Revenue (Million), by Country 2024 & 2032
- Figure 12: Asia Pacific Neurofibromatosis Drugs Market Volume (K Unit), by Country 2024 & 2032
- Figure 13: Asia Pacific Neurofibromatosis Drugs Market Revenue Share (%), by Country 2024 & 2032
- Figure 14: Asia Pacific Neurofibromatosis Drugs Market Volume Share (%), by Country 2024 & 2032
- Figure 15: Middle East and Africa Neurofibromatosis Drugs Market Revenue (Million), by Country 2024 & 2032
- Figure 16: Middle East and Africa Neurofibromatosis Drugs Market Volume (K Unit), by Country 2024 & 2032
- Figure 17: Middle East and Africa Neurofibromatosis Drugs Market Revenue Share (%), by Country 2024 & 2032
- Figure 18: Middle East and Africa Neurofibromatosis Drugs Market Volume Share (%), by Country 2024 & 2032
- Figure 19: South America Neurofibromatosis Drugs Market Revenue (Million), by Country 2024 & 2032
- Figure 20: South America Neurofibromatosis Drugs Market Volume (K Unit), by Country 2024 & 2032
- Figure 21: South America Neurofibromatosis Drugs Market Revenue Share (%), by Country 2024 & 2032
- Figure 22: South America Neurofibromatosis Drugs Market Volume Share (%), by Country 2024 & 2032
- Figure 23: North America Neurofibromatosis Drugs Market Revenue (Million), by Disease Type 2024 & 2032
- Figure 24: North America Neurofibromatosis Drugs Market Volume (K Unit), by Disease Type 2024 & 2032
- Figure 25: North America Neurofibromatosis Drugs Market Revenue Share (%), by Disease Type 2024 & 2032
- Figure 26: North America Neurofibromatosis Drugs Market Volume Share (%), by Disease Type 2024 & 2032
- Figure 27: North America Neurofibromatosis Drugs Market Revenue (Million), by End User 2024 & 2032
- Figure 28: North America Neurofibromatosis Drugs Market Volume (K Unit), by End User 2024 & 2032
- Figure 29: North America Neurofibromatosis Drugs Market Revenue Share (%), by End User 2024 & 2032
- Figure 30: North America Neurofibromatosis Drugs Market Volume Share (%), by End User 2024 & 2032
- Figure 31: North America Neurofibromatosis Drugs Market Revenue (Million), by Country 2024 & 2032
- Figure 32: North America Neurofibromatosis Drugs Market Volume (K Unit), by Country 2024 & 2032
- Figure 33: North America Neurofibromatosis Drugs Market Revenue Share (%), by Country 2024 & 2032
- Figure 34: North America Neurofibromatosis Drugs Market Volume Share (%), by Country 2024 & 2032
- Figure 35: Europe Neurofibromatosis Drugs Market Revenue (Million), by Disease Type 2024 & 2032
- Figure 36: Europe Neurofibromatosis Drugs Market Volume (K Unit), by Disease Type 2024 & 2032
- Figure 37: Europe Neurofibromatosis Drugs Market Revenue Share (%), by Disease Type 2024 & 2032
- Figure 38: Europe Neurofibromatosis Drugs Market Volume Share (%), by Disease Type 2024 & 2032
- Figure 39: Europe Neurofibromatosis Drugs Market Revenue (Million), by End User 2024 & 2032
- Figure 40: Europe Neurofibromatosis Drugs Market Volume (K Unit), by End User 2024 & 2032
- Figure 41: Europe Neurofibromatosis Drugs Market Revenue Share (%), by End User 2024 & 2032
- Figure 42: Europe Neurofibromatosis Drugs Market Volume Share (%), by End User 2024 & 2032
- Figure 43: Europe Neurofibromatosis Drugs Market Revenue (Million), by Country 2024 & 2032
- Figure 44: Europe Neurofibromatosis Drugs Market Volume (K Unit), by Country 2024 & 2032
- Figure 45: Europe Neurofibromatosis Drugs Market Revenue Share (%), by Country 2024 & 2032
- Figure 46: Europe Neurofibromatosis Drugs Market Volume Share (%), by Country 2024 & 2032
- Figure 47: Asia Pacific Neurofibromatosis Drugs Market Revenue (Million), by Disease Type 2024 & 2032
- Figure 48: Asia Pacific Neurofibromatosis Drugs Market Volume (K Unit), by Disease Type 2024 & 2032
- Figure 49: Asia Pacific Neurofibromatosis Drugs Market Revenue Share (%), by Disease Type 2024 & 2032
- Figure 50: Asia Pacific Neurofibromatosis Drugs Market Volume Share (%), by Disease Type 2024 & 2032
- Figure 51: Asia Pacific Neurofibromatosis Drugs Market Revenue (Million), by End User 2024 & 2032
- Figure 52: Asia Pacific Neurofibromatosis Drugs Market Volume (K Unit), by End User 2024 & 2032
- Figure 53: Asia Pacific Neurofibromatosis Drugs Market Revenue Share (%), by End User 2024 & 2032
- Figure 54: Asia Pacific Neurofibromatosis Drugs Market Volume Share (%), by End User 2024 & 2032
- Figure 55: Asia Pacific Neurofibromatosis Drugs Market Revenue (Million), by Country 2024 & 2032
- Figure 56: Asia Pacific Neurofibromatosis Drugs Market Volume (K Unit), by Country 2024 & 2032
- Figure 57: Asia Pacific Neurofibromatosis Drugs Market Revenue Share (%), by Country 2024 & 2032
- Figure 58: Asia Pacific Neurofibromatosis Drugs Market Volume Share (%), by Country 2024 & 2032
- Figure 59: Middle East and Africa Neurofibromatosis Drugs Market Revenue (Million), by Disease Type 2024 & 2032
- Figure 60: Middle East and Africa Neurofibromatosis Drugs Market Volume (K Unit), by Disease Type 2024 & 2032
- Figure 61: Middle East and Africa Neurofibromatosis Drugs Market Revenue Share (%), by Disease Type 2024 & 2032
- Figure 62: Middle East and Africa Neurofibromatosis Drugs Market Volume Share (%), by Disease Type 2024 & 2032
- Figure 63: Middle East and Africa Neurofibromatosis Drugs Market Revenue (Million), by End User 2024 & 2032
- Figure 64: Middle East and Africa Neurofibromatosis Drugs Market Volume (K Unit), by End User 2024 & 2032
- Figure 65: Middle East and Africa Neurofibromatosis Drugs Market Revenue Share (%), by End User 2024 & 2032
- Figure 66: Middle East and Africa Neurofibromatosis Drugs Market Volume Share (%), by End User 2024 & 2032
- Figure 67: Middle East and Africa Neurofibromatosis Drugs Market Revenue (Million), by Country 2024 & 2032
- Figure 68: Middle East and Africa Neurofibromatosis Drugs Market Volume (K Unit), by Country 2024 & 2032
- Figure 69: Middle East and Africa Neurofibromatosis Drugs Market Revenue Share (%), by Country 2024 & 2032
- Figure 70: Middle East and Africa Neurofibromatosis Drugs Market Volume Share (%), by Country 2024 & 2032
- Figure 71: South America Neurofibromatosis Drugs Market Revenue (Million), by Disease Type 2024 & 2032
- Figure 72: South America Neurofibromatosis Drugs Market Volume (K Unit), by Disease Type 2024 & 2032
- Figure 73: South America Neurofibromatosis Drugs Market Revenue Share (%), by Disease Type 2024 & 2032
- Figure 74: South America Neurofibromatosis Drugs Market Volume Share (%), by Disease Type 2024 & 2032
- Figure 75: South America Neurofibromatosis Drugs Market Revenue (Million), by End User 2024 & 2032
- Figure 76: South America Neurofibromatosis Drugs Market Volume (K Unit), by End User 2024 & 2032
- Figure 77: South America Neurofibromatosis Drugs Market Revenue Share (%), by End User 2024 & 2032
- Figure 78: South America Neurofibromatosis Drugs Market Volume Share (%), by End User 2024 & 2032
- Figure 79: South America Neurofibromatosis Drugs Market Revenue (Million), by Country 2024 & 2032
- Figure 80: South America Neurofibromatosis Drugs Market Volume (K Unit), by Country 2024 & 2032
- Figure 81: South America Neurofibromatosis Drugs Market Revenue Share (%), by Country 2024 & 2032
- Figure 82: South America Neurofibromatosis Drugs Market Volume Share (%), by Country 2024 & 2032
List of Tables
- Table 1: Global Neurofibromatosis Drugs Market Revenue Million Forecast, by Region 2019 & 2032
- Table 2: Global Neurofibromatosis Drugs Market Volume K Unit Forecast, by Region 2019 & 2032
- Table 3: Global Neurofibromatosis Drugs Market Revenue Million Forecast, by Disease Type 2019 & 2032
- Table 4: Global Neurofibromatosis Drugs Market Volume K Unit Forecast, by Disease Type 2019 & 2032
- Table 5: Global Neurofibromatosis Drugs Market Revenue Million Forecast, by End User 2019 & 2032
- Table 6: Global Neurofibromatosis Drugs Market Volume K Unit Forecast, by End User 2019 & 2032
- Table 7: Global Neurofibromatosis Drugs Market Revenue Million Forecast, by Region 2019 & 2032
- Table 8: Global Neurofibromatosis Drugs Market Volume K Unit Forecast, by Region 2019 & 2032
- Table 9: Global Neurofibromatosis Drugs Market Revenue Million Forecast, by Country 2019 & 2032
- Table 10: Global Neurofibromatosis Drugs Market Volume K Unit Forecast, by Country 2019 & 2032
- Table 11: Global Neurofibromatosis Drugs Market Revenue Million Forecast, by Country 2019 & 2032
- Table 12: Global Neurofibromatosis Drugs Market Volume K Unit Forecast, by Country 2019 & 2032
- Table 13: Global Neurofibromatosis Drugs Market Revenue Million Forecast, by Country 2019 & 2032
- Table 14: Global Neurofibromatosis Drugs Market Volume K Unit Forecast, by Country 2019 & 2032
- Table 15: Global Neurofibromatosis Drugs Market Revenue Million Forecast, by Country 2019 & 2032
- Table 16: Global Neurofibromatosis Drugs Market Volume K Unit Forecast, by Country 2019 & 2032
- Table 17: Global Neurofibromatosis Drugs Market Revenue Million Forecast, by Country 2019 & 2032
- Table 18: Global Neurofibromatosis Drugs Market Volume K Unit Forecast, by Country 2019 & 2032
- Table 19: Global Neurofibromatosis Drugs Market Revenue Million Forecast, by Disease Type 2019 & 2032
- Table 20: Global Neurofibromatosis Drugs Market Volume K Unit Forecast, by Disease Type 2019 & 2032
- Table 21: Global Neurofibromatosis Drugs Market Revenue Million Forecast, by End User 2019 & 2032
- Table 22: Global Neurofibromatosis Drugs Market Volume K Unit Forecast, by End User 2019 & 2032
- Table 23: Global Neurofibromatosis Drugs Market Revenue Million Forecast, by Country 2019 & 2032
- Table 24: Global Neurofibromatosis Drugs Market Volume K Unit Forecast, by Country 2019 & 2032
- Table 25: United States Neurofibromatosis Drugs Market Revenue (Million) Forecast, by Application 2019 & 2032
- Table 26: United States Neurofibromatosis Drugs Market Volume (K Unit) Forecast, by Application 2019 & 2032
- Table 27: Canada Neurofibromatosis Drugs Market Revenue (Million) Forecast, by Application 2019 & 2032
- Table 28: Canada Neurofibromatosis Drugs Market Volume (K Unit) Forecast, by Application 2019 & 2032
- Table 29: Mexico Neurofibromatosis Drugs Market Revenue (Million) Forecast, by Application 2019 & 2032
- Table 30: Mexico Neurofibromatosis Drugs Market Volume (K Unit) Forecast, by Application 2019 & 2032
- Table 31: Global Neurofibromatosis Drugs Market Revenue Million Forecast, by Disease Type 2019 & 2032
- Table 32: Global Neurofibromatosis Drugs Market Volume K Unit Forecast, by Disease Type 2019 & 2032
- Table 33: Global Neurofibromatosis Drugs Market Revenue Million Forecast, by End User 2019 & 2032
- Table 34: Global Neurofibromatosis Drugs Market Volume K Unit Forecast, by End User 2019 & 2032
- Table 35: Global Neurofibromatosis Drugs Market Revenue Million Forecast, by Country 2019 & 2032
- Table 36: Global Neurofibromatosis Drugs Market Volume K Unit Forecast, by Country 2019 & 2032
- Table 37: Germany Neurofibromatosis Drugs Market Revenue (Million) Forecast, by Application 2019 & 2032
- Table 38: Germany Neurofibromatosis Drugs Market Volume (K Unit) Forecast, by Application 2019 & 2032
- Table 39: United Kingdom Neurofibromatosis Drugs Market Revenue (Million) Forecast, by Application 2019 & 2032
- Table 40: United Kingdom Neurofibromatosis Drugs Market Volume (K Unit) Forecast, by Application 2019 & 2032
- Table 41: France Neurofibromatosis Drugs Market Revenue (Million) Forecast, by Application 2019 & 2032
- Table 42: France Neurofibromatosis Drugs Market Volume (K Unit) Forecast, by Application 2019 & 2032
- Table 43: Italy Neurofibromatosis Drugs Market Revenue (Million) Forecast, by Application 2019 & 2032
- Table 44: Italy Neurofibromatosis Drugs Market Volume (K Unit) Forecast, by Application 2019 & 2032
- Table 45: Spain Neurofibromatosis Drugs Market Revenue (Million) Forecast, by Application 2019 & 2032
- Table 46: Spain Neurofibromatosis Drugs Market Volume (K Unit) Forecast, by Application 2019 & 2032
- Table 47: Rest of Europe Neurofibromatosis Drugs Market Revenue (Million) Forecast, by Application 2019 & 2032
- Table 48: Rest of Europe Neurofibromatosis Drugs Market Volume (K Unit) Forecast, by Application 2019 & 2032
- Table 49: Global Neurofibromatosis Drugs Market Revenue Million Forecast, by Disease Type 2019 & 2032
- Table 50: Global Neurofibromatosis Drugs Market Volume K Unit Forecast, by Disease Type 2019 & 2032
- Table 51: Global Neurofibromatosis Drugs Market Revenue Million Forecast, by End User 2019 & 2032
- Table 52: Global Neurofibromatosis Drugs Market Volume K Unit Forecast, by End User 2019 & 2032
- Table 53: Global Neurofibromatosis Drugs Market Revenue Million Forecast, by Country 2019 & 2032
- Table 54: Global Neurofibromatosis Drugs Market Volume K Unit Forecast, by Country 2019 & 2032
- Table 55: China Neurofibromatosis Drugs Market Revenue (Million) Forecast, by Application 2019 & 2032
- Table 56: China Neurofibromatosis Drugs Market Volume (K Unit) Forecast, by Application 2019 & 2032
- Table 57: Japan Neurofibromatosis Drugs Market Revenue (Million) Forecast, by Application 2019 & 2032
- Table 58: Japan Neurofibromatosis Drugs Market Volume (K Unit) Forecast, by Application 2019 & 2032
- Table 59: India Neurofibromatosis Drugs Market Revenue (Million) Forecast, by Application 2019 & 2032
- Table 60: India Neurofibromatosis Drugs Market Volume (K Unit) Forecast, by Application 2019 & 2032
- Table 61: Australia Neurofibromatosis Drugs Market Revenue (Million) Forecast, by Application 2019 & 2032
- Table 62: Australia Neurofibromatosis Drugs Market Volume (K Unit) Forecast, by Application 2019 & 2032
- Table 63: South Korea Neurofibromatosis Drugs Market Revenue (Million) Forecast, by Application 2019 & 2032
- Table 64: South Korea Neurofibromatosis Drugs Market Volume (K Unit) Forecast, by Application 2019 & 2032
- Table 65: Rest of Asia Pacific Neurofibromatosis Drugs Market Revenue (Million) Forecast, by Application 2019 & 2032
- Table 66: Rest of Asia Pacific Neurofibromatosis Drugs Market Volume (K Unit) Forecast, by Application 2019 & 2032
- Table 67: Global Neurofibromatosis Drugs Market Revenue Million Forecast, by Disease Type 2019 & 2032
- Table 68: Global Neurofibromatosis Drugs Market Volume K Unit Forecast, by Disease Type 2019 & 2032
- Table 69: Global Neurofibromatosis Drugs Market Revenue Million Forecast, by End User 2019 & 2032
- Table 70: Global Neurofibromatosis Drugs Market Volume K Unit Forecast, by End User 2019 & 2032
- Table 71: Global Neurofibromatosis Drugs Market Revenue Million Forecast, by Country 2019 & 2032
- Table 72: Global Neurofibromatosis Drugs Market Volume K Unit Forecast, by Country 2019 & 2032
- Table 73: GCC Neurofibromatosis Drugs Market Revenue (Million) Forecast, by Application 2019 & 2032
- Table 74: GCC Neurofibromatosis Drugs Market Volume (K Unit) Forecast, by Application 2019 & 2032
- Table 75: South Africa Neurofibromatosis Drugs Market Revenue (Million) Forecast, by Application 2019 & 2032
- Table 76: South Africa Neurofibromatosis Drugs Market Volume (K Unit) Forecast, by Application 2019 & 2032
- Table 77: Rest of Middle East and Africa Neurofibromatosis Drugs Market Revenue (Million) Forecast, by Application 2019 & 2032
- Table 78: Rest of Middle East and Africa Neurofibromatosis Drugs Market Volume (K Unit) Forecast, by Application 2019 & 2032
- Table 79: Global Neurofibromatosis Drugs Market Revenue Million Forecast, by Disease Type 2019 & 2032
- Table 80: Global Neurofibromatosis Drugs Market Volume K Unit Forecast, by Disease Type 2019 & 2032
- Table 81: Global Neurofibromatosis Drugs Market Revenue Million Forecast, by End User 2019 & 2032
- Table 82: Global Neurofibromatosis Drugs Market Volume K Unit Forecast, by End User 2019 & 2032
- Table 83: Global Neurofibromatosis Drugs Market Revenue Million Forecast, by Country 2019 & 2032
- Table 84: Global Neurofibromatosis Drugs Market Volume K Unit Forecast, by Country 2019 & 2032
- Table 85: Brazil Neurofibromatosis Drugs Market Revenue (Million) Forecast, by Application 2019 & 2032
- Table 86: Brazil Neurofibromatosis Drugs Market Volume (K Unit) Forecast, by Application 2019 & 2032
- Table 87: Argentina Neurofibromatosis Drugs Market Revenue (Million) Forecast, by Application 2019 & 2032
- Table 88: Argentina Neurofibromatosis Drugs Market Volume (K Unit) Forecast, by Application 2019 & 2032
- Table 89: Rest of South America Neurofibromatosis Drugs Market Revenue (Million) Forecast, by Application 2019 & 2032
- Table 90: Rest of South America Neurofibromatosis Drugs Market Volume (K Unit) Forecast, by Application 2019 & 2032
Frequently Asked Questions
1. What is the projected Compound Annual Growth Rate (CAGR) of the Neurofibromatosis Drugs Market?
The projected CAGR is approximately 14.54%.
2. Which companies are prominent players in the Neurofibromatosis Drugs Market?
Key companies in the market include Novartis AG, Merck & Co Inc, Takeda Pharmaceutical Company Limited, Healx, NFlection Therapeutics, Recursion Pharmaceuticals, SpringWorks Therapeutics, AstraZeneca Pharmaceuticals, Fosun Pharmaceutical, Pfizer Inc.
3. What are the main segments of the Neurofibromatosis Drugs Market?
The market segments include Disease Type, End User.
4. Can you provide details about the market size?
The market size is estimated to be USD 3.15 Million as of 2022.
5. What are some drivers contributing to market growth?
Increased Focus on Research and Development of Novel Therapies; Support from Regulatory Authorities.
6. What are the notable trends driving market growth?
Neurofibromatosis Type 1 (NF1) is Expected to Show Healthy Market Growth During the Forecast Period.
7. Are there any restraints impacting market growth?
Difficulty in Conducting Clinical Trials for Pediatric Population; Low treatment Rate in Developing Countries due to Lack of Treatment Options.
8. Can you provide examples of recent developments in the market?
April 2024: Healx entered an investment agreement with the Children's Tumor Foundation (CTF). This partnership will support the advancement of Healx's AI-powered neurofibromatosis strategy, including its lead molecule, HLX-1502, which is about to enter a Phase 2 clinical trial.
9. What pricing options are available for accessing the report?
Pricing options include single-user, multi-user, and enterprise licenses priced at USD 4750, USD 5250, and USD 8750 respectively.
10. Is the market size provided in terms of value or volume?
The market size is provided in terms of value, measured in Million and volume, measured in K Unit.
11. Are there any specific market keywords associated with the report?
Yes, the market keyword associated with the report is "Neurofibromatosis Drugs Market," which aids in identifying and referencing the specific market segment covered.
12. How do I determine which pricing option suits my needs best?
The pricing options vary based on user requirements and access needs. Individual users may opt for single-user licenses, while businesses requiring broader access may choose multi-user or enterprise licenses for cost-effective access to the report.
13. Are there any additional resources or data provided in the Neurofibromatosis Drugs Market report?
While the report offers comprehensive insights, it's advisable to review the specific contents or supplementary materials provided to ascertain if additional resources or data are available.
14. How can I stay updated on further developments or reports in the Neurofibromatosis Drugs Market?
To stay informed about further developments, trends, and reports in the Neurofibromatosis Drugs Market, consider subscribing to industry newsletters, following relevant companies and organizations, or regularly checking reputable industry news sources and publications.
Methodology
Step 1 - Identification of Relevant Samples Size from Population Database


Step 2 - Approaches for Defining Global Market Size (Value, Volume* & Price*)

Note*: In applicable scenarios
Step 3 - Data Sources
Primary Research
- Web Analytics
- Survey Reports
- Research Institute
- Latest Research Reports
- Opinion Leaders
Secondary Research
- Annual Reports
- White Paper
- Latest Press Release
- Industry Association
- Paid Database
- Investor Presentations

Step 4 - Data Triangulation
Involves using different sources of information in order to increase the validity of a study
These sources are likely to be stakeholders in a program - participants, other researchers, program staff, other community members, and so on.
Then we put all data in single framework & apply various statistical tools to find out the dynamic on the market.
During the analysis stage, feedback from the stakeholder groups would be compared to determine areas of agreement as well as areas of divergence


