
Key Insights
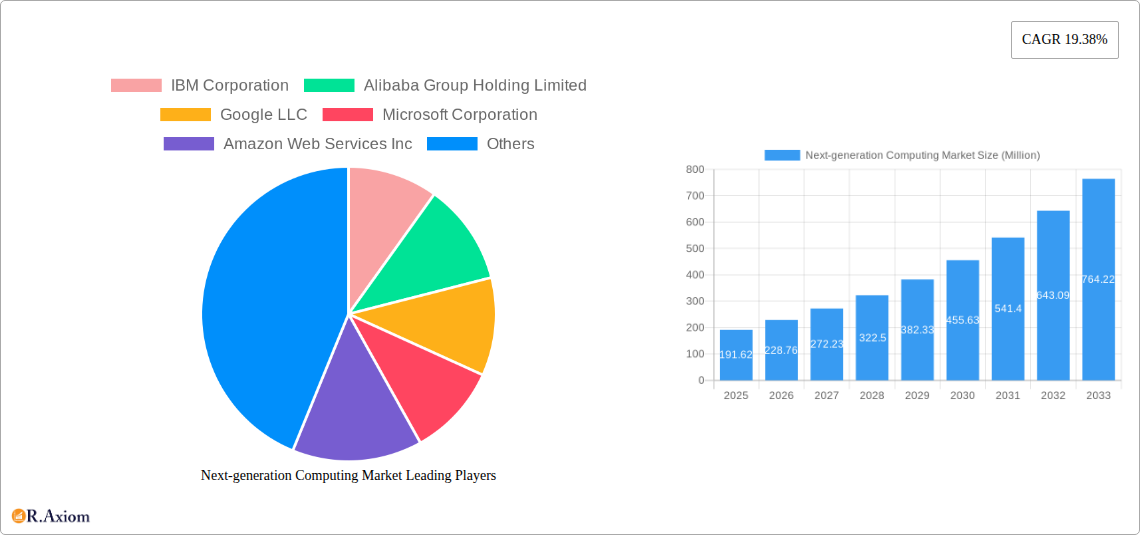
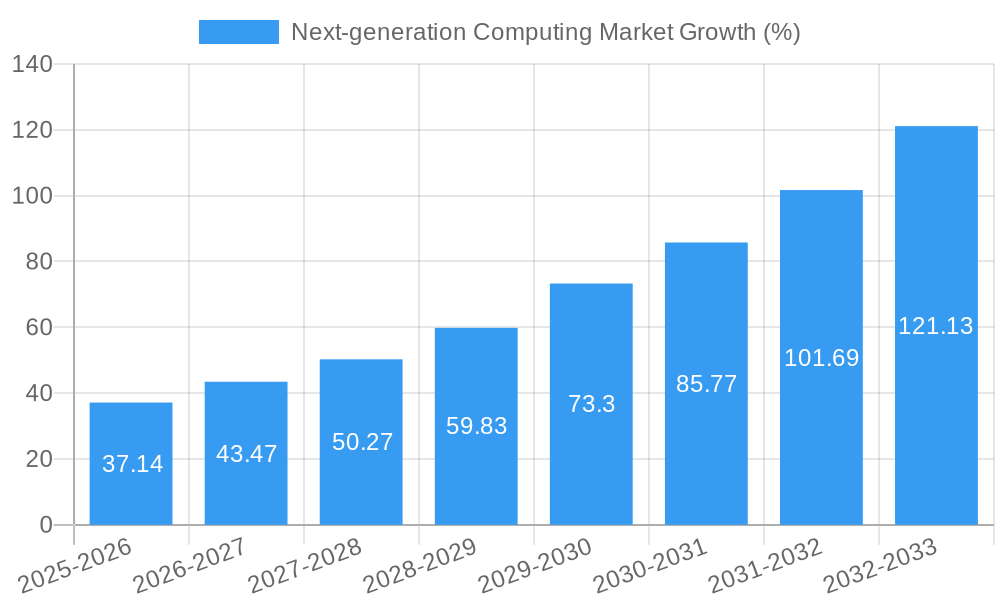
The next-generation computing market is experiencing explosive growth, projected to reach \$191.62 million in 2025 and exhibiting a robust Compound Annual Growth Rate (CAGR) of 19.38%. This surge is driven by several key factors. Firstly, the increasing demand for high-performance computing (HPC) across diverse sectors like automotive, healthcare, and finance fuels the adoption of advanced technologies like quantum and optical computing. These technologies offer unparalleled processing power and speed, enabling breakthroughs in areas such as drug discovery, materials science, and artificial intelligence. Secondly, the proliferation of edge computing, processing data closer to its source, is minimizing latency and enhancing real-time applications, particularly in industries reliant on immediate data analysis, such as manufacturing and autonomous vehicles. Finally, continuous advancements in hardware, software, and cloud-based deployment models are lowering barriers to entry and making next-generation computing solutions more accessible to a wider range of businesses.
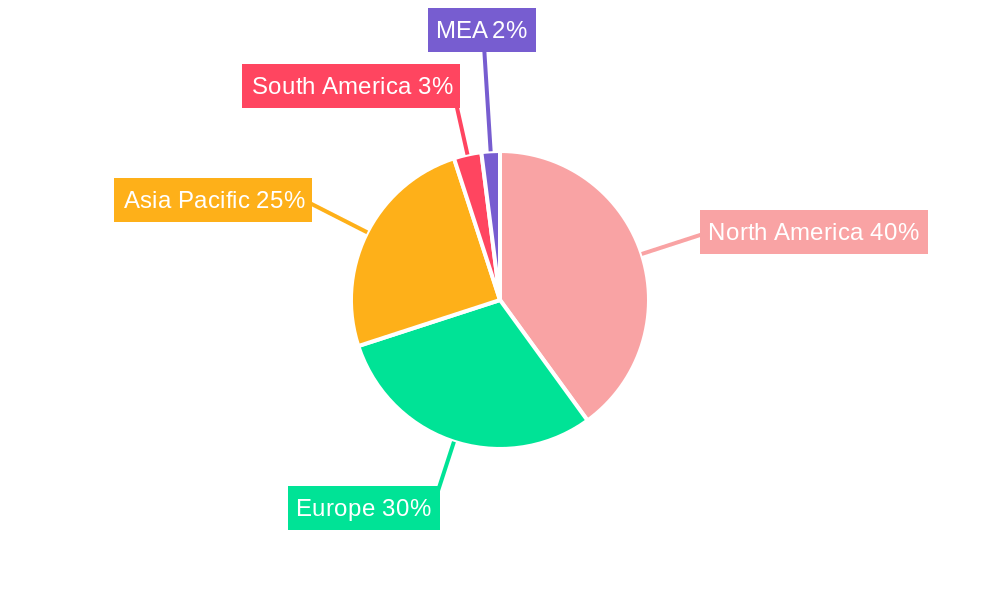
However, the market's growth is not without challenges. High initial investment costs associated with quantum and optical computing infrastructure, as well as the need for skilled professionals to manage these complex systems, represent significant restraints. Furthermore, concerns regarding data security and privacy in cloud-based deployments, alongside the standardization of next-generation computing technologies, are potential obstacles to widespread adoption. Nevertheless, the long-term potential benefits of increased processing power, efficiency, and reduced latency significantly outweigh these challenges, ensuring the market’s continued expansion throughout the forecast period (2025-2033). The diverse range of applications across multiple end-user sectors ensures sustained market momentum, with North America and Asia-Pacific expected to be leading regional markets due to strong technological advancements and robust adoption rates.
Next-Generation Computing Market: A Comprehensive Report (2019-2033)
This in-depth report provides a comprehensive analysis of the Next-Generation Computing Market, offering actionable insights for stakeholders across the value chain. The study period spans 2019-2033, with 2025 as the base and estimated year, and a forecast period of 2025-2033. The report leverages extensive primary and secondary research to provide a granular view of market trends, segment performance, competitive dynamics, and future growth prospects. The total market size is predicted to reach xx Million by 2033.
Next-generation Computing Market Market Concentration & Innovation
This section analyzes the competitive landscape of the next-generation computing market, examining market concentration, innovation drivers, regulatory frameworks, product substitutes, end-user trends, and M&A activities. The market exhibits a moderately concentrated structure, with a few dominant players holding significant market share. However, the emergence of innovative start-ups and strategic partnerships is fostering increased competition.
Market share data reveals that IBM Corporation, Alibaba Group Holding Limited, Google LLC, Microsoft Corporation, and Amazon Web Services Inc collectively hold approximately xx% of the market share in 2025. The remaining share is distributed among other key players like NVIDIA Corp, NEC Corporation, Oracle Corporation, Cisco Systems, and Intel Corporation.
Innovation is a key driver, with significant investments in R&D focused on quantum computing, edge computing, and high-performance computing. Regulatory frameworks, particularly concerning data privacy and cybersecurity, are shaping market dynamics. The increasing adoption of cloud-based solutions is driving the growth of cloud deployment models. Several mergers and acquisitions (M&A) have been observed in recent years, with deal values exceeding xx Million in the last five years. These M&A activities indicate the increasing consolidation within the industry.
Next-generation Computing Market Industry Trends & Insights
The next-generation computing market is experiencing robust growth, driven by increasing demand for high-performance computing, the proliferation of data, and advancements in artificial intelligence (AI). The Compound Annual Growth Rate (CAGR) is estimated at xx% during the forecast period (2025-2033). Key market growth drivers include:
- Technological advancements: Quantum computing, edge computing, and optical computing are transforming the industry.
- Increased adoption of cloud computing: Cloud-based solutions are providing scalable and cost-effective alternatives to traditional on-premise infrastructure.
- Growing demand for AI and machine learning: The need to process massive datasets for AI/ML applications fuels demand for high-performance computing solutions.
- Digital transformation across industries: Businesses are increasingly adopting next-generation computing technologies to improve efficiency, productivity, and decision-making.
- Government initiatives: Government support for research and development in next-generation computing technologies is fostering innovation.
The market penetration of next-generation computing technologies varies across different industries. For example, the BFSI sector is rapidly adopting AI-powered solutions for fraud detection and risk management. Market penetration in the Healthcare sector is driven by the need for advanced analytics for disease prediction and personalized medicine. Competitive dynamics are characterized by intense competition among established players and the emergence of innovative start-ups.
Dominant Markets & Segments in Next-generation Computing Market
The North American region is currently the dominant market for next-generation computing, driven by robust technological advancements, high adoption rates, and significant investments in R&D. However, the Asia-Pacific region is poised for rapid growth.
By Component: The hardware segment currently holds the largest market share, driven by the growing demand for high-performance processors, memory chips, and other computing components. However, the software segment is exhibiting the highest growth rate. The services segment offers significant growth potential due to increased demand for support, maintenance, and consulting services.
By Computing Type: High-performance computing (HPC) currently dominates the market due to its widespread adoption across various industries. However, the quantum computing segment is showing significant growth potential owing to its ability to solve complex problems that are beyond the capabilities of classical computers.
By Deployment: The cloud deployment segment holds the largest market share, driven by its scalability, cost-effectiveness, and ease of access.
By End-user: The IT & Telecom sector is the largest end-user segment, followed by the BFSI, Automotive, and Healthcare sectors. Key drivers vary by sector:
- Automotive & Transportation: Autonomous vehicles and advanced driver-assistance systems (ADAS).
- Energy & Utilities: Smart grids, predictive maintenance, and improved operational efficiency.
- Healthcare: Advanced medical imaging, genomics research, and drug discovery.
- BFSI: Fraud detection, risk management, and algorithmic trading.
- Aerospace & Defense: Simulation, modeling, and data analysis.
Next-generation Computing Market Product Developments
Recent product innovations include advancements in quantum computing hardware, the development of more energy-efficient processors, and the integration of AI capabilities into various computing platforms. This is driving the development of new applications such as improved drug discovery, faster financial modeling, and optimized supply chain management. These advancements offer significant competitive advantages, enabling businesses to process large datasets faster and more efficiently.
Report Scope & Segmentation Analysis
This report segments the next-generation computing market by component (hardware, software, services), computing type (high-performance computing, quantum computing, optical computing, edge computing, other), deployment (cloud, on-premise), and end-user (automotive & transportation, energy & utilities, healthcare, BFSI, aerospace & defense, media & entertainment, IT & telecom, retail, manufacturing, others). Each segment is analyzed in terms of growth projections, market size, and competitive dynamics. The global market size was valued at xx Million in 2024, with significant growth potential across all segments.
Key Drivers of Next-generation Computing Market Growth
The next-generation computing market is propelled by several key factors, including the rapid advancements in semiconductor technology, increased government funding for research and development, the surging demand for data analytics and AI, and the rising adoption of cloud-based services. These factors are significantly contributing to the market's expansion and innovation.
Challenges in the Next-generation Computing Market Sector
The next-generation computing market faces challenges such as the high cost of implementation, concerns about data security and privacy, the complexities of integrating new technologies into existing infrastructure, and the shortage of skilled professionals. These factors can hinder market growth, with estimated impacts ranging from xx% to xx% depending on the specific challenge.
Emerging Opportunities in Next-generation Computing Market
Emerging opportunities include the development of specialized computing architectures optimized for AI workloads, the increasing integration of quantum computing into various applications, and the expanding use of edge computing in industrial IoT (IIoT) solutions. Furthermore, new markets such as personalized medicine and autonomous transportation are driving substantial demand for next-generation computing technologies.
Leading Players in the Next-generation Computing Market Market
- IBM Corporation
- Alibaba Group Holding Limited
- Google LLC
- Microsoft Corporation
- Amazon Web Services Inc
- NVIDIA Corp
- NEC Corporation
- Oracle Corporation
- Cisco Systems
- Intel Corporation
Key Developments in Next-generation Computing Market Industry
- July 2023: Moody's and Microsoft partnered to create next-generation data, analytics, and risk solutions for financial services, leveraging Microsoft's Azure OpenAI Service, Fabric, and Teams with Moody's data. This collaboration enhances corporate intelligence and risk assessment, driving market growth within the BFSI sector.
- September 2022: General Atomics Aeronautical Systems partnered with 3rdiTech to develop next-gen integrated circuits and semiconductor technologies. This development signifies advancements in chip technology, fueling market growth in various sectors including aerospace and defense.
Strategic Outlook for Next-generation Computing Market Market
The next-generation computing market presents immense growth potential, fueled by continuous technological innovation, expanding applications across industries, and increasing government support. The market is expected to witness significant expansion in the coming years, driven by the integration of emerging technologies and the increasing adoption of cloud-based solutions. The strategic focus for companies should be on innovation, strategic partnerships, and efficient management of supply chains to capitalize on the market's growth opportunities.
Next-generation Computing Market Segmentation
-
1. Component
- 1.1. Hardware
- 1.2. Software
- 1.3. Services
-
2. Computing Type
- 2.1. High-Performance Computing
- 2.2. Quantum Computing
- 2.3. Optical Computing
- 2.4. Edge Computing
- 2.5. Other Computing Types
-
3. Deployement
- 3.1. Cloud
- 3.2. On-Premise
-
4. End-user
- 4.1. Automotive & Transportation
- 4.2. Energy & Utilities
- 4.3. Healthcare
- 4.4. BFSI
- 4.5. Aerospace & Defense
- 4.6. Media & Entertainment
- 4.7. IT & Telecom
- 4.8. Retail
- 4.9. Manufacturing
- 4.10. Other End Users
Next-generation Computing Market Segmentation By Geography
- 1. North America
- 2. Europe
- 3. Asia
- 4. Australia and New Zealand
- 5. Latin America
- 6. Middle East and Africa
Next-generation Computing Market REPORT HIGHLIGHTS
| Aspects | Details |
|---|---|
| Study Period | 2019-2033 |
| Base Year | 2024 |
| Estimated Year | 2025 |
| Forecast Period | 2025-2033 |
| Historical Period | 2019-2024 |
| Growth Rate | CAGR of 19.38% from 2019-2033 |
| Segmentation |
|
Table of Contents
- 1. Introduction
- 1.1. Research Scope
- 1.2. Market Segmentation
- 1.3. Research Methodology
- 1.4. Definitions and Assumptions
- 2. Executive Summary
- 2.1. Introduction
- 3. Market Dynamics
- 3.1. Introduction
- 3.2. Market Drivers
- 3.2.1. Growth in demand for high performance computing; Adoption of Advanced Analytics in SMEs
- 3.3. Market Restrains
- 3.3.1. Risk of Data Breach in Storing and Processing Large Data in Next-gen Computing; High operational challenges in Implementing the Solution
- 3.4. Market Trends
- 3.4.1. The Cloud Deployment of The Solutions Significantly Contributes to The Market Growth
- 4. Market Factor Analysis
- 4.1. Porters Five Forces
- 4.2. Supply/Value Chain
- 4.3. PESTEL analysis
- 4.4. Market Entropy
- 4.5. Patent/Trademark Analysis
- 5. Global Next-generation Computing Market Analysis, Insights and Forecast, 2019-2031
- 5.1. Market Analysis, Insights and Forecast - by Component
- 5.1.1. Hardware
- 5.1.2. Software
- 5.1.3. Services
- 5.2. Market Analysis, Insights and Forecast - by Computing Type
- 5.2.1. High-Performance Computing
- 5.2.2. Quantum Computing
- 5.2.3. Optical Computing
- 5.2.4. Edge Computing
- 5.2.5. Other Computing Types
- 5.3. Market Analysis, Insights and Forecast - by Deployement
- 5.3.1. Cloud
- 5.3.2. On-Premise
- 5.4. Market Analysis, Insights and Forecast - by End-user
- 5.4.1. Automotive & Transportation
- 5.4.2. Energy & Utilities
- 5.4.3. Healthcare
- 5.4.4. BFSI
- 5.4.5. Aerospace & Defense
- 5.4.6. Media & Entertainment
- 5.4.7. IT & Telecom
- 5.4.8. Retail
- 5.4.9. Manufacturing
- 5.4.10. Other End Users
- 5.5. Market Analysis, Insights and Forecast - by Region
- 5.5.1. North America
- 5.5.2. Europe
- 5.5.3. Asia
- 5.5.4. Australia and New Zealand
- 5.5.5. Latin America
- 5.5.6. Middle East and Africa
- 5.1. Market Analysis, Insights and Forecast - by Component
- 6. North America Next-generation Computing Market Analysis, Insights and Forecast, 2019-2031
- 6.1. Market Analysis, Insights and Forecast - by Component
- 6.1.1. Hardware
- 6.1.2. Software
- 6.1.3. Services
- 6.2. Market Analysis, Insights and Forecast - by Computing Type
- 6.2.1. High-Performance Computing
- 6.2.2. Quantum Computing
- 6.2.3. Optical Computing
- 6.2.4. Edge Computing
- 6.2.5. Other Computing Types
- 6.3. Market Analysis, Insights and Forecast - by Deployement
- 6.3.1. Cloud
- 6.3.2. On-Premise
- 6.4. Market Analysis, Insights and Forecast - by End-user
- 6.4.1. Automotive & Transportation
- 6.4.2. Energy & Utilities
- 6.4.3. Healthcare
- 6.4.4. BFSI
- 6.4.5. Aerospace & Defense
- 6.4.6. Media & Entertainment
- 6.4.7. IT & Telecom
- 6.4.8. Retail
- 6.4.9. Manufacturing
- 6.4.10. Other End Users
- 6.1. Market Analysis, Insights and Forecast - by Component
- 7. Europe Next-generation Computing Market Analysis, Insights and Forecast, 2019-2031
- 7.1. Market Analysis, Insights and Forecast - by Component
- 7.1.1. Hardware
- 7.1.2. Software
- 7.1.3. Services
- 7.2. Market Analysis, Insights and Forecast - by Computing Type
- 7.2.1. High-Performance Computing
- 7.2.2. Quantum Computing
- 7.2.3. Optical Computing
- 7.2.4. Edge Computing
- 7.2.5. Other Computing Types
- 7.3. Market Analysis, Insights and Forecast - by Deployement
- 7.3.1. Cloud
- 7.3.2. On-Premise
- 7.4. Market Analysis, Insights and Forecast - by End-user
- 7.4.1. Automotive & Transportation
- 7.4.2. Energy & Utilities
- 7.4.3. Healthcare
- 7.4.4. BFSI
- 7.4.5. Aerospace & Defense
- 7.4.6. Media & Entertainment
- 7.4.7. IT & Telecom
- 7.4.8. Retail
- 7.4.9. Manufacturing
- 7.4.10. Other End Users
- 7.1. Market Analysis, Insights and Forecast - by Component
- 8. Asia Next-generation Computing Market Analysis, Insights and Forecast, 2019-2031
- 8.1. Market Analysis, Insights and Forecast - by Component
- 8.1.1. Hardware
- 8.1.2. Software
- 8.1.3. Services
- 8.2. Market Analysis, Insights and Forecast - by Computing Type
- 8.2.1. High-Performance Computing
- 8.2.2. Quantum Computing
- 8.2.3. Optical Computing
- 8.2.4. Edge Computing
- 8.2.5. Other Computing Types
- 8.3. Market Analysis, Insights and Forecast - by Deployement
- 8.3.1. Cloud
- 8.3.2. On-Premise
- 8.4. Market Analysis, Insights and Forecast - by End-user
- 8.4.1. Automotive & Transportation
- 8.4.2. Energy & Utilities
- 8.4.3. Healthcare
- 8.4.4. BFSI
- 8.4.5. Aerospace & Defense
- 8.4.6. Media & Entertainment
- 8.4.7. IT & Telecom
- 8.4.8. Retail
- 8.4.9. Manufacturing
- 8.4.10. Other End Users
- 8.1. Market Analysis, Insights and Forecast - by Component
- 9. Australia and New Zealand Next-generation Computing Market Analysis, Insights and Forecast, 2019-2031
- 9.1. Market Analysis, Insights and Forecast - by Component
- 9.1.1. Hardware
- 9.1.2. Software
- 9.1.3. Services
- 9.2. Market Analysis, Insights and Forecast - by Computing Type
- 9.2.1. High-Performance Computing
- 9.2.2. Quantum Computing
- 9.2.3. Optical Computing
- 9.2.4. Edge Computing
- 9.2.5. Other Computing Types
- 9.3. Market Analysis, Insights and Forecast - by Deployement
- 9.3.1. Cloud
- 9.3.2. On-Premise
- 9.4. Market Analysis, Insights and Forecast - by End-user
- 9.4.1. Automotive & Transportation
- 9.4.2. Energy & Utilities
- 9.4.3. Healthcare
- 9.4.4. BFSI
- 9.4.5. Aerospace & Defense
- 9.4.6. Media & Entertainment
- 9.4.7. IT & Telecom
- 9.4.8. Retail
- 9.4.9. Manufacturing
- 9.4.10. Other End Users
- 9.1. Market Analysis, Insights and Forecast - by Component
- 10. Latin America Next-generation Computing Market Analysis, Insights and Forecast, 2019-2031
- 10.1. Market Analysis, Insights and Forecast - by Component
- 10.1.1. Hardware
- 10.1.2. Software
- 10.1.3. Services
- 10.2. Market Analysis, Insights and Forecast - by Computing Type
- 10.2.1. High-Performance Computing
- 10.2.2. Quantum Computing
- 10.2.3. Optical Computing
- 10.2.4. Edge Computing
- 10.2.5. Other Computing Types
- 10.3. Market Analysis, Insights and Forecast - by Deployement
- 10.3.1. Cloud
- 10.3.2. On-Premise
- 10.4. Market Analysis, Insights and Forecast - by End-user
- 10.4.1. Automotive & Transportation
- 10.4.2. Energy & Utilities
- 10.4.3. Healthcare
- 10.4.4. BFSI
- 10.4.5. Aerospace & Defense
- 10.4.6. Media & Entertainment
- 10.4.7. IT & Telecom
- 10.4.8. Retail
- 10.4.9. Manufacturing
- 10.4.10. Other End Users
- 10.1. Market Analysis, Insights and Forecast - by Component
- 11. Middle East and Africa Next-generation Computing Market Analysis, Insights and Forecast, 2019-2031
- 11.1. Market Analysis, Insights and Forecast - by Component
- 11.1.1. Hardware
- 11.1.2. Software
- 11.1.3. Services
- 11.2. Market Analysis, Insights and Forecast - by Computing Type
- 11.2.1. High-Performance Computing
- 11.2.2. Quantum Computing
- 11.2.3. Optical Computing
- 11.2.4. Edge Computing
- 11.2.5. Other Computing Types
- 11.3. Market Analysis, Insights and Forecast - by Deployement
- 11.3.1. Cloud
- 11.3.2. On-Premise
- 11.4. Market Analysis, Insights and Forecast - by End-user
- 11.4.1. Automotive & Transportation
- 11.4.2. Energy & Utilities
- 11.4.3. Healthcare
- 11.4.4. BFSI
- 11.4.5. Aerospace & Defense
- 11.4.6. Media & Entertainment
- 11.4.7. IT & Telecom
- 11.4.8. Retail
- 11.4.9. Manufacturing
- 11.4.10. Other End Users
- 11.1. Market Analysis, Insights and Forecast - by Component
- 12. North America Next-generation Computing Market Analysis, Insights and Forecast, 2019-2031
- 12.1. Market Analysis, Insights and Forecast - By Country/Sub-region
- 12.1.1 United States
- 12.1.2 Canada
- 12.1.3 Mexico
- 13. Europe Next-generation Computing Market Analysis, Insights and Forecast, 2019-2031
- 13.1. Market Analysis, Insights and Forecast - By Country/Sub-region
- 13.1.1 Germany
- 13.1.2 United Kingdom
- 13.1.3 France
- 13.1.4 Spain
- 13.1.5 Italy
- 13.1.6 Spain
- 13.1.7 Belgium
- 13.1.8 Netherland
- 13.1.9 Nordics
- 13.1.10 Rest of Europe
- 14. Asia Pacific Next-generation Computing Market Analysis, Insights and Forecast, 2019-2031
- 14.1. Market Analysis, Insights and Forecast - By Country/Sub-region
- 14.1.1 China
- 14.1.2 Japan
- 14.1.3 India
- 14.1.4 South Korea
- 14.1.5 Southeast Asia
- 14.1.6 Australia
- 14.1.7 Indonesia
- 14.1.8 Phillipes
- 14.1.9 Singapore
- 14.1.10 Thailandc
- 14.1.11 Rest of Asia Pacific
- 15. South America Next-generation Computing Market Analysis, Insights and Forecast, 2019-2031
- 15.1. Market Analysis, Insights and Forecast - By Country/Sub-region
- 15.1.1 Brazil
- 15.1.2 Argentina
- 15.1.3 Peru
- 15.1.4 Chile
- 15.1.5 Colombia
- 15.1.6 Ecuador
- 15.1.7 Venezuela
- 15.1.8 Rest of South America
- 16. North America Next-generation Computing Market Analysis, Insights and Forecast, 2019-2031
- 16.1. Market Analysis, Insights and Forecast - By Country/Sub-region
- 16.1.1 United States
- 16.1.2 Canada
- 16.1.3 Mexico
- 17. MEA Next-generation Computing Market Analysis, Insights and Forecast, 2019-2031
- 17.1. Market Analysis, Insights and Forecast - By Country/Sub-region
- 17.1.1 United Arab Emirates
- 17.1.2 Saudi Arabia
- 17.1.3 South Africa
- 17.1.4 Rest of Middle East and Africa
- 18. Competitive Analysis
- 18.1. Global Market Share Analysis 2024
- 18.2. Company Profiles
- 18.2.1 IBM Corporation
- 18.2.1.1. Overview
- 18.2.1.2. Products
- 18.2.1.3. SWOT Analysis
- 18.2.1.4. Recent Developments
- 18.2.1.5. Financials (Based on Availability)
- 18.2.2 Alibaba Group Holding Limited
- 18.2.2.1. Overview
- 18.2.2.2. Products
- 18.2.2.3. SWOT Analysis
- 18.2.2.4. Recent Developments
- 18.2.2.5. Financials (Based on Availability)
- 18.2.3 Google LLC
- 18.2.3.1. Overview
- 18.2.3.2. Products
- 18.2.3.3. SWOT Analysis
- 18.2.3.4. Recent Developments
- 18.2.3.5. Financials (Based on Availability)
- 18.2.4 Microsoft Corporation
- 18.2.4.1. Overview
- 18.2.4.2. Products
- 18.2.4.3. SWOT Analysis
- 18.2.4.4. Recent Developments
- 18.2.4.5. Financials (Based on Availability)
- 18.2.5 Amazon Web Services Inc
- 18.2.5.1. Overview
- 18.2.5.2. Products
- 18.2.5.3. SWOT Analysis
- 18.2.5.4. Recent Developments
- 18.2.5.5. Financials (Based on Availability)
- 18.2.6 NVIDIA Corp
- 18.2.6.1. Overview
- 18.2.6.2. Products
- 18.2.6.3. SWOT Analysis
- 18.2.6.4. Recent Developments
- 18.2.6.5. Financials (Based on Availability)
- 18.2.7 NEC Corporation
- 18.2.7.1. Overview
- 18.2.7.2. Products
- 18.2.7.3. SWOT Analysis
- 18.2.7.4. Recent Developments
- 18.2.7.5. Financials (Based on Availability)
- 18.2.8 Oracle Corporation
- 18.2.8.1. Overview
- 18.2.8.2. Products
- 18.2.8.3. SWOT Analysis
- 18.2.8.4. Recent Developments
- 18.2.8.5. Financials (Based on Availability)
- 18.2.9 Cisco Systems
- 18.2.9.1. Overview
- 18.2.9.2. Products
- 18.2.9.3. SWOT Analysis
- 18.2.9.4. Recent Developments
- 18.2.9.5. Financials (Based on Availability)
- 18.2.10 Intel Corporation
- 18.2.10.1. Overview
- 18.2.10.2. Products
- 18.2.10.3. SWOT Analysis
- 18.2.10.4. Recent Developments
- 18.2.10.5. Financials (Based on Availability)
- 18.2.1 IBM Corporation
List of Figures
- Figure 1: Global Next-generation Computing Market Revenue Breakdown (Million, %) by Region 2024 & 2032
- Figure 2: Global Next-generation Computing Market Volume Breakdown (K Unit, %) by Region 2024 & 2032
- Figure 3: North America Next-generation Computing Market Revenue (Million), by Country 2024 & 2032
- Figure 4: North America Next-generation Computing Market Volume (K Unit), by Country 2024 & 2032
- Figure 5: North America Next-generation Computing Market Revenue Share (%), by Country 2024 & 2032
- Figure 6: North America Next-generation Computing Market Volume Share (%), by Country 2024 & 2032
- Figure 7: Europe Next-generation Computing Market Revenue (Million), by Country 2024 & 2032
- Figure 8: Europe Next-generation Computing Market Volume (K Unit), by Country 2024 & 2032
- Figure 9: Europe Next-generation Computing Market Revenue Share (%), by Country 2024 & 2032
- Figure 10: Europe Next-generation Computing Market Volume Share (%), by Country 2024 & 2032
- Figure 11: Asia Pacific Next-generation Computing Market Revenue (Million), by Country 2024 & 2032
- Figure 12: Asia Pacific Next-generation Computing Market Volume (K Unit), by Country 2024 & 2032
- Figure 13: Asia Pacific Next-generation Computing Market Revenue Share (%), by Country 2024 & 2032
- Figure 14: Asia Pacific Next-generation Computing Market Volume Share (%), by Country 2024 & 2032
- Figure 15: South America Next-generation Computing Market Revenue (Million), by Country 2024 & 2032
- Figure 16: South America Next-generation Computing Market Volume (K Unit), by Country 2024 & 2032
- Figure 17: South America Next-generation Computing Market Revenue Share (%), by Country 2024 & 2032
- Figure 18: South America Next-generation Computing Market Volume Share (%), by Country 2024 & 2032
- Figure 19: North America Next-generation Computing Market Revenue (Million), by Country 2024 & 2032
- Figure 20: North America Next-generation Computing Market Volume (K Unit), by Country 2024 & 2032
- Figure 21: North America Next-generation Computing Market Revenue Share (%), by Country 2024 & 2032
- Figure 22: North America Next-generation Computing Market Volume Share (%), by Country 2024 & 2032
- Figure 23: MEA Next-generation Computing Market Revenue (Million), by Country 2024 & 2032
- Figure 24: MEA Next-generation Computing Market Volume (K Unit), by Country 2024 & 2032
- Figure 25: MEA Next-generation Computing Market Revenue Share (%), by Country 2024 & 2032
- Figure 26: MEA Next-generation Computing Market Volume Share (%), by Country 2024 & 2032
- Figure 27: North America Next-generation Computing Market Revenue (Million), by Component 2024 & 2032
- Figure 28: North America Next-generation Computing Market Volume (K Unit), by Component 2024 & 2032
- Figure 29: North America Next-generation Computing Market Revenue Share (%), by Component 2024 & 2032
- Figure 30: North America Next-generation Computing Market Volume Share (%), by Component 2024 & 2032
- Figure 31: North America Next-generation Computing Market Revenue (Million), by Computing Type 2024 & 2032
- Figure 32: North America Next-generation Computing Market Volume (K Unit), by Computing Type 2024 & 2032
- Figure 33: North America Next-generation Computing Market Revenue Share (%), by Computing Type 2024 & 2032
- Figure 34: North America Next-generation Computing Market Volume Share (%), by Computing Type 2024 & 2032
- Figure 35: North America Next-generation Computing Market Revenue (Million), by Deployement 2024 & 2032
- Figure 36: North America Next-generation Computing Market Volume (K Unit), by Deployement 2024 & 2032
- Figure 37: North America Next-generation Computing Market Revenue Share (%), by Deployement 2024 & 2032
- Figure 38: North America Next-generation Computing Market Volume Share (%), by Deployement 2024 & 2032
- Figure 39: North America Next-generation Computing Market Revenue (Million), by End-user 2024 & 2032
- Figure 40: North America Next-generation Computing Market Volume (K Unit), by End-user 2024 & 2032
- Figure 41: North America Next-generation Computing Market Revenue Share (%), by End-user 2024 & 2032
- Figure 42: North America Next-generation Computing Market Volume Share (%), by End-user 2024 & 2032
- Figure 43: North America Next-generation Computing Market Revenue (Million), by Country 2024 & 2032
- Figure 44: North America Next-generation Computing Market Volume (K Unit), by Country 2024 & 2032
- Figure 45: North America Next-generation Computing Market Revenue Share (%), by Country 2024 & 2032
- Figure 46: North America Next-generation Computing Market Volume Share (%), by Country 2024 & 2032
- Figure 47: Europe Next-generation Computing Market Revenue (Million), by Component 2024 & 2032
- Figure 48: Europe Next-generation Computing Market Volume (K Unit), by Component 2024 & 2032
- Figure 49: Europe Next-generation Computing Market Revenue Share (%), by Component 2024 & 2032
- Figure 50: Europe Next-generation Computing Market Volume Share (%), by Component 2024 & 2032
- Figure 51: Europe Next-generation Computing Market Revenue (Million), by Computing Type 2024 & 2032
- Figure 52: Europe Next-generation Computing Market Volume (K Unit), by Computing Type 2024 & 2032
- Figure 53: Europe Next-generation Computing Market Revenue Share (%), by Computing Type 2024 & 2032
- Figure 54: Europe Next-generation Computing Market Volume Share (%), by Computing Type 2024 & 2032
- Figure 55: Europe Next-generation Computing Market Revenue (Million), by Deployement 2024 & 2032
- Figure 56: Europe Next-generation Computing Market Volume (K Unit), by Deployement 2024 & 2032
- Figure 57: Europe Next-generation Computing Market Revenue Share (%), by Deployement 2024 & 2032
- Figure 58: Europe Next-generation Computing Market Volume Share (%), by Deployement 2024 & 2032
- Figure 59: Europe Next-generation Computing Market Revenue (Million), by End-user 2024 & 2032
- Figure 60: Europe Next-generation Computing Market Volume (K Unit), by End-user 2024 & 2032
- Figure 61: Europe Next-generation Computing Market Revenue Share (%), by End-user 2024 & 2032
- Figure 62: Europe Next-generation Computing Market Volume Share (%), by End-user 2024 & 2032
- Figure 63: Europe Next-generation Computing Market Revenue (Million), by Country 2024 & 2032
- Figure 64: Europe Next-generation Computing Market Volume (K Unit), by Country 2024 & 2032
- Figure 65: Europe Next-generation Computing Market Revenue Share (%), by Country 2024 & 2032
- Figure 66: Europe Next-generation Computing Market Volume Share (%), by Country 2024 & 2032
- Figure 67: Asia Next-generation Computing Market Revenue (Million), by Component 2024 & 2032
- Figure 68: Asia Next-generation Computing Market Volume (K Unit), by Component 2024 & 2032
- Figure 69: Asia Next-generation Computing Market Revenue Share (%), by Component 2024 & 2032
- Figure 70: Asia Next-generation Computing Market Volume Share (%), by Component 2024 & 2032
- Figure 71: Asia Next-generation Computing Market Revenue (Million), by Computing Type 2024 & 2032
- Figure 72: Asia Next-generation Computing Market Volume (K Unit), by Computing Type 2024 & 2032
- Figure 73: Asia Next-generation Computing Market Revenue Share (%), by Computing Type 2024 & 2032
- Figure 74: Asia Next-generation Computing Market Volume Share (%), by Computing Type 2024 & 2032
- Figure 75: Asia Next-generation Computing Market Revenue (Million), by Deployement 2024 & 2032
- Figure 76: Asia Next-generation Computing Market Volume (K Unit), by Deployement 2024 & 2032
- Figure 77: Asia Next-generation Computing Market Revenue Share (%), by Deployement 2024 & 2032
- Figure 78: Asia Next-generation Computing Market Volume Share (%), by Deployement 2024 & 2032
- Figure 79: Asia Next-generation Computing Market Revenue (Million), by End-user 2024 & 2032
- Figure 80: Asia Next-generation Computing Market Volume (K Unit), by End-user 2024 & 2032
- Figure 81: Asia Next-generation Computing Market Revenue Share (%), by End-user 2024 & 2032
- Figure 82: Asia Next-generation Computing Market Volume Share (%), by End-user 2024 & 2032
- Figure 83: Asia Next-generation Computing Market Revenue (Million), by Country 2024 & 2032
- Figure 84: Asia Next-generation Computing Market Volume (K Unit), by Country 2024 & 2032
- Figure 85: Asia Next-generation Computing Market Revenue Share (%), by Country 2024 & 2032
- Figure 86: Asia Next-generation Computing Market Volume Share (%), by Country 2024 & 2032
- Figure 87: Australia and New Zealand Next-generation Computing Market Revenue (Million), by Component 2024 & 2032
- Figure 88: Australia and New Zealand Next-generation Computing Market Volume (K Unit), by Component 2024 & 2032
- Figure 89: Australia and New Zealand Next-generation Computing Market Revenue Share (%), by Component 2024 & 2032
- Figure 90: Australia and New Zealand Next-generation Computing Market Volume Share (%), by Component 2024 & 2032
- Figure 91: Australia and New Zealand Next-generation Computing Market Revenue (Million), by Computing Type 2024 & 2032
- Figure 92: Australia and New Zealand Next-generation Computing Market Volume (K Unit), by Computing Type 2024 & 2032
- Figure 93: Australia and New Zealand Next-generation Computing Market Revenue Share (%), by Computing Type 2024 & 2032
- Figure 94: Australia and New Zealand Next-generation Computing Market Volume Share (%), by Computing Type 2024 & 2032
- Figure 95: Australia and New Zealand Next-generation Computing Market Revenue (Million), by Deployement 2024 & 2032
- Figure 96: Australia and New Zealand Next-generation Computing Market Volume (K Unit), by Deployement 2024 & 2032
- Figure 97: Australia and New Zealand Next-generation Computing Market Revenue Share (%), by Deployement 2024 & 2032
- Figure 98: Australia and New Zealand Next-generation Computing Market Volume Share (%), by Deployement 2024 & 2032
- Figure 99: Australia and New Zealand Next-generation Computing Market Revenue (Million), by End-user 2024 & 2032
- Figure 100: Australia and New Zealand Next-generation Computing Market Volume (K Unit), by End-user 2024 & 2032
- Figure 101: Australia and New Zealand Next-generation Computing Market Revenue Share (%), by End-user 2024 & 2032
- Figure 102: Australia and New Zealand Next-generation Computing Market Volume Share (%), by End-user 2024 & 2032
- Figure 103: Australia and New Zealand Next-generation Computing Market Revenue (Million), by Country 2024 & 2032
- Figure 104: Australia and New Zealand Next-generation Computing Market Volume (K Unit), by Country 2024 & 2032
- Figure 105: Australia and New Zealand Next-generation Computing Market Revenue Share (%), by Country 2024 & 2032
- Figure 106: Australia and New Zealand Next-generation Computing Market Volume Share (%), by Country 2024 & 2032
- Figure 107: Latin America Next-generation Computing Market Revenue (Million), by Component 2024 & 2032
- Figure 108: Latin America Next-generation Computing Market Volume (K Unit), by Component 2024 & 2032
- Figure 109: Latin America Next-generation Computing Market Revenue Share (%), by Component 2024 & 2032
- Figure 110: Latin America Next-generation Computing Market Volume Share (%), by Component 2024 & 2032
- Figure 111: Latin America Next-generation Computing Market Revenue (Million), by Computing Type 2024 & 2032
- Figure 112: Latin America Next-generation Computing Market Volume (K Unit), by Computing Type 2024 & 2032
- Figure 113: Latin America Next-generation Computing Market Revenue Share (%), by Computing Type 2024 & 2032
- Figure 114: Latin America Next-generation Computing Market Volume Share (%), by Computing Type 2024 & 2032
- Figure 115: Latin America Next-generation Computing Market Revenue (Million), by Deployement 2024 & 2032
- Figure 116: Latin America Next-generation Computing Market Volume (K Unit), by Deployement 2024 & 2032
- Figure 117: Latin America Next-generation Computing Market Revenue Share (%), by Deployement 2024 & 2032
- Figure 118: Latin America Next-generation Computing Market Volume Share (%), by Deployement 2024 & 2032
- Figure 119: Latin America Next-generation Computing Market Revenue (Million), by End-user 2024 & 2032
- Figure 120: Latin America Next-generation Computing Market Volume (K Unit), by End-user 2024 & 2032
- Figure 121: Latin America Next-generation Computing Market Revenue Share (%), by End-user 2024 & 2032
- Figure 122: Latin America Next-generation Computing Market Volume Share (%), by End-user 2024 & 2032
- Figure 123: Latin America Next-generation Computing Market Revenue (Million), by Country 2024 & 2032
- Figure 124: Latin America Next-generation Computing Market Volume (K Unit), by Country 2024 & 2032
- Figure 125: Latin America Next-generation Computing Market Revenue Share (%), by Country 2024 & 2032
- Figure 126: Latin America Next-generation Computing Market Volume Share (%), by Country 2024 & 2032
- Figure 127: Middle East and Africa Next-generation Computing Market Revenue (Million), by Component 2024 & 2032
- Figure 128: Middle East and Africa Next-generation Computing Market Volume (K Unit), by Component 2024 & 2032
- Figure 129: Middle East and Africa Next-generation Computing Market Revenue Share (%), by Component 2024 & 2032
- Figure 130: Middle East and Africa Next-generation Computing Market Volume Share (%), by Component 2024 & 2032
- Figure 131: Middle East and Africa Next-generation Computing Market Revenue (Million), by Computing Type 2024 & 2032
- Figure 132: Middle East and Africa Next-generation Computing Market Volume (K Unit), by Computing Type 2024 & 2032
- Figure 133: Middle East and Africa Next-generation Computing Market Revenue Share (%), by Computing Type 2024 & 2032
- Figure 134: Middle East and Africa Next-generation Computing Market Volume Share (%), by Computing Type 2024 & 2032
- Figure 135: Middle East and Africa Next-generation Computing Market Revenue (Million), by Deployement 2024 & 2032
- Figure 136: Middle East and Africa Next-generation Computing Market Volume (K Unit), by Deployement 2024 & 2032
- Figure 137: Middle East and Africa Next-generation Computing Market Revenue Share (%), by Deployement 2024 & 2032
- Figure 138: Middle East and Africa Next-generation Computing Market Volume Share (%), by Deployement 2024 & 2032
- Figure 139: Middle East and Africa Next-generation Computing Market Revenue (Million), by End-user 2024 & 2032
- Figure 140: Middle East and Africa Next-generation Computing Market Volume (K Unit), by End-user 2024 & 2032
- Figure 141: Middle East and Africa Next-generation Computing Market Revenue Share (%), by End-user 2024 & 2032
- Figure 142: Middle East and Africa Next-generation Computing Market Volume Share (%), by End-user 2024 & 2032
- Figure 143: Middle East and Africa Next-generation Computing Market Revenue (Million), by Country 2024 & 2032
- Figure 144: Middle East and Africa Next-generation Computing Market Volume (K Unit), by Country 2024 & 2032
- Figure 145: Middle East and Africa Next-generation Computing Market Revenue Share (%), by Country 2024 & 2032
- Figure 146: Middle East and Africa Next-generation Computing Market Volume Share (%), by Country 2024 & 2032
List of Tables
- Table 1: Global Next-generation Computing Market Revenue Million Forecast, by Region 2019 & 2032
- Table 2: Global Next-generation Computing Market Volume K Unit Forecast, by Region 2019 & 2032
- Table 3: Global Next-generation Computing Market Revenue Million Forecast, by Component 2019 & 2032
- Table 4: Global Next-generation Computing Market Volume K Unit Forecast, by Component 2019 & 2032
- Table 5: Global Next-generation Computing Market Revenue Million Forecast, by Computing Type 2019 & 2032
- Table 6: Global Next-generation Computing Market Volume K Unit Forecast, by Computing Type 2019 & 2032
- Table 7: Global Next-generation Computing Market Revenue Million Forecast, by Deployement 2019 & 2032
- Table 8: Global Next-generation Computing Market Volume K Unit Forecast, by Deployement 2019 & 2032
- Table 9: Global Next-generation Computing Market Revenue Million Forecast, by End-user 2019 & 2032
- Table 10: Global Next-generation Computing Market Volume K Unit Forecast, by End-user 2019 & 2032
- Table 11: Global Next-generation Computing Market Revenue Million Forecast, by Region 2019 & 2032
- Table 12: Global Next-generation Computing Market Volume K Unit Forecast, by Region 2019 & 2032
- Table 13: Global Next-generation Computing Market Revenue Million Forecast, by Country 2019 & 2032
- Table 14: Global Next-generation Computing Market Volume K Unit Forecast, by Country 2019 & 2032
- Table 15: United States Next-generation Computing Market Revenue (Million) Forecast, by Application 2019 & 2032
- Table 16: United States Next-generation Computing Market Volume (K Unit) Forecast, by Application 2019 & 2032
- Table 17: Canada Next-generation Computing Market Revenue (Million) Forecast, by Application 2019 & 2032
- Table 18: Canada Next-generation Computing Market Volume (K Unit) Forecast, by Application 2019 & 2032
- Table 19: Mexico Next-generation Computing Market Revenue (Million) Forecast, by Application 2019 & 2032
- Table 20: Mexico Next-generation Computing Market Volume (K Unit) Forecast, by Application 2019 & 2032
- Table 21: Global Next-generation Computing Market Revenue Million Forecast, by Country 2019 & 2032
- Table 22: Global Next-generation Computing Market Volume K Unit Forecast, by Country 2019 & 2032
- Table 23: Germany Next-generation Computing Market Revenue (Million) Forecast, by Application 2019 & 2032
- Table 24: Germany Next-generation Computing Market Volume (K Unit) Forecast, by Application 2019 & 2032
- Table 25: United Kingdom Next-generation Computing Market Revenue (Million) Forecast, by Application 2019 & 2032
- Table 26: United Kingdom Next-generation Computing Market Volume (K Unit) Forecast, by Application 2019 & 2032
- Table 27: France Next-generation Computing Market Revenue (Million) Forecast, by Application 2019 & 2032
- Table 28: France Next-generation Computing Market Volume (K Unit) Forecast, by Application 2019 & 2032
- Table 29: Spain Next-generation Computing Market Revenue (Million) Forecast, by Application 2019 & 2032
- Table 30: Spain Next-generation Computing Market Volume (K Unit) Forecast, by Application 2019 & 2032
- Table 31: Italy Next-generation Computing Market Revenue (Million) Forecast, by Application 2019 & 2032
- Table 32: Italy Next-generation Computing Market Volume (K Unit) Forecast, by Application 2019 & 2032
- Table 33: Spain Next-generation Computing Market Revenue (Million) Forecast, by Application 2019 & 2032
- Table 34: Spain Next-generation Computing Market Volume (K Unit) Forecast, by Application 2019 & 2032
- Table 35: Belgium Next-generation Computing Market Revenue (Million) Forecast, by Application 2019 & 2032
- Table 36: Belgium Next-generation Computing Market Volume (K Unit) Forecast, by Application 2019 & 2032
- Table 37: Netherland Next-generation Computing Market Revenue (Million) Forecast, by Application 2019 & 2032
- Table 38: Netherland Next-generation Computing Market Volume (K Unit) Forecast, by Application 2019 & 2032
- Table 39: Nordics Next-generation Computing Market Revenue (Million) Forecast, by Application 2019 & 2032
- Table 40: Nordics Next-generation Computing Market Volume (K Unit) Forecast, by Application 2019 & 2032
- Table 41: Rest of Europe Next-generation Computing Market Revenue (Million) Forecast, by Application 2019 & 2032
- Table 42: Rest of Europe Next-generation Computing Market Volume (K Unit) Forecast, by Application 2019 & 2032
- Table 43: Global Next-generation Computing Market Revenue Million Forecast, by Country 2019 & 2032
- Table 44: Global Next-generation Computing Market Volume K Unit Forecast, by Country 2019 & 2032
- Table 45: China Next-generation Computing Market Revenue (Million) Forecast, by Application 2019 & 2032
- Table 46: China Next-generation Computing Market Volume (K Unit) Forecast, by Application 2019 & 2032
- Table 47: Japan Next-generation Computing Market Revenue (Million) Forecast, by Application 2019 & 2032
- Table 48: Japan Next-generation Computing Market Volume (K Unit) Forecast, by Application 2019 & 2032
- Table 49: India Next-generation Computing Market Revenue (Million) Forecast, by Application 2019 & 2032
- Table 50: India Next-generation Computing Market Volume (K Unit) Forecast, by Application 2019 & 2032
- Table 51: South Korea Next-generation Computing Market Revenue (Million) Forecast, by Application 2019 & 2032
- Table 52: South Korea Next-generation Computing Market Volume (K Unit) Forecast, by Application 2019 & 2032
- Table 53: Southeast Asia Next-generation Computing Market Revenue (Million) Forecast, by Application 2019 & 2032
- Table 54: Southeast Asia Next-generation Computing Market Volume (K Unit) Forecast, by Application 2019 & 2032
- Table 55: Australia Next-generation Computing Market Revenue (Million) Forecast, by Application 2019 & 2032
- Table 56: Australia Next-generation Computing Market Volume (K Unit) Forecast, by Application 2019 & 2032
- Table 57: Indonesia Next-generation Computing Market Revenue (Million) Forecast, by Application 2019 & 2032
- Table 58: Indonesia Next-generation Computing Market Volume (K Unit) Forecast, by Application 2019 & 2032
- Table 59: Phillipes Next-generation Computing Market Revenue (Million) Forecast, by Application 2019 & 2032
- Table 60: Phillipes Next-generation Computing Market Volume (K Unit) Forecast, by Application 2019 & 2032
- Table 61: Singapore Next-generation Computing Market Revenue (Million) Forecast, by Application 2019 & 2032
- Table 62: Singapore Next-generation Computing Market Volume (K Unit) Forecast, by Application 2019 & 2032
- Table 63: Thailandc Next-generation Computing Market Revenue (Million) Forecast, by Application 2019 & 2032
- Table 64: Thailandc Next-generation Computing Market Volume (K Unit) Forecast, by Application 2019 & 2032
- Table 65: Rest of Asia Pacific Next-generation Computing Market Revenue (Million) Forecast, by Application 2019 & 2032
- Table 66: Rest of Asia Pacific Next-generation Computing Market Volume (K Unit) Forecast, by Application 2019 & 2032
- Table 67: Global Next-generation Computing Market Revenue Million Forecast, by Country 2019 & 2032
- Table 68: Global Next-generation Computing Market Volume K Unit Forecast, by Country 2019 & 2032
- Table 69: Brazil Next-generation Computing Market Revenue (Million) Forecast, by Application 2019 & 2032
- Table 70: Brazil Next-generation Computing Market Volume (K Unit) Forecast, by Application 2019 & 2032
- Table 71: Argentina Next-generation Computing Market Revenue (Million) Forecast, by Application 2019 & 2032
- Table 72: Argentina Next-generation Computing Market Volume (K Unit) Forecast, by Application 2019 & 2032
- Table 73: Peru Next-generation Computing Market Revenue (Million) Forecast, by Application 2019 & 2032
- Table 74: Peru Next-generation Computing Market Volume (K Unit) Forecast, by Application 2019 & 2032
- Table 75: Chile Next-generation Computing Market Revenue (Million) Forecast, by Application 2019 & 2032
- Table 76: Chile Next-generation Computing Market Volume (K Unit) Forecast, by Application 2019 & 2032
- Table 77: Colombia Next-generation Computing Market Revenue (Million) Forecast, by Application 2019 & 2032
- Table 78: Colombia Next-generation Computing Market Volume (K Unit) Forecast, by Application 2019 & 2032
- Table 79: Ecuador Next-generation Computing Market Revenue (Million) Forecast, by Application 2019 & 2032
- Table 80: Ecuador Next-generation Computing Market Volume (K Unit) Forecast, by Application 2019 & 2032
- Table 81: Venezuela Next-generation Computing Market Revenue (Million) Forecast, by Application 2019 & 2032
- Table 82: Venezuela Next-generation Computing Market Volume (K Unit) Forecast, by Application 2019 & 2032
- Table 83: Rest of South America Next-generation Computing Market Revenue (Million) Forecast, by Application 2019 & 2032
- Table 84: Rest of South America Next-generation Computing Market Volume (K Unit) Forecast, by Application 2019 & 2032
- Table 85: Global Next-generation Computing Market Revenue Million Forecast, by Country 2019 & 2032
- Table 86: Global Next-generation Computing Market Volume K Unit Forecast, by Country 2019 & 2032
- Table 87: United States Next-generation Computing Market Revenue (Million) Forecast, by Application 2019 & 2032
- Table 88: United States Next-generation Computing Market Volume (K Unit) Forecast, by Application 2019 & 2032
- Table 89: Canada Next-generation Computing Market Revenue (Million) Forecast, by Application 2019 & 2032
- Table 90: Canada Next-generation Computing Market Volume (K Unit) Forecast, by Application 2019 & 2032
- Table 91: Mexico Next-generation Computing Market Revenue (Million) Forecast, by Application 2019 & 2032
- Table 92: Mexico Next-generation Computing Market Volume (K Unit) Forecast, by Application 2019 & 2032
- Table 93: Global Next-generation Computing Market Revenue Million Forecast, by Country 2019 & 2032
- Table 94: Global Next-generation Computing Market Volume K Unit Forecast, by Country 2019 & 2032
- Table 95: United Arab Emirates Next-generation Computing Market Revenue (Million) Forecast, by Application 2019 & 2032
- Table 96: United Arab Emirates Next-generation Computing Market Volume (K Unit) Forecast, by Application 2019 & 2032
- Table 97: Saudi Arabia Next-generation Computing Market Revenue (Million) Forecast, by Application 2019 & 2032
- Table 98: Saudi Arabia Next-generation Computing Market Volume (K Unit) Forecast, by Application 2019 & 2032
- Table 99: South Africa Next-generation Computing Market Revenue (Million) Forecast, by Application 2019 & 2032
- Table 100: South Africa Next-generation Computing Market Volume (K Unit) Forecast, by Application 2019 & 2032
- Table 101: Rest of Middle East and Africa Next-generation Computing Market Revenue (Million) Forecast, by Application 2019 & 2032
- Table 102: Rest of Middle East and Africa Next-generation Computing Market Volume (K Unit) Forecast, by Application 2019 & 2032
- Table 103: Global Next-generation Computing Market Revenue Million Forecast, by Component 2019 & 2032
- Table 104: Global Next-generation Computing Market Volume K Unit Forecast, by Component 2019 & 2032
- Table 105: Global Next-generation Computing Market Revenue Million Forecast, by Computing Type 2019 & 2032
- Table 106: Global Next-generation Computing Market Volume K Unit Forecast, by Computing Type 2019 & 2032
- Table 107: Global Next-generation Computing Market Revenue Million Forecast, by Deployement 2019 & 2032
- Table 108: Global Next-generation Computing Market Volume K Unit Forecast, by Deployement 2019 & 2032
- Table 109: Global Next-generation Computing Market Revenue Million Forecast, by End-user 2019 & 2032
- Table 110: Global Next-generation Computing Market Volume K Unit Forecast, by End-user 2019 & 2032
- Table 111: Global Next-generation Computing Market Revenue Million Forecast, by Country 2019 & 2032
- Table 112: Global Next-generation Computing Market Volume K Unit Forecast, by Country 2019 & 2032
- Table 113: Global Next-generation Computing Market Revenue Million Forecast, by Component 2019 & 2032
- Table 114: Global Next-generation Computing Market Volume K Unit Forecast, by Component 2019 & 2032
- Table 115: Global Next-generation Computing Market Revenue Million Forecast, by Computing Type 2019 & 2032
- Table 116: Global Next-generation Computing Market Volume K Unit Forecast, by Computing Type 2019 & 2032
- Table 117: Global Next-generation Computing Market Revenue Million Forecast, by Deployement 2019 & 2032
- Table 118: Global Next-generation Computing Market Volume K Unit Forecast, by Deployement 2019 & 2032
- Table 119: Global Next-generation Computing Market Revenue Million Forecast, by End-user 2019 & 2032
- Table 120: Global Next-generation Computing Market Volume K Unit Forecast, by End-user 2019 & 2032
- Table 121: Global Next-generation Computing Market Revenue Million Forecast, by Country 2019 & 2032
- Table 122: Global Next-generation Computing Market Volume K Unit Forecast, by Country 2019 & 2032
- Table 123: Global Next-generation Computing Market Revenue Million Forecast, by Component 2019 & 2032
- Table 124: Global Next-generation Computing Market Volume K Unit Forecast, by Component 2019 & 2032
- Table 125: Global Next-generation Computing Market Revenue Million Forecast, by Computing Type 2019 & 2032
- Table 126: Global Next-generation Computing Market Volume K Unit Forecast, by Computing Type 2019 & 2032
- Table 127: Global Next-generation Computing Market Revenue Million Forecast, by Deployement 2019 & 2032
- Table 128: Global Next-generation Computing Market Volume K Unit Forecast, by Deployement 2019 & 2032
- Table 129: Global Next-generation Computing Market Revenue Million Forecast, by End-user 2019 & 2032
- Table 130: Global Next-generation Computing Market Volume K Unit Forecast, by End-user 2019 & 2032
- Table 131: Global Next-generation Computing Market Revenue Million Forecast, by Country 2019 & 2032
- Table 132: Global Next-generation Computing Market Volume K Unit Forecast, by Country 2019 & 2032
- Table 133: Global Next-generation Computing Market Revenue Million Forecast, by Component 2019 & 2032
- Table 134: Global Next-generation Computing Market Volume K Unit Forecast, by Component 2019 & 2032
- Table 135: Global Next-generation Computing Market Revenue Million Forecast, by Computing Type 2019 & 2032
- Table 136: Global Next-generation Computing Market Volume K Unit Forecast, by Computing Type 2019 & 2032
- Table 137: Global Next-generation Computing Market Revenue Million Forecast, by Deployement 2019 & 2032
- Table 138: Global Next-generation Computing Market Volume K Unit Forecast, by Deployement 2019 & 2032
- Table 139: Global Next-generation Computing Market Revenue Million Forecast, by End-user 2019 & 2032
- Table 140: Global Next-generation Computing Market Volume K Unit Forecast, by End-user 2019 & 2032
- Table 141: Global Next-generation Computing Market Revenue Million Forecast, by Country 2019 & 2032
- Table 142: Global Next-generation Computing Market Volume K Unit Forecast, by Country 2019 & 2032
- Table 143: Global Next-generation Computing Market Revenue Million Forecast, by Component 2019 & 2032
- Table 144: Global Next-generation Computing Market Volume K Unit Forecast, by Component 2019 & 2032
- Table 145: Global Next-generation Computing Market Revenue Million Forecast, by Computing Type 2019 & 2032
- Table 146: Global Next-generation Computing Market Volume K Unit Forecast, by Computing Type 2019 & 2032
- Table 147: Global Next-generation Computing Market Revenue Million Forecast, by Deployement 2019 & 2032
- Table 148: Global Next-generation Computing Market Volume K Unit Forecast, by Deployement 2019 & 2032
- Table 149: Global Next-generation Computing Market Revenue Million Forecast, by End-user 2019 & 2032
- Table 150: Global Next-generation Computing Market Volume K Unit Forecast, by End-user 2019 & 2032
- Table 151: Global Next-generation Computing Market Revenue Million Forecast, by Country 2019 & 2032
- Table 152: Global Next-generation Computing Market Volume K Unit Forecast, by Country 2019 & 2032
- Table 153: Global Next-generation Computing Market Revenue Million Forecast, by Component 2019 & 2032
- Table 154: Global Next-generation Computing Market Volume K Unit Forecast, by Component 2019 & 2032
- Table 155: Global Next-generation Computing Market Revenue Million Forecast, by Computing Type 2019 & 2032
- Table 156: Global Next-generation Computing Market Volume K Unit Forecast, by Computing Type 2019 & 2032
- Table 157: Global Next-generation Computing Market Revenue Million Forecast, by Deployement 2019 & 2032
- Table 158: Global Next-generation Computing Market Volume K Unit Forecast, by Deployement 2019 & 2032
- Table 159: Global Next-generation Computing Market Revenue Million Forecast, by End-user 2019 & 2032
- Table 160: Global Next-generation Computing Market Volume K Unit Forecast, by End-user 2019 & 2032
- Table 161: Global Next-generation Computing Market Revenue Million Forecast, by Country 2019 & 2032
- Table 162: Global Next-generation Computing Market Volume K Unit Forecast, by Country 2019 & 2032
Frequently Asked Questions
1. What is the projected Compound Annual Growth Rate (CAGR) of the Next-generation Computing Market?
The projected CAGR is approximately 19.38%.
2. Which companies are prominent players in the Next-generation Computing Market?
Key companies in the market include IBM Corporation, Alibaba Group Holding Limited, Google LLC, Microsoft Corporation, Amazon Web Services Inc, NVIDIA Corp, NEC Corporation, Oracle Corporation, Cisco Systems, Intel Corporation.
3. What are the main segments of the Next-generation Computing Market?
The market segments include Component, Computing Type, Deployement, End-user.
4. Can you provide details about the market size?
The market size is estimated to be USD 191.62 Million as of 2022.
5. What are some drivers contributing to market growth?
Growth in demand for high performance computing; Adoption of Advanced Analytics in SMEs.
6. What are the notable trends driving market growth?
The Cloud Deployment of The Solutions Significantly Contributes to The Market Growth.
7. Are there any restraints impacting market growth?
Risk of Data Breach in Storing and Processing Large Data in Next-gen Computing; High operational challenges in Implementing the Solution.
8. Can you provide examples of recent developments in the market?
July 2023: Moody's and Microsoft have partnered strategically to co-create next-generation data, analytics, research, collaboration, and risk solutions for financial services, which would be built by combining Microsoft's Azure OpenAI Service, Fabric, and Teams with Moody's proprietary data, analytics, and research and has been designed to enhance insights into corporate intelligence and risk assessment.
9. What pricing options are available for accessing the report?
Pricing options include single-user, multi-user, and enterprise licenses priced at USD 4750, USD 5250, and USD 8750 respectively.
10. Is the market size provided in terms of value or volume?
The market size is provided in terms of value, measured in Million and volume, measured in K Unit.
11. Are there any specific market keywords associated with the report?
Yes, the market keyword associated with the report is "Next-generation Computing Market," which aids in identifying and referencing the specific market segment covered.
12. How do I determine which pricing option suits my needs best?
The pricing options vary based on user requirements and access needs. Individual users may opt for single-user licenses, while businesses requiring broader access may choose multi-user or enterprise licenses for cost-effective access to the report.
13. Are there any additional resources or data provided in the Next-generation Computing Market report?
While the report offers comprehensive insights, it's advisable to review the specific contents or supplementary materials provided to ascertain if additional resources or data are available.
14. How can I stay updated on further developments or reports in the Next-generation Computing Market?
To stay informed about further developments, trends, and reports in the Next-generation Computing Market, consider subscribing to industry newsletters, following relevant companies and organizations, or regularly checking reputable industry news sources and publications.
Methodology
Step 1 - Identification of Relevant Samples Size from Population Database


Step 2 - Approaches for Defining Global Market Size (Value, Volume* & Price*)

Note*: In applicable scenarios
Step 3 - Data Sources
Primary Research
- Web Analytics
- Survey Reports
- Research Institute
- Latest Research Reports
- Opinion Leaders
Secondary Research
- Annual Reports
- White Paper
- Latest Press Release
- Industry Association
- Paid Database
- Investor Presentations

Step 4 - Data Triangulation
Involves using different sources of information in order to increase the validity of a study
These sources are likely to be stakeholders in a program - participants, other researchers, program staff, other community members, and so on.
Then we put all data in single framework & apply various statistical tools to find out the dynamic on the market.
During the analysis stage, feedback from the stakeholder groups would be compared to determine areas of agreement as well as areas of divergence


