

Key Insights
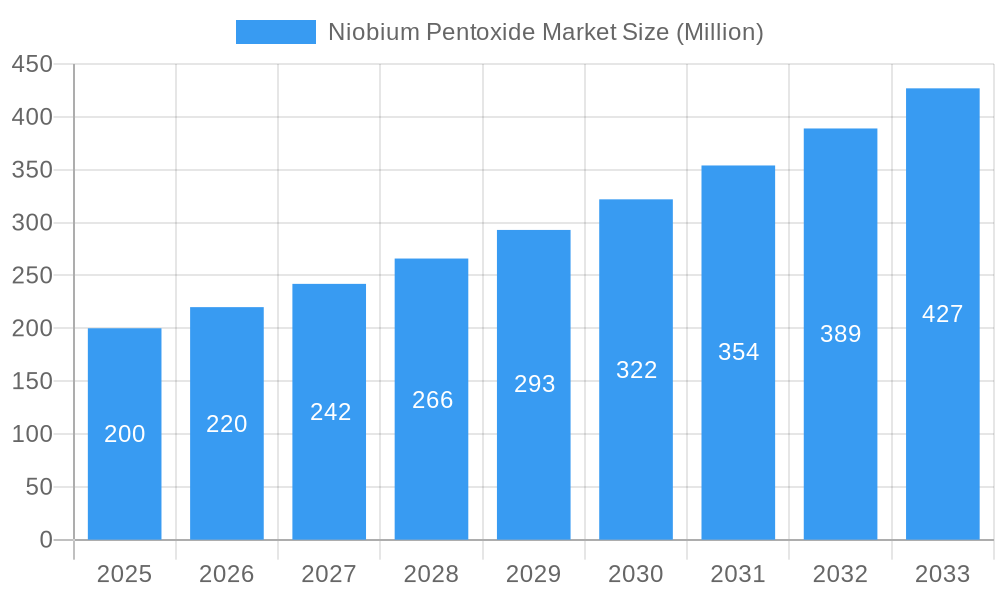
The Niobium Pentoxide market, valued at approximately $XX million in 2025, is projected to experience robust growth, exhibiting a compound annual growth rate (CAGR) of 10.09% from 2025 to 2033. This expansion is fueled by the increasing demand for niobium pentoxide across diverse sectors. Key drivers include the burgeoning supercapacitor industry, which relies heavily on niobium pentoxide's exceptional electrochemical properties for energy storage applications. Furthermore, the growth of the aerospace and defense sectors, requiring high-performance superalloys, and the expanding optical glass market contribute significantly to market growth. The rising adoption of niobium pentoxide in advanced ceramics and other specialized applications further bolsters market expansion. While supply chain disruptions and price volatility of raw materials pose potential challenges, technological advancements in niobium pentoxide production and its increasing use in high-value applications are mitigating these constraints. Segmentation analysis reveals that the industrial grade (3N and 4N purity) segment dominates, driven by its widespread application in various industries. Geographically, the Asia-Pacific region, particularly China and India, leads the market due to significant industrial activity and expanding infrastructure development. North America and Europe follow closely, contributing significantly to global demand.
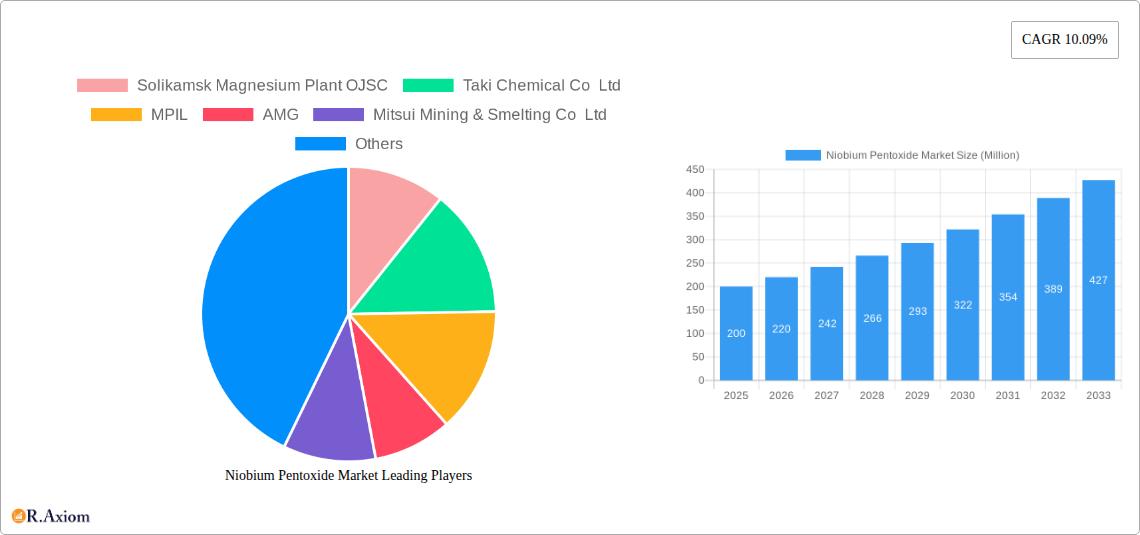
Niobium Pentoxide Market Market Size (In Million)
The market's future trajectory is optimistic, driven by continued technological advancements leading to improved performance and cost-effectiveness of niobium pentoxide. The increasing focus on sustainable and energy-efficient technologies further fuels demand, especially in the supercapacitor and renewable energy sectors. However, the market's growth is likely to be influenced by factors such as the availability and cost of raw materials, governmental regulations, and the emergence of alternative materials. Companies such as Solikamsk Magnesium Plant OJSC, Taki Chemical Co Ltd, and CBMM are key players shaping the market landscape through technological innovation, strategic partnerships, and capacity expansion. Continued investment in R&D and exploration of novel applications will further solidify niobium pentoxide's position as a crucial material in various high-growth industries.
Niobium Pentoxide Market Company Market Share
Niobium Pentoxide Market: A Comprehensive Report (2019-2033)
This detailed report provides a comprehensive analysis of the Niobium Pentoxide market, offering actionable insights for industry stakeholders. Covering the period 2019-2033, with a base year of 2025, this study delves into market dynamics, key players, and future growth prospects. The report utilizes a robust methodology incorporating both historical data (2019-2024) and future projections (2025-2033) to offer a complete understanding of this evolving market.
Niobium Pentoxide Market Concentration & Innovation
The Niobium Pentoxide market exhibits a moderately concentrated structure, with a few major players holding significant market share. While precise market share figures for each company remain proprietary, CBMM is recognized as a dominant force, followed by companies like Solikamsk Magnesium Plant OJSC, Taki Chemical Co Ltd, MPIL, AMG, Mitsui Mining & Smelting Co Ltd, JX Nippon Mining & Metals Corporation, F&X Electro-Materials Limited, King-Tan Tantalum Industry Ltd, and XIMEI Resources Holding Limited. The market’s innovation is driven by the increasing demand for high-performance materials in various applications, particularly in the burgeoning electric vehicle and renewable energy sectors. Regulatory frameworks concerning environmental sustainability are increasingly influencing production methods and the adoption of sustainable practices. Product substitutes, while limited, are continually being explored, posing a potential long-term challenge. End-user trends indicate a shift towards higher purity grades and specialized applications, necessitating ongoing R&D. M&A activity in the sector has been relatively modest in recent years, with deal values averaging around xx Million USD annually. This could change as the market matures and consolidates.
- Market Concentration: Moderately concentrated with a few dominant players.
- Innovation Drivers: Demand for high-performance materials, sustainability regulations.
- Regulatory Frameworks: Increasingly focused on environmental sustainability and responsible sourcing.
- Product Substitutes: Limited, but potential for future developments.
- End-User Trends: Shift towards higher purity grades and specialized applications.
- M&A Activity: Relatively low, with average annual deal values around xx Million USD.
Niobium Pentoxide Market Industry Trends & Insights
The Niobium Pentoxide market is experiencing robust growth, driven primarily by the expanding adoption of niobium in advanced technologies. The compound annual growth rate (CAGR) during the forecast period (2025-2033) is projected to be xx%, exceeding the xx% CAGR observed during the historical period (2019-2024). This accelerated growth is fuelled by several key factors. Technological advancements in battery technology, particularly in lithium-ion batteries, are significantly impacting market demand. The growing adoption of electric vehicles (EVs) and the rising demand for energy storage solutions are creating a substantial demand for niobium pentoxide. Furthermore, its utilization in superalloys for aerospace and other high-temperature applications is a major driver. Consumer preferences are shifting towards sustainable and high-performance products, further enhancing the market's appeal. Competitive dynamics are characterized by both cooperation and competition, with key players collaborating on R&D initiatives while simultaneously vying for market share. Market penetration in key sectors like aerospace and electronics is steadily increasing, reflecting the growing awareness and adoption of niobium's unique properties.
Dominant Markets & Segments in Niobium Pentoxide Market
The global Niobium Pentoxide market is geographically diverse, with xx region exhibiting the strongest growth. Within this region, xx country demonstrates the highest market penetration due to strong economic policies, established infrastructure supporting advanced manufacturing, and substantial government investment in clean energy technologies. The Industrial Grade segment dominates the market by grade, with demand for 3N and 4N purity niobium pentoxide particularly high.
- Leading Region: xx
- Leading Country: xx
- Key Drivers (xx Region):
- Strong economic policies supporting industrial growth.
- Well-established infrastructure for advanced manufacturing.
- Government investment in renewable energy and advanced technologies.
- Dominant Grade: Industrial Grade (3N and 4N purity)
- Dominant Applications: Superalloys and Ceramics currently lead in terms of volume, but Supercapacitors are showing the fastest growth rate.
Dominance Analysis: The dominance of xx region and country stems from a confluence of factors. These factors include a robust manufacturing base, a favorable regulatory environment that encourages investment in high-tech industries, and significant government support for research and development in materials science. The high demand for higher-purity grades is linked to the increasing sophistication of applications in electronics and aerospace.
Niobium Pentoxide Market Product Developments
Recent product developments focus on enhancing the purity and consistency of niobium pentoxide to meet the stringent demands of advanced applications. Innovations in production processes are aimed at improving yield and reducing costs, while new formulations are being developed to optimize performance in specific applications like supercapacitors and lithium-ion batteries. These developments reflect a strong push towards greater efficiency and cost-effectiveness, thereby enhancing the overall competitiveness of niobium pentoxide in the market. The market fit of these innovations is closely aligned with emerging trends in energy storage, aerospace, and electronics, emphasizing the growing importance of niobium pentoxide in these sectors.
Report Scope & Segmentation Analysis
This report segments the Niobium Pentoxide market by Grade (Industrial Grade: 3N, 4N) and by Application (Niobium Metal, Optical Glass, Supercapacitors, Superalloys, Ceramics, Other Applications).
By Grade: The Industrial Grade segment, particularly 3N and 4N purity, is projected to witness significant growth due to its increasing application in high-tech industries. The market size for this segment is forecast to reach xx Million by 2033. Competitive dynamics are shaped by the ongoing advancements in purification technologies.
By Application: The Superalloys and Ceramics segments currently dominate in terms of volume, although the Supercapacitor application is poised for the most rapid expansion due to the growth of the energy storage market. This segment is expected to grow at a CAGR of xx% between 2025 and 2033, reaching a market size of xx Million by 2033.
Key Drivers of Niobium Pentoxide Market Growth
The Niobium Pentoxide market’s growth is propelled by several key factors. Firstly, the burgeoning demand for high-performance materials in diverse applications like aerospace, electronics, and renewable energy is a major driver. Secondly, technological advancements in battery technology and the rise of electric vehicles are significantly boosting demand. Finally, supportive government policies and initiatives focused on sustainable development and energy transition further fuel market growth. The increasing use of niobium in supercapacitors and lithium-ion batteries for enhanced energy storage capabilities provides a significant boost to market expansion.
Challenges in the Niobium Pentoxide Market Sector
The Niobium Pentoxide market faces challenges related to supply chain constraints and the inherent volatility of raw material prices. The concentrated nature of the supply chain makes the market susceptible to disruptions. Furthermore, environmental regulations and concerns regarding the sustainability of mining practices also present hurdles. These factors can significantly impact production costs and profitability. Competition from emerging substitute materials presents a long-term challenge requiring continuous innovation and improved cost efficiency.
Emerging Opportunities in Niobium Pentoxide Market
Emerging opportunities lie in the expanding applications of niobium pentoxide in advanced technologies. The growth of the electric vehicle market, the increasing demand for energy storage solutions, and the development of new high-performance materials all present exciting prospects for market expansion. Further exploration of niobium pentoxide's unique properties in various applications could unlock new avenues for growth. The development of more sustainable and efficient production methods offers considerable potential for reducing costs and improving environmental performance.
Leading Players in the Niobium Pentoxide Market Market
- Solikamsk Magnesium Plant OJSC
- Taki Chemical Co Ltd
- MPIL
- AMG
- Mitsui Mining & Smelting Co Ltd
- JX Nippon Mining & Metals Corporation
- F&X Electro-Materials Limited
- King-Tan Tantalum Industry Ltd
- XIMEI Resources Holding Limited
- CBMM
Key Developments in Niobium Pentoxide Market Industry
- December 2022: CBMM announced an USD 80 Million investment to expand niobium oxide capacity from 500 tons to 3,000 tons by 2024, and aims for 40,000 tons by 2030. This expansion signifies a major commitment to meeting the growing market demand.
- March 2022: CBMM partnered with Horwin Brasil, investing ~USD 13.8 Million to utilize niobium in electric motorcycle batteries, aiming for 50,000 tons of niobium oxide sales by 2030. This collaboration highlights the growing adoption of niobium in the electric vehicle sector.
Strategic Outlook for Niobium Pentoxide Market Market
The Niobium Pentoxide market is poised for substantial growth driven by technological advancements, increasing demand from key sectors, and supportive government policies. The strategic outlook is positive, with opportunities for expansion in emerging applications and geographic regions. Companies focused on innovation, sustainability, and efficient supply chains are best positioned to capitalize on the market's future potential. The increasing adoption of niobium in various advanced technologies ensures a promising trajectory for the years to come.
Niobium Pentoxide Market Segmentation
-
1. Grade
- 1.1. Industrial Grade (purity: 99.0% to 99.8%)
- 1.2. 3N
- 1.3. 4N
-
2. Application
- 2.1. Niobium Metal
- 2.2. Optical Glass
- 2.3. Supercapacitors
- 2.4. Superalloys
- 2.5. Ceramics
- 2.6. Other Applications
Niobium Pentoxide Market Segmentation By Geography
-
1. Asia Pacific
- 1.1. China
- 1.2. India
- 1.3. Japan
- 1.4. South Korea
- 1.5. Rest of Asia Pacific
-
2. North America
- 2.1. United States
- 2.2. Canada
- 2.3. Mexico
-
3. Europe
- 3.1. Germany
- 3.2. United Kingdom
- 3.3. France
- 3.4. Italy
- 3.5. Rest of Europe
-
4. South America
- 4.1. Brazil
- 4.2. Argentina
- 4.3. Rest of South America
-
5. Middle East and Africa
- 5.1. Saudi Arabia
- 5.2. South Africa
- 5.3. Rest of Middle East and Africa
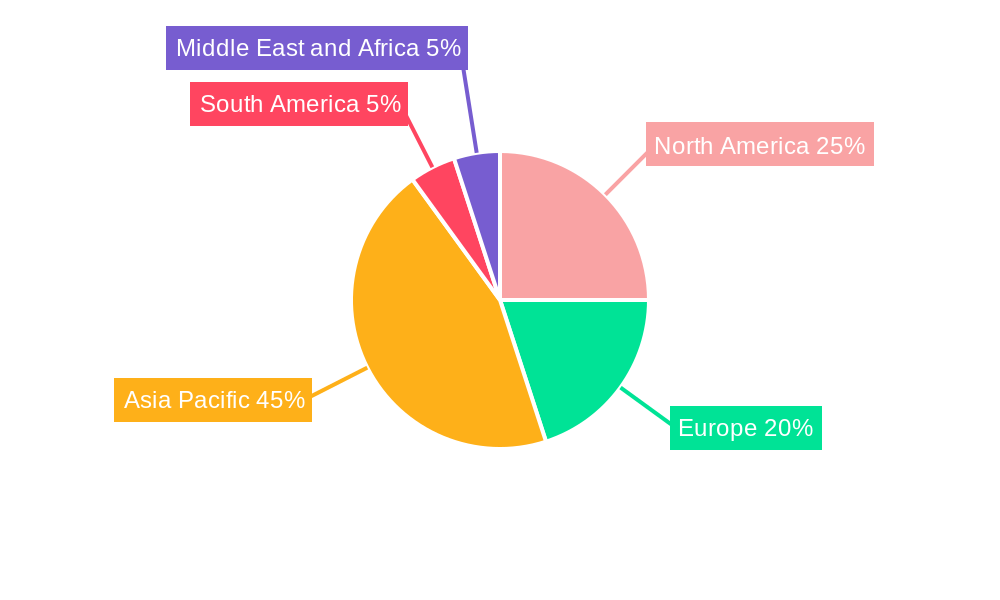
Niobium Pentoxide Market Regional Market Share
Geographic Coverage of Niobium Pentoxide Market
Niobium Pentoxide Market REPORT HIGHLIGHTS
| Aspects | Details |
|---|---|
| Study Period | 2020-2034 |
| Base Year | 2025 |
| Estimated Year | 2026 |
| Forecast Period | 2026-2034 |
| Historical Period | 2020-2025 |
| Growth Rate | CAGR of 5.6% from 2020-2034 |
| Segmentation |
|
Table of Contents
- 1. Introduction
- 1.1. Research Scope
- 1.2. Market Segmentation
- 1.3. Research Objective
- 1.4. Definitions and Assumptions
- 2. Executive Summary
- 2.1. Market Snapshot
- 3. Market Dynamics
- 3.1. Market Drivers
- 3.2. Market Restrains
- 3.3. Market Trends
- 3.4. Market Opportunities
- 4. Market Factor Analysis
- 4.1. Porters Five Forces
- 4.1.1. Bargaining Power of Suppliers
- 4.1.2. Bargaining Power of Buyers
- 4.1.3. Threat of New Entrants
- 4.1.4. Threat of Substitutes
- 4.1.5. Competitive Rivalry
- 4.2. PESTEL analysis
- 4.3. BCG Analysis
- 4.3.1. Stars (High Growth, High Market Share)
- 4.3.2. Cash Cows (Low Growth, High Market Share)
- 4.3.3. Question Mark (High Growth, Low Market Share)
- 4.3.4. Dogs (Low Growth, Low Market Share)
- 4.4. Ansoff Matrix Analysis
- 4.5. Supply Chain Analysis
- 4.6. Regulatory Landscape
- 4.7. Current Market Potential and Opportunity Assessment (TAM–SAM–SOM Framework)
- 4.8. RAX Analyst Note
- 4.1. Porters Five Forces
- 5. Market Analysis, Insights and Forecast 2021-2033
- 5.1. Market Analysis, Insights and Forecast - by Grade
- 5.1.1. Industrial Grade (purity: 99.0% to 99.8%)
- 5.1.2. 3N
- 5.1.3. 4N
- 5.2. Market Analysis, Insights and Forecast - by Application
- 5.2.1. Niobium Metal
- 5.2.2. Optical Glass
- 5.2.3. Supercapacitors
- 5.2.4. Superalloys
- 5.2.5. Ceramics
- 5.2.6. Other Applications
- 5.3. Market Analysis, Insights and Forecast - by Region
- 5.3.1. Asia Pacific
- 5.3.2. North America
- 5.3.3. Europe
- 5.3.4. South America
- 5.3.5. Middle East and Africa
- 5.1. Market Analysis, Insights and Forecast - by Grade
- 6. Global Niobium Pentoxide Market Analysis, Insights and Forecast, 2021-2033
- 6.1. Market Analysis, Insights and Forecast - by Grade
- 6.1.1. Industrial Grade (purity: 99.0% to 99.8%)
- 6.1.2. 3N
- 6.1.3. 4N
- 6.2. Market Analysis, Insights and Forecast - by Application
- 6.2.1. Niobium Metal
- 6.2.2. Optical Glass
- 6.2.3. Supercapacitors
- 6.2.4. Superalloys
- 6.2.5. Ceramics
- 6.2.6. Other Applications
- 6.1. Market Analysis, Insights and Forecast - by Grade
- 7. Asia Pacific Niobium Pentoxide Market Analysis, Insights and Forecast, 2020-2032
- 7.1. Market Analysis, Insights and Forecast - by Grade
- 7.1.1. Industrial Grade (purity: 99.0% to 99.8%)
- 7.1.2. 3N
- 7.1.3. 4N
- 7.2. Market Analysis, Insights and Forecast - by Application
- 7.2.1. Niobium Metal
- 7.2.2. Optical Glass
- 7.2.3. Supercapacitors
- 7.2.4. Superalloys
- 7.2.5. Ceramics
- 7.2.6. Other Applications
- 7.1. Market Analysis, Insights and Forecast - by Grade
- 8. North America Niobium Pentoxide Market Analysis, Insights and Forecast, 2020-2032
- 8.1. Market Analysis, Insights and Forecast - by Grade
- 8.1.1. Industrial Grade (purity: 99.0% to 99.8%)
- 8.1.2. 3N
- 8.1.3. 4N
- 8.2. Market Analysis, Insights and Forecast - by Application
- 8.2.1. Niobium Metal
- 8.2.2. Optical Glass
- 8.2.3. Supercapacitors
- 8.2.4. Superalloys
- 8.2.5. Ceramics
- 8.2.6. Other Applications
- 8.1. Market Analysis, Insights and Forecast - by Grade
- 9. Europe Niobium Pentoxide Market Analysis, Insights and Forecast, 2020-2032
- 9.1. Market Analysis, Insights and Forecast - by Grade
- 9.1.1. Industrial Grade (purity: 99.0% to 99.8%)
- 9.1.2. 3N
- 9.1.3. 4N
- 9.2. Market Analysis, Insights and Forecast - by Application
- 9.2.1. Niobium Metal
- 9.2.2. Optical Glass
- 9.2.3. Supercapacitors
- 9.2.4. Superalloys
- 9.2.5. Ceramics
- 9.2.6. Other Applications
- 9.1. Market Analysis, Insights and Forecast - by Grade
- 10. South America Niobium Pentoxide Market Analysis, Insights and Forecast, 2020-2032
- 10.1. Market Analysis, Insights and Forecast - by Grade
- 10.1.1. Industrial Grade (purity: 99.0% to 99.8%)
- 10.1.2. 3N
- 10.1.3. 4N
- 10.2. Market Analysis, Insights and Forecast - by Application
- 10.2.1. Niobium Metal
- 10.2.2. Optical Glass
- 10.2.3. Supercapacitors
- 10.2.4. Superalloys
- 10.2.5. Ceramics
- 10.2.6. Other Applications
- 10.1. Market Analysis, Insights and Forecast - by Grade
- 11. Middle East and Africa Niobium Pentoxide Market Analysis, Insights and Forecast, 2020-2032
- 11.1. Market Analysis, Insights and Forecast - by Grade
- 11.1.1. Industrial Grade (purity: 99.0% to 99.8%)
- 11.1.2. 3N
- 11.1.3. 4N
- 11.2. Market Analysis, Insights and Forecast - by Application
- 11.2.1. Niobium Metal
- 11.2.2. Optical Glass
- 11.2.3. Supercapacitors
- 11.2.4. Superalloys
- 11.2.5. Ceramics
- 11.2.6. Other Applications
- 11.1. Market Analysis, Insights and Forecast - by Grade
- 12. Competitive Analysis
- 12.1. Company Profiles
- 12.1.1 Solikamsk Magnesium Plant OJSC
- 12.1.1.1. Company Overview
- 12.1.1.2. Products
- 12.1.1.3. Company Financials
- 12.1.1.4. SWOT Analysis
- 12.1.2 Taki Chemical Co Ltd
- 12.1.2.1. Company Overview
- 12.1.2.2. Products
- 12.1.2.3. Company Financials
- 12.1.2.4. SWOT Analysis
- 12.1.3 MPIL
- 12.1.3.1. Company Overview
- 12.1.3.2. Products
- 12.1.3.3. Company Financials
- 12.1.3.4. SWOT Analysis
- 12.1.4 AMG
- 12.1.4.1. Company Overview
- 12.1.4.2. Products
- 12.1.4.3. Company Financials
- 12.1.4.4. SWOT Analysis
- 12.1.5 Mitsui Mining & Smelting Co Ltd
- 12.1.5.1. Company Overview
- 12.1.5.2. Products
- 12.1.5.3. Company Financials
- 12.1.5.4. SWOT Analysis
- 12.1.6 JX Nippon Mining & Metals Corporation
- 12.1.6.1. Company Overview
- 12.1.6.2. Products
- 12.1.6.3. Company Financials
- 12.1.6.4. SWOT Analysis
- 12.1.7 F&X Electro-Materials Limited
- 12.1.7.1. Company Overview
- 12.1.7.2. Products
- 12.1.7.3. Company Financials
- 12.1.7.4. SWOT Analysis
- 12.1.8 King-Tan Tantalum Industry Ltd
- 12.1.8.1. Company Overview
- 12.1.8.2. Products
- 12.1.8.3. Company Financials
- 12.1.8.4. SWOT Analysis
- 12.1.9 XIMEI Resources Holding Limited*List Not Exhaustive
- 12.1.9.1. Company Overview
- 12.1.9.2. Products
- 12.1.9.3. Company Financials
- 12.1.9.4. SWOT Analysis
- 12.1.10 CBMM
- 12.1.10.1. Company Overview
- 12.1.10.2. Products
- 12.1.10.3. Company Financials
- 12.1.10.4. SWOT Analysis
- 12.1.1 Solikamsk Magnesium Plant OJSC
- 12.2. Market Entropy
- 12.2.1 Company's Key Areas Served
- 12.2.2 Recent Developments
- 12.3. Company Market Share Analysis 2025
- 12.3.1 Top 5 Companies Market Share Analysis
- 12.3.2 Top 3 Companies Market Share Analysis
- 12.4. List of Potential Customers
- 13. Research Methodology
List of Figures
- Figure 1: Global Niobium Pentoxide Market Revenue Breakdown (million, %) by Region 2025 & 2033
- Figure 2: Asia Pacific Niobium Pentoxide Market Revenue (million), by Grade 2025 & 2033
- Figure 3: Asia Pacific Niobium Pentoxide Market Revenue Share (%), by Grade 2025 & 2033
- Figure 4: Asia Pacific Niobium Pentoxide Market Revenue (million), by Application 2025 & 2033
- Figure 5: Asia Pacific Niobium Pentoxide Market Revenue Share (%), by Application 2025 & 2033
- Figure 6: Asia Pacific Niobium Pentoxide Market Revenue (million), by Country 2025 & 2033
- Figure 7: Asia Pacific Niobium Pentoxide Market Revenue Share (%), by Country 2025 & 2033
- Figure 8: North America Niobium Pentoxide Market Revenue (million), by Grade 2025 & 2033
- Figure 9: North America Niobium Pentoxide Market Revenue Share (%), by Grade 2025 & 2033
- Figure 10: North America Niobium Pentoxide Market Revenue (million), by Application 2025 & 2033
- Figure 11: North America Niobium Pentoxide Market Revenue Share (%), by Application 2025 & 2033
- Figure 12: North America Niobium Pentoxide Market Revenue (million), by Country 2025 & 2033
- Figure 13: North America Niobium Pentoxide Market Revenue Share (%), by Country 2025 & 2033
- Figure 14: Europe Niobium Pentoxide Market Revenue (million), by Grade 2025 & 2033
- Figure 15: Europe Niobium Pentoxide Market Revenue Share (%), by Grade 2025 & 2033
- Figure 16: Europe Niobium Pentoxide Market Revenue (million), by Application 2025 & 2033
- Figure 17: Europe Niobium Pentoxide Market Revenue Share (%), by Application 2025 & 2033
- Figure 18: Europe Niobium Pentoxide Market Revenue (million), by Country 2025 & 2033
- Figure 19: Europe Niobium Pentoxide Market Revenue Share (%), by Country 2025 & 2033
- Figure 20: South America Niobium Pentoxide Market Revenue (million), by Grade 2025 & 2033
- Figure 21: South America Niobium Pentoxide Market Revenue Share (%), by Grade 2025 & 2033
- Figure 22: South America Niobium Pentoxide Market Revenue (million), by Application 2025 & 2033
- Figure 23: South America Niobium Pentoxide Market Revenue Share (%), by Application 2025 & 2033
- Figure 24: South America Niobium Pentoxide Market Revenue (million), by Country 2025 & 2033
- Figure 25: South America Niobium Pentoxide Market Revenue Share (%), by Country 2025 & 2033
- Figure 26: Middle East and Africa Niobium Pentoxide Market Revenue (million), by Grade 2025 & 2033
- Figure 27: Middle East and Africa Niobium Pentoxide Market Revenue Share (%), by Grade 2025 & 2033
- Figure 28: Middle East and Africa Niobium Pentoxide Market Revenue (million), by Application 2025 & 2033
- Figure 29: Middle East and Africa Niobium Pentoxide Market Revenue Share (%), by Application 2025 & 2033
- Figure 30: Middle East and Africa Niobium Pentoxide Market Revenue (million), by Country 2025 & 2033
- Figure 31: Middle East and Africa Niobium Pentoxide Market Revenue Share (%), by Country 2025 & 2033
List of Tables
- Table 1: Global Niobium Pentoxide Market Revenue million Forecast, by Grade 2020 & 2033
- Table 2: Global Niobium Pentoxide Market Revenue million Forecast, by Application 2020 & 2033
- Table 3: Global Niobium Pentoxide Market Revenue million Forecast, by Region 2020 & 2033
- Table 4: Global Niobium Pentoxide Market Revenue million Forecast, by Grade 2020 & 2033
- Table 5: Global Niobium Pentoxide Market Revenue million Forecast, by Application 2020 & 2033
- Table 6: Global Niobium Pentoxide Market Revenue million Forecast, by Country 2020 & 2033
- Table 7: China Niobium Pentoxide Market Revenue (million) Forecast, by Application 2020 & 2033
- Table 8: India Niobium Pentoxide Market Revenue (million) Forecast, by Application 2020 & 2033
- Table 9: Japan Niobium Pentoxide Market Revenue (million) Forecast, by Application 2020 & 2033
- Table 10: South Korea Niobium Pentoxide Market Revenue (million) Forecast, by Application 2020 & 2033
- Table 11: Rest of Asia Pacific Niobium Pentoxide Market Revenue (million) Forecast, by Application 2020 & 2033
- Table 12: Global Niobium Pentoxide Market Revenue million Forecast, by Grade 2020 & 2033
- Table 13: Global Niobium Pentoxide Market Revenue million Forecast, by Application 2020 & 2033
- Table 14: Global Niobium Pentoxide Market Revenue million Forecast, by Country 2020 & 2033
- Table 15: United States Niobium Pentoxide Market Revenue (million) Forecast, by Application 2020 & 2033
- Table 16: Canada Niobium Pentoxide Market Revenue (million) Forecast, by Application 2020 & 2033
- Table 17: Mexico Niobium Pentoxide Market Revenue (million) Forecast, by Application 2020 & 2033
- Table 18: Global Niobium Pentoxide Market Revenue million Forecast, by Grade 2020 & 2033
- Table 19: Global Niobium Pentoxide Market Revenue million Forecast, by Application 2020 & 2033
- Table 20: Global Niobium Pentoxide Market Revenue million Forecast, by Country 2020 & 2033
- Table 21: Germany Niobium Pentoxide Market Revenue (million) Forecast, by Application 2020 & 2033
- Table 22: United Kingdom Niobium Pentoxide Market Revenue (million) Forecast, by Application 2020 & 2033
- Table 23: France Niobium Pentoxide Market Revenue (million) Forecast, by Application 2020 & 2033
- Table 24: Italy Niobium Pentoxide Market Revenue (million) Forecast, by Application 2020 & 2033
- Table 25: Rest of Europe Niobium Pentoxide Market Revenue (million) Forecast, by Application 2020 & 2033
- Table 26: Global Niobium Pentoxide Market Revenue million Forecast, by Grade 2020 & 2033
- Table 27: Global Niobium Pentoxide Market Revenue million Forecast, by Application 2020 & 2033
- Table 28: Global Niobium Pentoxide Market Revenue million Forecast, by Country 2020 & 2033
- Table 29: Brazil Niobium Pentoxide Market Revenue (million) Forecast, by Application 2020 & 2033
- Table 30: Argentina Niobium Pentoxide Market Revenue (million) Forecast, by Application 2020 & 2033
- Table 31: Rest of South America Niobium Pentoxide Market Revenue (million) Forecast, by Application 2020 & 2033
- Table 32: Global Niobium Pentoxide Market Revenue million Forecast, by Grade 2020 & 2033
- Table 33: Global Niobium Pentoxide Market Revenue million Forecast, by Application 2020 & 2033
- Table 34: Global Niobium Pentoxide Market Revenue million Forecast, by Country 2020 & 2033
- Table 35: Saudi Arabia Niobium Pentoxide Market Revenue (million) Forecast, by Application 2020 & 2033
- Table 36: South Africa Niobium Pentoxide Market Revenue (million) Forecast, by Application 2020 & 2033
- Table 37: Rest of Middle East and Africa Niobium Pentoxide Market Revenue (million) Forecast, by Application 2020 & 2033
Frequently Asked Questions
1. What is the projected Compound Annual Growth Rate (CAGR) of the Niobium Pentoxide Market?
The projected CAGR is approximately 5.6%.
2. Which companies are prominent players in the Niobium Pentoxide Market?
Key companies in the market include Solikamsk Magnesium Plant OJSC, Taki Chemical Co Ltd, MPIL, AMG, Mitsui Mining & Smelting Co Ltd, JX Nippon Mining & Metals Corporation, F&X Electro-Materials Limited, King-Tan Tantalum Industry Ltd, XIMEI Resources Holding Limited*List Not Exhaustive, CBMM.
3. What are the main segments of the Niobium Pentoxide Market?
The market segments include Grade, Application.
4. Can you provide details about the market size?
The market size is estimated to be USD 270.2 million as of 2022.
5. What are some drivers contributing to market growth?
Growing Demand from the Electric Vehicles Segment; Growing Demand for High-Quality Steel from the Manufacturing Sector.
6. What are the notable trends driving market growth?
Increasing Usage in the Production of Niobium Metal.
7. Are there any restraints impacting market growth?
Concerns About Health Issues on Acute Exposure.
8. Can you provide examples of recent developments in the market?
December 2022: CBMM announced a USD 80 million investment to expand niobium oxide capacity from 500 tons to 3,000 tons by 2024. Through a collaboration with Echion Technologies, CBMM plans to establish a niobium oxide facility at its Araxá plant in Minas Gerais, Brazil, aligning with its goal of achieving a niobium oxide capacity of 40,000 t by 2030.
9. What pricing options are available for accessing the report?
Pricing options include single-user, multi-user, and enterprise licenses priced at USD 4750, USD 5250, and USD 8750 respectively.
10. Is the market size provided in terms of value or volume?
The market size is provided in terms of value, measured in million.
11. Are there any specific market keywords associated with the report?
Yes, the market keyword associated with the report is "Niobium Pentoxide Market," which aids in identifying and referencing the specific market segment covered.
12. How do I determine which pricing option suits my needs best?
The pricing options vary based on user requirements and access needs. Individual users may opt for single-user licenses, while businesses requiring broader access may choose multi-user or enterprise licenses for cost-effective access to the report.
13. Are there any additional resources or data provided in the Niobium Pentoxide Market report?
While the report offers comprehensive insights, it's advisable to review the specific contents or supplementary materials provided to ascertain if additional resources or data are available.
14. How can I stay updated on further developments or reports in the Niobium Pentoxide Market?
To stay informed about further developments, trends, and reports in the Niobium Pentoxide Market, consider subscribing to industry newsletters, following relevant companies and organizations, or regularly checking reputable industry news sources and publications.
Methodology
Step 1 - Identification of Relevant Samples Size from Population Database


Step 2 - Approaches for Defining Global Market Size (Value, Volume* & Price*)

Note*: In applicable scenarios
Step 3 - Data Sources
Primary Research
- Web Analytics
- Survey Reports
- Research Institute
- Latest Research Reports
- Opinion Leaders
Secondary Research
- Annual Reports
- White Paper
- Latest Press Release
- Industry Association
- Paid Database
- Investor Presentations

Step 4 - Data Triangulation
Involves using different sources of information in order to increase the validity of a study
These sources are likely to be stakeholders in a program - participants, other researchers, program staff, other community members, and so on.
Then we put all data in single framework & apply various statistical tools to find out the dynamic on the market.
During the analysis stage, feedback from the stakeholder groups would be compared to determine areas of agreement as well as areas of divergence