

Key Insights
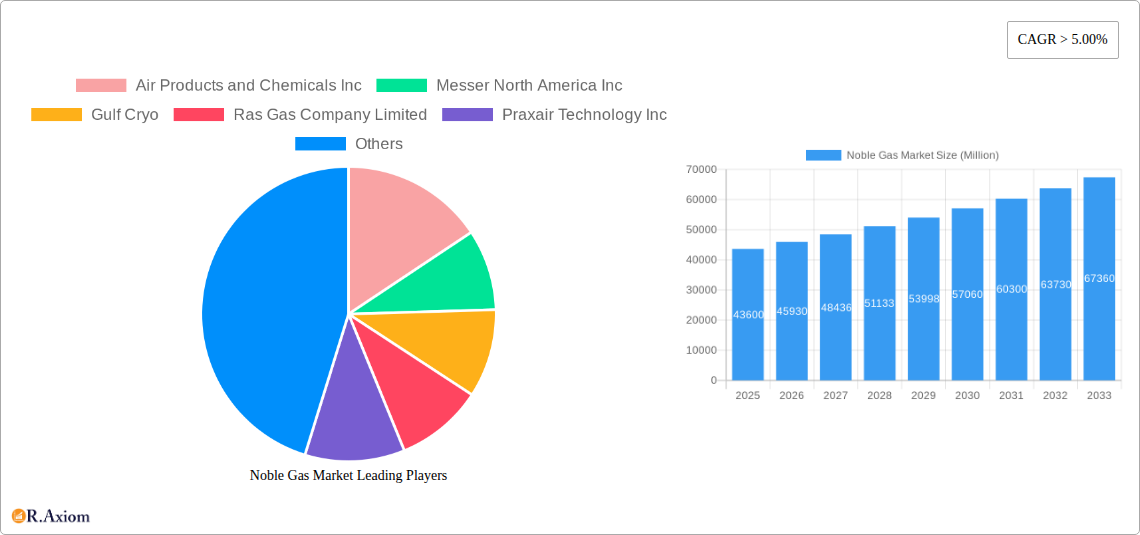
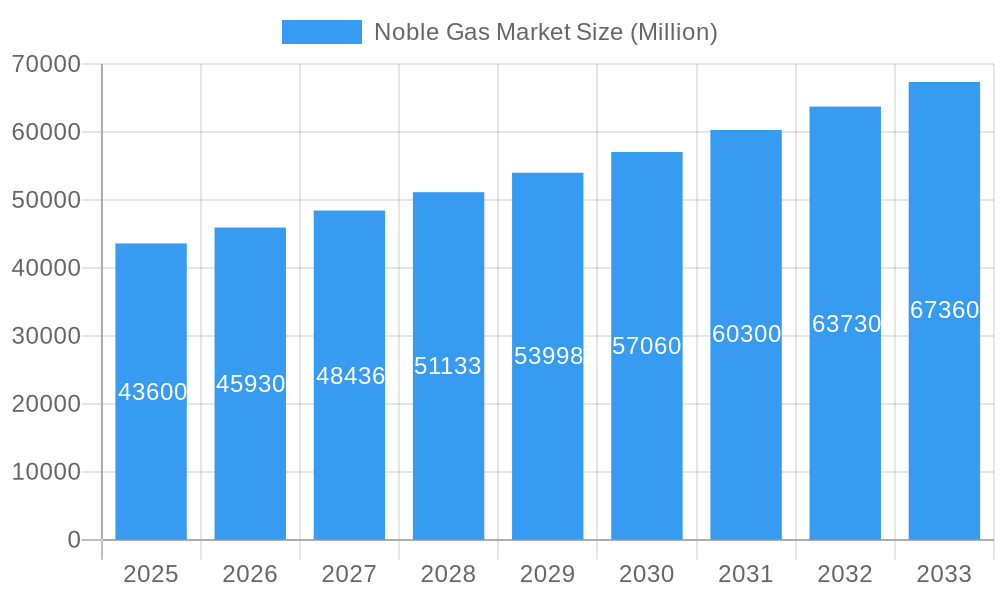
The global noble gas market, valued at $43,600 million in 2025, is projected to experience robust growth, exhibiting a Compound Annual Growth Rate (CAGR) exceeding 5.00% from 2025 to 2033. This expansion is driven by increasing demand across diverse sectors. The healthcare industry's reliance on noble gases for medical applications like anesthesia and medical imaging significantly fuels market growth. Simultaneously, the burgeoning oil and gas, aerospace, and construction industries are key contributors, demanding noble gases for welding, insulation, and specialized equipment. Technological advancements in lighting, picture projection, and refrigeration are further propelling market expansion. Specific growth drivers include the rise of sophisticated analytical techniques utilizing noble gases in chemical analysis and the growing adoption of energy-efficient lighting technologies. However, the market faces challenges, including the inherent scarcity of certain noble gases like helium and xenon, and the associated price volatility. Furthermore, stringent regulations regarding the handling and transportation of radioactive noble gases like radon pose a restraint to market growth. The market's segmentation reveals significant opportunities within specific application areas. For instance, helium's dominance in cryogenics and its application in MRI machines contributes significantly to the market's overall value. Similarly, xenon's use in medical imaging and lighting contributes to substantial segment-specific growth. The geographical distribution showcases significant regional variations, with North America and Europe holding substantial market shares, driven by advanced economies and technological advancements. The Asia-Pacific region, however, is anticipated to exhibit rapid growth fueled by industrialization and increasing infrastructure development.
Noble Gas Market Market Size (In Billion)
The competitive landscape is characterized by both large multinational corporations and regional players. Key players such as Air Products and Chemicals Inc., Messer North America Inc., and Linde plc dominate the market, leveraging their established infrastructure and expertise. However, the market also encompasses several smaller, specialized companies that cater to niche applications. Strategic partnerships, technological innovations, and acquisitions are expected to reshape the market's competitive dynamics in the forecast period. The market's future trajectory hinges on technological innovations impacting production efficiency, stricter environmental regulations, and the discovery of alternative applications for noble gases. The consistent rise in global industrialization and technological advancement is likely to sustain the market's growth momentum throughout the forecast period, making it a lucrative sector for both existing and emerging players.
Noble Gas Market Company Market Share
This in-depth report provides a comprehensive analysis of the global noble gas market, covering historical data (2019-2024), the base year (2025), and a forecast up to 2033. It offers actionable insights into market dynamics, segmentation, competitive landscape, and future growth prospects, essential for industry stakeholders, investors, and strategic decision-makers. The report leverages extensive primary and secondary research to provide a holistic view of this crucial sector.
Noble Gas Market Market Concentration & Innovation
The noble gas market exhibits a moderately concentrated structure, dominated by a handful of multinational corporations with significant market share. These players leverage extensive production capacities, established distribution networks, and strong research & development capabilities. Market share data for 2024 indicates that Linde plc and Air Products and Chemicals Inc hold approximately xx% and xx% respectively, while other key players like Air Liquide, Messer Group, and Praxair Technology Inc collectively control a substantial portion of the remaining market.
Innovation in the noble gas market is primarily driven by the development of more efficient and cost-effective extraction and purification technologies, alongside advancements in downstream applications. Regulatory frameworks concerning environmental impact and resource management are increasingly influencing industry practices, stimulating the adoption of sustainable methods for noble gas production and utilization. The rise of substitute materials in specific applications exerts competitive pressure, while mergers and acquisitions (M&A) reshape the market landscape. The total value of M&A deals in the sector during 2019-2024 is estimated at USD xx Billion, indicating significant consolidation.
- Key Drivers of Innovation: Improved extraction technologies, advanced purification methods, application diversification.
- Regulatory Factors: Emission standards, resource management policies.
- M&A Activity: Significant consolidation driven by economies of scale and market expansion.
- Substitute Materials: Growing competition from alternative materials in certain applications.
Noble Gas Market Industry Trends & Insights
The global noble gas market is projected to witness substantial growth during the forecast period (2025-2033), with a Compound Annual Growth Rate (CAGR) estimated at xx%. This growth is propelled by increasing demand across various end-user industries, driven by factors such as rising industrialization, technological advancements, and expansion of healthcare and aerospace sectors. Market penetration of noble gases in new applications, such as advanced materials and energy storage, further fuels market expansion. The increasing adoption of energy-efficient technologies across different sectors also contributes significantly to the noble gas market growth. However, price volatility associated with raw materials and fluctuating energy costs pose challenges to market expansion. Competitive dynamics are characterized by both rivalry among established players and the emergence of niche players focusing on specialized applications.
Dominant Markets & Segments in Noble Gas Market
Leading Regions & Countries: North America and Europe currently dominate the global noble gas market, driven by robust industrial activities and mature healthcare and aerospace sectors. Asia-Pacific is poised for significant growth, fueled by rapid industrialization and infrastructure development.
Dominant Segments:
- By Type: Helium dominates the market due to its wide-ranging applications in various sectors, followed by Argon and Neon.
- By Application: Welding accounts for the largest share, driven by substantial demand from the manufacturing and construction industries. Other major applications include Healthcare, Refrigeration and others.
- By End-user Industry: The Oil & Gas sector shows the highest demand, followed by the healthcare and aerospace sectors.
Key Drivers:
- Economic Policies: Government incentives for industrial development and technological advancement.
- Infrastructure Development: Growth in construction and infrastructure projects.
- Technological Advancements: Adoption of new technologies across industries driving noble gas demand.
Noble Gas Market Product Developments
Recent product innovations focus on enhancing purity levels, developing specialized gas mixtures for specific applications, and improving the efficiency of delivery systems. Companies are investing in innovative packaging solutions and supply chain management to improve the overall cost-effectiveness and safety of noble gas products. The integration of advanced sensors and monitoring systems in the delivery systems enhances the reliability and precision for varied applications. These advancements cater to the evolving needs of various industries and improve overall customer satisfaction.
Report Scope & Segmentation Analysis
The report comprehensively segments the noble gas market by Type (Helium, Krypton, Argon, Neon, Xenon, Radioactive Radon), Application (Picture Projection, Anesthetic, Welding, Insulation, Lighting, Television Tubes, Advertising, Refrigerant, Working Fluid, Chemical Analysis), and End-user Industry (Oil and Gas, Mining, Healthcare, Aerospace, Construction, Energy and Power). Each segment's market size, growth projections, and competitive dynamics are meticulously analyzed, providing a granular understanding of market opportunities. The market size for Helium in 2025 is estimated at USD xx Million, while Argon is projected to reach USD xx Million by 2033. The Healthcare segment is expected to exhibit a significant CAGR during the forecast period.
Key Drivers of Noble Gas Market Growth
The noble gas market's growth is primarily driven by the expanding applications in various end-use industries. The increasing demand from the healthcare, oil and gas sectors, and the rising adoption of advanced technologies in manufacturing and construction are key factors. Stringent regulatory standards regarding the use of traditional materials and the search for cleaner alternatives are also bolstering the market. Moreover, economic growth in developing economies is significantly impacting the demand for noble gases.
Challenges in the Noble Gas Market Sector
The noble gas market faces challenges such as price volatility of raw materials, stringent environmental regulations, and intense competition among established players. Supply chain disruptions can also lead to significant price fluctuations, impacting profitability. Furthermore, technological advancements leading to the emergence of substitute materials pose a threat to market share of some applications.
Emerging Opportunities in Noble Gas Market
Emerging opportunities in the noble gas market include the growing demand for high-purity gases in specialized applications, the expansion of the healthcare industry and increasing demand from renewable energy sectors. Advances in gas separation and purification technologies are creating new possibilities for cost-effective noble gas production. Emerging economies and increasing technological advancements will create additional growth opportunities in the future.
Leading Players in the Noble Gas Market Market
- Air Products and Chemicals Inc (Air Products and Chemicals Inc)
- Messer North America Inc
- Gulf Cryo
- Ras Gas Company Limited
- Praxair Technology Inc
- BASF SE (BASF SE)
- ITM Power
- Linde plc (Linde plc)
- American Gas
- TAIYO NIPPON SANSO CORPORATION
- Royal Dutch Shell PLC (Royal Dutch Shell PLC)
- Buzwair Industrial Gases Factories
- Air Liquide (Air Liquide)
- Airgas Inc
Key Developments in Noble Gas Market Industry
- April 2022: Linde signed an off-take agreement to recover helium from Freeport LNG's Texas production site and will construct a helium processing plant in the US. This expands Linde's helium production capacity and strengthens its position in the market.
- November 2022: Air Products secured USD 1.07 billion in contracts to supply 33 million liters of liquid helium to NASA's Kennedy Space Center. This substantial contract highlights the crucial role of helium in aerospace applications and underscores Air Products' market leadership.
Strategic Outlook for Noble Gas Market Market
The noble gas market is poised for continued growth, driven by technological advancements, expanding applications across diverse sectors, and increasing investments in R&D. The focus on sustainability and resource efficiency will drive the adoption of innovative extraction and purification technologies. The increasing demand from emerging economies presents significant opportunities for market expansion and presents a lucrative environment for existing players to explore expansion opportunities.
Noble Gas Market Segmentation
-
1. Type
- 1.1. Helium
- 1.2. Krypton
- 1.3. Argon
- 1.4. Neon
- 1.5. Xenon
- 1.6. Radioactive Radon
-
2. Application
- 2.1. Picture Projection
- 2.2. Anesthetic
- 2.3. Welding
- 2.4. Insulation
- 2.5. Lighting
- 2.6. Television Tubes
- 2.7. Advertising
- 2.8. Refrigerant
- 2.9. Working Fluid
- 2.10. Chemical Analysis
-
3. End-user Industry
- 3.1. Oil and Gas
- 3.2. Mining
- 3.3. Healthcare
- 3.4. Aerospace
- 3.5. Construction
- 3.6. Energy and Power
Noble Gas Market Segmentation By Geography
-
1. Asia Pacific
- 1.1. China
- 1.2. India
- 1.3. Japan
- 1.4. South Korea
- 1.5. Rest of Asia Pacific
-
2. North America
- 2.1. United States
- 2.2. Canada
- 2.3. Mexico
-
3. Europe
- 3.1. Germany
- 3.2. United Kingdom
- 3.3. Italy
- 3.4. France
- 3.5. Rest of Europe
-
4. South America
- 4.1. Brazil
- 4.2. Argentina
- 4.3. Rest of South America
- 5. Middle East
-
6. Saudi Arabia
- 6.1. South Africa
- 6.2. Rest of Middle East
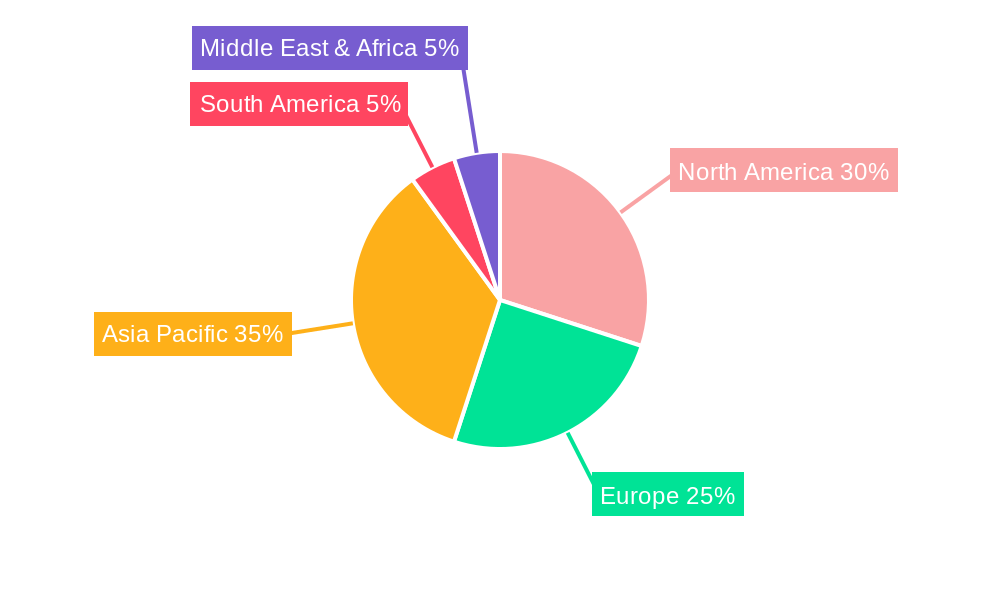
Noble Gas Market Regional Market Share
Geographic Coverage of Noble Gas Market
Noble Gas Market REPORT HIGHLIGHTS
| Aspects | Details |
|---|---|
| Study Period | 2020-2034 |
| Base Year | 2025 |
| Estimated Year | 2026 |
| Forecast Period | 2026-2034 |
| Historical Period | 2020-2025 |
| Growth Rate | CAGR of > 5.00% from 2020-2034 |
| Segmentation |
|
Table of Contents
- 1. Introduction
- 1.1. Research Scope
- 1.2. Market Segmentation
- 1.3. Research Objective
- 1.4. Definitions and Assumptions
- 2. Executive Summary
- 2.1. Market Snapshot
- 3. Market Dynamics
- 3.1. Market Drivers
- 3.2. Market Restrains
- 3.3. Market Trends
- 3.4. Market Opportunities
- 4. Market Factor Analysis
- 4.1. Porters Five Forces
- 4.1.1. Bargaining Power of Suppliers
- 4.1.2. Bargaining Power of Buyers
- 4.1.3. Threat of New Entrants
- 4.1.4. Threat of Substitutes
- 4.1.5. Competitive Rivalry
- 4.2. PESTEL analysis
- 4.3. BCG Analysis
- 4.3.1. Stars (High Growth, High Market Share)
- 4.3.2. Cash Cows (Low Growth, High Market Share)
- 4.3.3. Question Mark (High Growth, Low Market Share)
- 4.3.4. Dogs (Low Growth, Low Market Share)
- 4.4. Ansoff Matrix Analysis
- 4.5. Supply Chain Analysis
- 4.6. Regulatory Landscape
- 4.7. Current Market Potential and Opportunity Assessment (TAM–SAM–SOM Framework)
- 4.8. RAX Analyst Note
- 4.1. Porters Five Forces
- 5. Market Analysis, Insights and Forecast 2021-2033
- 5.1. Market Analysis, Insights and Forecast - by Type
- 5.1.1. Helium
- 5.1.2. Krypton
- 5.1.3. Argon
- 5.1.4. Neon
- 5.1.5. Xenon
- 5.1.6. Radioactive Radon
- 5.2. Market Analysis, Insights and Forecast - by Application
- 5.2.1. Picture Projection
- 5.2.2. Anesthetic
- 5.2.3. Welding
- 5.2.4. Insulation
- 5.2.5. Lighting
- 5.2.6. Television Tubes
- 5.2.7. Advertising
- 5.2.8. Refrigerant
- 5.2.9. Working Fluid
- 5.2.10. Chemical Analysis
- 5.3. Market Analysis, Insights and Forecast - by End-user Industry
- 5.3.1. Oil and Gas
- 5.3.2. Mining
- 5.3.3. Healthcare
- 5.3.4. Aerospace
- 5.3.5. Construction
- 5.3.6. Energy and Power
- 5.4. Market Analysis, Insights and Forecast - by Region
- 5.4.1. Asia Pacific
- 5.4.2. North America
- 5.4.3. Europe
- 5.4.4. South America
- 5.4.5. Middle East
- 5.4.6. Saudi Arabia
- 5.1. Market Analysis, Insights and Forecast - by Type
- 6. Global Noble Gas Market Analysis, Insights and Forecast, 2021-2033
- 6.1. Market Analysis, Insights and Forecast - by Type
- 6.1.1. Helium
- 6.1.2. Krypton
- 6.1.3. Argon
- 6.1.4. Neon
- 6.1.5. Xenon
- 6.1.6. Radioactive Radon
- 6.2. Market Analysis, Insights and Forecast - by Application
- 6.2.1. Picture Projection
- 6.2.2. Anesthetic
- 6.2.3. Welding
- 6.2.4. Insulation
- 6.2.5. Lighting
- 6.2.6. Television Tubes
- 6.2.7. Advertising
- 6.2.8. Refrigerant
- 6.2.9. Working Fluid
- 6.2.10. Chemical Analysis
- 6.3. Market Analysis, Insights and Forecast - by End-user Industry
- 6.3.1. Oil and Gas
- 6.3.2. Mining
- 6.3.3. Healthcare
- 6.3.4. Aerospace
- 6.3.5. Construction
- 6.3.6. Energy and Power
- 6.1. Market Analysis, Insights and Forecast - by Type
- 7. Asia Pacific Noble Gas Market Analysis, Insights and Forecast, 2020-2032
- 7.1. Market Analysis, Insights and Forecast - by Type
- 7.1.1. Helium
- 7.1.2. Krypton
- 7.1.3. Argon
- 7.1.4. Neon
- 7.1.5. Xenon
- 7.1.6. Radioactive Radon
- 7.2. Market Analysis, Insights and Forecast - by Application
- 7.2.1. Picture Projection
- 7.2.2. Anesthetic
- 7.2.3. Welding
- 7.2.4. Insulation
- 7.2.5. Lighting
- 7.2.6. Television Tubes
- 7.2.7. Advertising
- 7.2.8. Refrigerant
- 7.2.9. Working Fluid
- 7.2.10. Chemical Analysis
- 7.3. Market Analysis, Insights and Forecast - by End-user Industry
- 7.3.1. Oil and Gas
- 7.3.2. Mining
- 7.3.3. Healthcare
- 7.3.4. Aerospace
- 7.3.5. Construction
- 7.3.6. Energy and Power
- 7.1. Market Analysis, Insights and Forecast - by Type
- 8. North America Noble Gas Market Analysis, Insights and Forecast, 2020-2032
- 8.1. Market Analysis, Insights and Forecast - by Type
- 8.1.1. Helium
- 8.1.2. Krypton
- 8.1.3. Argon
- 8.1.4. Neon
- 8.1.5. Xenon
- 8.1.6. Radioactive Radon
- 8.2. Market Analysis, Insights and Forecast - by Application
- 8.2.1. Picture Projection
- 8.2.2. Anesthetic
- 8.2.3. Welding
- 8.2.4. Insulation
- 8.2.5. Lighting
- 8.2.6. Television Tubes
- 8.2.7. Advertising
- 8.2.8. Refrigerant
- 8.2.9. Working Fluid
- 8.2.10. Chemical Analysis
- 8.3. Market Analysis, Insights and Forecast - by End-user Industry
- 8.3.1. Oil and Gas
- 8.3.2. Mining
- 8.3.3. Healthcare
- 8.3.4. Aerospace
- 8.3.5. Construction
- 8.3.6. Energy and Power
- 8.1. Market Analysis, Insights and Forecast - by Type
- 9. Europe Noble Gas Market Analysis, Insights and Forecast, 2020-2032
- 9.1. Market Analysis, Insights and Forecast - by Type
- 9.1.1. Helium
- 9.1.2. Krypton
- 9.1.3. Argon
- 9.1.4. Neon
- 9.1.5. Xenon
- 9.1.6. Radioactive Radon
- 9.2. Market Analysis, Insights and Forecast - by Application
- 9.2.1. Picture Projection
- 9.2.2. Anesthetic
- 9.2.3. Welding
- 9.2.4. Insulation
- 9.2.5. Lighting
- 9.2.6. Television Tubes
- 9.2.7. Advertising
- 9.2.8. Refrigerant
- 9.2.9. Working Fluid
- 9.2.10. Chemical Analysis
- 9.3. Market Analysis, Insights and Forecast - by End-user Industry
- 9.3.1. Oil and Gas
- 9.3.2. Mining
- 9.3.3. Healthcare
- 9.3.4. Aerospace
- 9.3.5. Construction
- 9.3.6. Energy and Power
- 9.1. Market Analysis, Insights and Forecast - by Type
- 10. South America Noble Gas Market Analysis, Insights and Forecast, 2020-2032
- 10.1. Market Analysis, Insights and Forecast - by Type
- 10.1.1. Helium
- 10.1.2. Krypton
- 10.1.3. Argon
- 10.1.4. Neon
- 10.1.5. Xenon
- 10.1.6. Radioactive Radon
- 10.2. Market Analysis, Insights and Forecast - by Application
- 10.2.1. Picture Projection
- 10.2.2. Anesthetic
- 10.2.3. Welding
- 10.2.4. Insulation
- 10.2.5. Lighting
- 10.2.6. Television Tubes
- 10.2.7. Advertising
- 10.2.8. Refrigerant
- 10.2.9. Working Fluid
- 10.2.10. Chemical Analysis
- 10.3. Market Analysis, Insights and Forecast - by End-user Industry
- 10.3.1. Oil and Gas
- 10.3.2. Mining
- 10.3.3. Healthcare
- 10.3.4. Aerospace
- 10.3.5. Construction
- 10.3.6. Energy and Power
- 10.1. Market Analysis, Insights and Forecast - by Type
- 11. Middle East Noble Gas Market Analysis, Insights and Forecast, 2020-2032
- 11.1. Market Analysis, Insights and Forecast - by Type
- 11.1.1. Helium
- 11.1.2. Krypton
- 11.1.3. Argon
- 11.1.4. Neon
- 11.1.5. Xenon
- 11.1.6. Radioactive Radon
- 11.2. Market Analysis, Insights and Forecast - by Application
- 11.2.1. Picture Projection
- 11.2.2. Anesthetic
- 11.2.3. Welding
- 11.2.4. Insulation
- 11.2.5. Lighting
- 11.2.6. Television Tubes
- 11.2.7. Advertising
- 11.2.8. Refrigerant
- 11.2.9. Working Fluid
- 11.2.10. Chemical Analysis
- 11.3. Market Analysis, Insights and Forecast - by End-user Industry
- 11.3.1. Oil and Gas
- 11.3.2. Mining
- 11.3.3. Healthcare
- 11.3.4. Aerospace
- 11.3.5. Construction
- 11.3.6. Energy and Power
- 11.1. Market Analysis, Insights and Forecast - by Type
- 12. Saudi Arabia Noble Gas Market Analysis, Insights and Forecast, 2020-2032
- 12.1. Market Analysis, Insights and Forecast - by Type
- 12.1.1. Helium
- 12.1.2. Krypton
- 12.1.3. Argon
- 12.1.4. Neon
- 12.1.5. Xenon
- 12.1.6. Radioactive Radon
- 12.2. Market Analysis, Insights and Forecast - by Application
- 12.2.1. Picture Projection
- 12.2.2. Anesthetic
- 12.2.3. Welding
- 12.2.4. Insulation
- 12.2.5. Lighting
- 12.2.6. Television Tubes
- 12.2.7. Advertising
- 12.2.8. Refrigerant
- 12.2.9. Working Fluid
- 12.2.10. Chemical Analysis
- 12.3. Market Analysis, Insights and Forecast - by End-user Industry
- 12.3.1. Oil and Gas
- 12.3.2. Mining
- 12.3.3. Healthcare
- 12.3.4. Aerospace
- 12.3.5. Construction
- 12.3.6. Energy and Power
- 12.1. Market Analysis, Insights and Forecast - by Type
- 13. Competitive Analysis
- 13.1. Company Profiles
- 13.1.1 Air Products and Chemicals Inc
- 13.1.1.1. Company Overview
- 13.1.1.2. Products
- 13.1.1.3. Company Financials
- 13.1.1.4. SWOT Analysis
- 13.1.2 Messer North America Inc
- 13.1.2.1. Company Overview
- 13.1.2.2. Products
- 13.1.2.3. Company Financials
- 13.1.2.4. SWOT Analysis
- 13.1.3 Gulf Cryo
- 13.1.3.1. Company Overview
- 13.1.3.2. Products
- 13.1.3.3. Company Financials
- 13.1.3.4. SWOT Analysis
- 13.1.4 Ras Gas Company Limited
- 13.1.4.1. Company Overview
- 13.1.4.2. Products
- 13.1.4.3. Company Financials
- 13.1.4.4. SWOT Analysis
- 13.1.5 Praxair Technology Inc
- 13.1.5.1. Company Overview
- 13.1.5.2. Products
- 13.1.5.3. Company Financials
- 13.1.5.4. SWOT Analysis
- 13.1.6 BASF SE
- 13.1.6.1. Company Overview
- 13.1.6.2. Products
- 13.1.6.3. Company Financials
- 13.1.6.4. SWOT Analysis
- 13.1.7 ITM Power
- 13.1.7.1. Company Overview
- 13.1.7.2. Products
- 13.1.7.3. Company Financials
- 13.1.7.4. SWOT Analysis
- 13.1.8 Linde plc
- 13.1.8.1. Company Overview
- 13.1.8.2. Products
- 13.1.8.3. Company Financials
- 13.1.8.4. SWOT Analysis
- 13.1.9 American Gas
- 13.1.9.1. Company Overview
- 13.1.9.2. Products
- 13.1.9.3. Company Financials
- 13.1.9.4. SWOT Analysis
- 13.1.10 TAIYO NIPPON SANSO CORPORATION*List Not Exhaustive
- 13.1.10.1. Company Overview
- 13.1.10.2. Products
- 13.1.10.3. Company Financials
- 13.1.10.4. SWOT Analysis
- 13.1.11 Royal Dutch Shell PLC
- 13.1.11.1. Company Overview
- 13.1.11.2. Products
- 13.1.11.3. Company Financials
- 13.1.11.4. SWOT Analysis
- 13.1.12 Buzwair Industrial Gases Factories
- 13.1.12.1. Company Overview
- 13.1.12.2. Products
- 13.1.12.3. Company Financials
- 13.1.12.4. SWOT Analysis
- 13.1.13 Air Liquide
- 13.1.13.1. Company Overview
- 13.1.13.2. Products
- 13.1.13.3. Company Financials
- 13.1.13.4. SWOT Analysis
- 13.1.14 Airgas Inc
- 13.1.14.1. Company Overview
- 13.1.14.2. Products
- 13.1.14.3. Company Financials
- 13.1.14.4. SWOT Analysis
- 13.1.1 Air Products and Chemicals Inc
- 13.2. Market Entropy
- 13.2.1 Company's Key Areas Served
- 13.2.2 Recent Developments
- 13.3. Company Market Share Analysis 2025
- 13.3.1 Top 5 Companies Market Share Analysis
- 13.3.2 Top 3 Companies Market Share Analysis
- 13.4. List of Potential Customers
- 14. Research Methodology
List of Figures
- Figure 1: Global Noble Gas Market Revenue Breakdown (Million, %) by Region 2025 & 2033
- Figure 2: Global Noble Gas Market Volume Breakdown (K Tons, %) by Region 2025 & 2033
- Figure 3: Asia Pacific Noble Gas Market Revenue (Million), by Type 2025 & 2033
- Figure 4: Asia Pacific Noble Gas Market Volume (K Tons), by Type 2025 & 2033
- Figure 5: Asia Pacific Noble Gas Market Revenue Share (%), by Type 2025 & 2033
- Figure 6: Asia Pacific Noble Gas Market Volume Share (%), by Type 2025 & 2033
- Figure 7: Asia Pacific Noble Gas Market Revenue (Million), by Application 2025 & 2033
- Figure 8: Asia Pacific Noble Gas Market Volume (K Tons), by Application 2025 & 2033
- Figure 9: Asia Pacific Noble Gas Market Revenue Share (%), by Application 2025 & 2033
- Figure 10: Asia Pacific Noble Gas Market Volume Share (%), by Application 2025 & 2033
- Figure 11: Asia Pacific Noble Gas Market Revenue (Million), by End-user Industry 2025 & 2033
- Figure 12: Asia Pacific Noble Gas Market Volume (K Tons), by End-user Industry 2025 & 2033
- Figure 13: Asia Pacific Noble Gas Market Revenue Share (%), by End-user Industry 2025 & 2033
- Figure 14: Asia Pacific Noble Gas Market Volume Share (%), by End-user Industry 2025 & 2033
- Figure 15: Asia Pacific Noble Gas Market Revenue (Million), by Country 2025 & 2033
- Figure 16: Asia Pacific Noble Gas Market Volume (K Tons), by Country 2025 & 2033
- Figure 17: Asia Pacific Noble Gas Market Revenue Share (%), by Country 2025 & 2033
- Figure 18: Asia Pacific Noble Gas Market Volume Share (%), by Country 2025 & 2033
- Figure 19: North America Noble Gas Market Revenue (Million), by Type 2025 & 2033
- Figure 20: North America Noble Gas Market Volume (K Tons), by Type 2025 & 2033
- Figure 21: North America Noble Gas Market Revenue Share (%), by Type 2025 & 2033
- Figure 22: North America Noble Gas Market Volume Share (%), by Type 2025 & 2033
- Figure 23: North America Noble Gas Market Revenue (Million), by Application 2025 & 2033
- Figure 24: North America Noble Gas Market Volume (K Tons), by Application 2025 & 2033
- Figure 25: North America Noble Gas Market Revenue Share (%), by Application 2025 & 2033
- Figure 26: North America Noble Gas Market Volume Share (%), by Application 2025 & 2033
- Figure 27: North America Noble Gas Market Revenue (Million), by End-user Industry 2025 & 2033
- Figure 28: North America Noble Gas Market Volume (K Tons), by End-user Industry 2025 & 2033
- Figure 29: North America Noble Gas Market Revenue Share (%), by End-user Industry 2025 & 2033
- Figure 30: North America Noble Gas Market Volume Share (%), by End-user Industry 2025 & 2033
- Figure 31: North America Noble Gas Market Revenue (Million), by Country 2025 & 2033
- Figure 32: North America Noble Gas Market Volume (K Tons), by Country 2025 & 2033
- Figure 33: North America Noble Gas Market Revenue Share (%), by Country 2025 & 2033
- Figure 34: North America Noble Gas Market Volume Share (%), by Country 2025 & 2033
- Figure 35: Europe Noble Gas Market Revenue (Million), by Type 2025 & 2033
- Figure 36: Europe Noble Gas Market Volume (K Tons), by Type 2025 & 2033
- Figure 37: Europe Noble Gas Market Revenue Share (%), by Type 2025 & 2033
- Figure 38: Europe Noble Gas Market Volume Share (%), by Type 2025 & 2033
- Figure 39: Europe Noble Gas Market Revenue (Million), by Application 2025 & 2033
- Figure 40: Europe Noble Gas Market Volume (K Tons), by Application 2025 & 2033
- Figure 41: Europe Noble Gas Market Revenue Share (%), by Application 2025 & 2033
- Figure 42: Europe Noble Gas Market Volume Share (%), by Application 2025 & 2033
- Figure 43: Europe Noble Gas Market Revenue (Million), by End-user Industry 2025 & 2033
- Figure 44: Europe Noble Gas Market Volume (K Tons), by End-user Industry 2025 & 2033
- Figure 45: Europe Noble Gas Market Revenue Share (%), by End-user Industry 2025 & 2033
- Figure 46: Europe Noble Gas Market Volume Share (%), by End-user Industry 2025 & 2033
- Figure 47: Europe Noble Gas Market Revenue (Million), by Country 2025 & 2033
- Figure 48: Europe Noble Gas Market Volume (K Tons), by Country 2025 & 2033
- Figure 49: Europe Noble Gas Market Revenue Share (%), by Country 2025 & 2033
- Figure 50: Europe Noble Gas Market Volume Share (%), by Country 2025 & 2033
- Figure 51: South America Noble Gas Market Revenue (Million), by Type 2025 & 2033
- Figure 52: South America Noble Gas Market Volume (K Tons), by Type 2025 & 2033
- Figure 53: South America Noble Gas Market Revenue Share (%), by Type 2025 & 2033
- Figure 54: South America Noble Gas Market Volume Share (%), by Type 2025 & 2033
- Figure 55: South America Noble Gas Market Revenue (Million), by Application 2025 & 2033
- Figure 56: South America Noble Gas Market Volume (K Tons), by Application 2025 & 2033
- Figure 57: South America Noble Gas Market Revenue Share (%), by Application 2025 & 2033
- Figure 58: South America Noble Gas Market Volume Share (%), by Application 2025 & 2033
- Figure 59: South America Noble Gas Market Revenue (Million), by End-user Industry 2025 & 2033
- Figure 60: South America Noble Gas Market Volume (K Tons), by End-user Industry 2025 & 2033
- Figure 61: South America Noble Gas Market Revenue Share (%), by End-user Industry 2025 & 2033
- Figure 62: South America Noble Gas Market Volume Share (%), by End-user Industry 2025 & 2033
- Figure 63: South America Noble Gas Market Revenue (Million), by Country 2025 & 2033
- Figure 64: South America Noble Gas Market Volume (K Tons), by Country 2025 & 2033
- Figure 65: South America Noble Gas Market Revenue Share (%), by Country 2025 & 2033
- Figure 66: South America Noble Gas Market Volume Share (%), by Country 2025 & 2033
- Figure 67: Middle East Noble Gas Market Revenue (Million), by Type 2025 & 2033
- Figure 68: Middle East Noble Gas Market Volume (K Tons), by Type 2025 & 2033
- Figure 69: Middle East Noble Gas Market Revenue Share (%), by Type 2025 & 2033
- Figure 70: Middle East Noble Gas Market Volume Share (%), by Type 2025 & 2033
- Figure 71: Middle East Noble Gas Market Revenue (Million), by Application 2025 & 2033
- Figure 72: Middle East Noble Gas Market Volume (K Tons), by Application 2025 & 2033
- Figure 73: Middle East Noble Gas Market Revenue Share (%), by Application 2025 & 2033
- Figure 74: Middle East Noble Gas Market Volume Share (%), by Application 2025 & 2033
- Figure 75: Middle East Noble Gas Market Revenue (Million), by End-user Industry 2025 & 2033
- Figure 76: Middle East Noble Gas Market Volume (K Tons), by End-user Industry 2025 & 2033
- Figure 77: Middle East Noble Gas Market Revenue Share (%), by End-user Industry 2025 & 2033
- Figure 78: Middle East Noble Gas Market Volume Share (%), by End-user Industry 2025 & 2033
- Figure 79: Middle East Noble Gas Market Revenue (Million), by Country 2025 & 2033
- Figure 80: Middle East Noble Gas Market Volume (K Tons), by Country 2025 & 2033
- Figure 81: Middle East Noble Gas Market Revenue Share (%), by Country 2025 & 2033
- Figure 82: Middle East Noble Gas Market Volume Share (%), by Country 2025 & 2033
- Figure 83: Saudi Arabia Noble Gas Market Revenue (Million), by Type 2025 & 2033
- Figure 84: Saudi Arabia Noble Gas Market Volume (K Tons), by Type 2025 & 2033
- Figure 85: Saudi Arabia Noble Gas Market Revenue Share (%), by Type 2025 & 2033
- Figure 86: Saudi Arabia Noble Gas Market Volume Share (%), by Type 2025 & 2033
- Figure 87: Saudi Arabia Noble Gas Market Revenue (Million), by Application 2025 & 2033
- Figure 88: Saudi Arabia Noble Gas Market Volume (K Tons), by Application 2025 & 2033
- Figure 89: Saudi Arabia Noble Gas Market Revenue Share (%), by Application 2025 & 2033
- Figure 90: Saudi Arabia Noble Gas Market Volume Share (%), by Application 2025 & 2033
- Figure 91: Saudi Arabia Noble Gas Market Revenue (Million), by End-user Industry 2025 & 2033
- Figure 92: Saudi Arabia Noble Gas Market Volume (K Tons), by End-user Industry 2025 & 2033
- Figure 93: Saudi Arabia Noble Gas Market Revenue Share (%), by End-user Industry 2025 & 2033
- Figure 94: Saudi Arabia Noble Gas Market Volume Share (%), by End-user Industry 2025 & 2033
- Figure 95: Saudi Arabia Noble Gas Market Revenue (Million), by Country 2025 & 2033
- Figure 96: Saudi Arabia Noble Gas Market Volume (K Tons), by Country 2025 & 2033
- Figure 97: Saudi Arabia Noble Gas Market Revenue Share (%), by Country 2025 & 2033
- Figure 98: Saudi Arabia Noble Gas Market Volume Share (%), by Country 2025 & 2033
List of Tables
- Table 1: Global Noble Gas Market Revenue Million Forecast, by Type 2020 & 2033
- Table 2: Global Noble Gas Market Volume K Tons Forecast, by Type 2020 & 2033
- Table 3: Global Noble Gas Market Revenue Million Forecast, by Application 2020 & 2033
- Table 4: Global Noble Gas Market Volume K Tons Forecast, by Application 2020 & 2033
- Table 5: Global Noble Gas Market Revenue Million Forecast, by End-user Industry 2020 & 2033
- Table 6: Global Noble Gas Market Volume K Tons Forecast, by End-user Industry 2020 & 2033
- Table 7: Global Noble Gas Market Revenue Million Forecast, by Region 2020 & 2033
- Table 8: Global Noble Gas Market Volume K Tons Forecast, by Region 2020 & 2033
- Table 9: Global Noble Gas Market Revenue Million Forecast, by Type 2020 & 2033
- Table 10: Global Noble Gas Market Volume K Tons Forecast, by Type 2020 & 2033
- Table 11: Global Noble Gas Market Revenue Million Forecast, by Application 2020 & 2033
- Table 12: Global Noble Gas Market Volume K Tons Forecast, by Application 2020 & 2033
- Table 13: Global Noble Gas Market Revenue Million Forecast, by End-user Industry 2020 & 2033
- Table 14: Global Noble Gas Market Volume K Tons Forecast, by End-user Industry 2020 & 2033
- Table 15: Global Noble Gas Market Revenue Million Forecast, by Country 2020 & 2033
- Table 16: Global Noble Gas Market Volume K Tons Forecast, by Country 2020 & 2033
- Table 17: China Noble Gas Market Revenue (Million) Forecast, by Application 2020 & 2033
- Table 18: China Noble Gas Market Volume (K Tons) Forecast, by Application 2020 & 2033
- Table 19: India Noble Gas Market Revenue (Million) Forecast, by Application 2020 & 2033
- Table 20: India Noble Gas Market Volume (K Tons) Forecast, by Application 2020 & 2033
- Table 21: Japan Noble Gas Market Revenue (Million) Forecast, by Application 2020 & 2033
- Table 22: Japan Noble Gas Market Volume (K Tons) Forecast, by Application 2020 & 2033
- Table 23: South Korea Noble Gas Market Revenue (Million) Forecast, by Application 2020 & 2033
- Table 24: South Korea Noble Gas Market Volume (K Tons) Forecast, by Application 2020 & 2033
- Table 25: Rest of Asia Pacific Noble Gas Market Revenue (Million) Forecast, by Application 2020 & 2033
- Table 26: Rest of Asia Pacific Noble Gas Market Volume (K Tons) Forecast, by Application 2020 & 2033
- Table 27: Global Noble Gas Market Revenue Million Forecast, by Type 2020 & 2033
- Table 28: Global Noble Gas Market Volume K Tons Forecast, by Type 2020 & 2033
- Table 29: Global Noble Gas Market Revenue Million Forecast, by Application 2020 & 2033
- Table 30: Global Noble Gas Market Volume K Tons Forecast, by Application 2020 & 2033
- Table 31: Global Noble Gas Market Revenue Million Forecast, by End-user Industry 2020 & 2033
- Table 32: Global Noble Gas Market Volume K Tons Forecast, by End-user Industry 2020 & 2033
- Table 33: Global Noble Gas Market Revenue Million Forecast, by Country 2020 & 2033
- Table 34: Global Noble Gas Market Volume K Tons Forecast, by Country 2020 & 2033
- Table 35: United States Noble Gas Market Revenue (Million) Forecast, by Application 2020 & 2033
- Table 36: United States Noble Gas Market Volume (K Tons) Forecast, by Application 2020 & 2033
- Table 37: Canada Noble Gas Market Revenue (Million) Forecast, by Application 2020 & 2033
- Table 38: Canada Noble Gas Market Volume (K Tons) Forecast, by Application 2020 & 2033
- Table 39: Mexico Noble Gas Market Revenue (Million) Forecast, by Application 2020 & 2033
- Table 40: Mexico Noble Gas Market Volume (K Tons) Forecast, by Application 2020 & 2033
- Table 41: Global Noble Gas Market Revenue Million Forecast, by Type 2020 & 2033
- Table 42: Global Noble Gas Market Volume K Tons Forecast, by Type 2020 & 2033
- Table 43: Global Noble Gas Market Revenue Million Forecast, by Application 2020 & 2033
- Table 44: Global Noble Gas Market Volume K Tons Forecast, by Application 2020 & 2033
- Table 45: Global Noble Gas Market Revenue Million Forecast, by End-user Industry 2020 & 2033
- Table 46: Global Noble Gas Market Volume K Tons Forecast, by End-user Industry 2020 & 2033
- Table 47: Global Noble Gas Market Revenue Million Forecast, by Country 2020 & 2033
- Table 48: Global Noble Gas Market Volume K Tons Forecast, by Country 2020 & 2033
- Table 49: Germany Noble Gas Market Revenue (Million) Forecast, by Application 2020 & 2033
- Table 50: Germany Noble Gas Market Volume (K Tons) Forecast, by Application 2020 & 2033
- Table 51: United Kingdom Noble Gas Market Revenue (Million) Forecast, by Application 2020 & 2033
- Table 52: United Kingdom Noble Gas Market Volume (K Tons) Forecast, by Application 2020 & 2033
- Table 53: Italy Noble Gas Market Revenue (Million) Forecast, by Application 2020 & 2033
- Table 54: Italy Noble Gas Market Volume (K Tons) Forecast, by Application 2020 & 2033
- Table 55: France Noble Gas Market Revenue (Million) Forecast, by Application 2020 & 2033
- Table 56: France Noble Gas Market Volume (K Tons) Forecast, by Application 2020 & 2033
- Table 57: Rest of Europe Noble Gas Market Revenue (Million) Forecast, by Application 2020 & 2033
- Table 58: Rest of Europe Noble Gas Market Volume (K Tons) Forecast, by Application 2020 & 2033
- Table 59: Global Noble Gas Market Revenue Million Forecast, by Type 2020 & 2033
- Table 60: Global Noble Gas Market Volume K Tons Forecast, by Type 2020 & 2033
- Table 61: Global Noble Gas Market Revenue Million Forecast, by Application 2020 & 2033
- Table 62: Global Noble Gas Market Volume K Tons Forecast, by Application 2020 & 2033
- Table 63: Global Noble Gas Market Revenue Million Forecast, by End-user Industry 2020 & 2033
- Table 64: Global Noble Gas Market Volume K Tons Forecast, by End-user Industry 2020 & 2033
- Table 65: Global Noble Gas Market Revenue Million Forecast, by Country 2020 & 2033
- Table 66: Global Noble Gas Market Volume K Tons Forecast, by Country 2020 & 2033
- Table 67: Brazil Noble Gas Market Revenue (Million) Forecast, by Application 2020 & 2033
- Table 68: Brazil Noble Gas Market Volume (K Tons) Forecast, by Application 2020 & 2033
- Table 69: Argentina Noble Gas Market Revenue (Million) Forecast, by Application 2020 & 2033
- Table 70: Argentina Noble Gas Market Volume (K Tons) Forecast, by Application 2020 & 2033
- Table 71: Rest of South America Noble Gas Market Revenue (Million) Forecast, by Application 2020 & 2033
- Table 72: Rest of South America Noble Gas Market Volume (K Tons) Forecast, by Application 2020 & 2033
- Table 73: Global Noble Gas Market Revenue Million Forecast, by Type 2020 & 2033
- Table 74: Global Noble Gas Market Volume K Tons Forecast, by Type 2020 & 2033
- Table 75: Global Noble Gas Market Revenue Million Forecast, by Application 2020 & 2033
- Table 76: Global Noble Gas Market Volume K Tons Forecast, by Application 2020 & 2033
- Table 77: Global Noble Gas Market Revenue Million Forecast, by End-user Industry 2020 & 2033
- Table 78: Global Noble Gas Market Volume K Tons Forecast, by End-user Industry 2020 & 2033
- Table 79: Global Noble Gas Market Revenue Million Forecast, by Country 2020 & 2033
- Table 80: Global Noble Gas Market Volume K Tons Forecast, by Country 2020 & 2033
- Table 81: Global Noble Gas Market Revenue Million Forecast, by Type 2020 & 2033
- Table 82: Global Noble Gas Market Volume K Tons Forecast, by Type 2020 & 2033
- Table 83: Global Noble Gas Market Revenue Million Forecast, by Application 2020 & 2033
- Table 84: Global Noble Gas Market Volume K Tons Forecast, by Application 2020 & 2033
- Table 85: Global Noble Gas Market Revenue Million Forecast, by End-user Industry 2020 & 2033
- Table 86: Global Noble Gas Market Volume K Tons Forecast, by End-user Industry 2020 & 2033
- Table 87: Global Noble Gas Market Revenue Million Forecast, by Country 2020 & 2033
- Table 88: Global Noble Gas Market Volume K Tons Forecast, by Country 2020 & 2033
- Table 89: South Africa Noble Gas Market Revenue (Million) Forecast, by Application 2020 & 2033
- Table 90: South Africa Noble Gas Market Volume (K Tons) Forecast, by Application 2020 & 2033
- Table 91: Rest of Middle East Noble Gas Market Revenue (Million) Forecast, by Application 2020 & 2033
- Table 92: Rest of Middle East Noble Gas Market Volume (K Tons) Forecast, by Application 2020 & 2033
Frequently Asked Questions
1. What is the projected Compound Annual Growth Rate (CAGR) of the Noble Gas Market?
The projected CAGR is approximately > 5.00%.
2. Which companies are prominent players in the Noble Gas Market?
Key companies in the market include Air Products and Chemicals Inc, Messer North America Inc, Gulf Cryo, Ras Gas Company Limited, Praxair Technology Inc, BASF SE, ITM Power, Linde plc, American Gas, TAIYO NIPPON SANSO CORPORATION*List Not Exhaustive, Royal Dutch Shell PLC, Buzwair Industrial Gases Factories, Air Liquide, Airgas Inc.
3. What are the main segments of the Noble Gas Market?
The market segments include Type, Application, End-user Industry.
4. Can you provide details about the market size?
The market size is estimated to be USD 43600 Million as of 2022.
5. What are some drivers contributing to market growth?
Growing Demand in the Healthcare Industry; Expansion of Steel and Automotive industry.
6. What are the notable trends driving market growth?
Increasing Demand from the Healthcare Industry.
7. Are there any restraints impacting market growth?
Fluctuating Prices of Noble gases; Need of high-efficient gas extracting method.
8. Can you provide examples of recent developments in the market?
April 2022: Linde signed an off-take agreement to recover the helium contained in Freeport LNG's production site in Texas (United States). Linde will also construct a helium processing plant for liquid helium in the United States.
9. What pricing options are available for accessing the report?
Pricing options include single-user, multi-user, and enterprise licenses priced at USD 4750, USD 5250, and USD 8750 respectively.
10. Is the market size provided in terms of value or volume?
The market size is provided in terms of value, measured in Million and volume, measured in K Tons.
11. Are there any specific market keywords associated with the report?
Yes, the market keyword associated with the report is "Noble Gas Market," which aids in identifying and referencing the specific market segment covered.
12. How do I determine which pricing option suits my needs best?
The pricing options vary based on user requirements and access needs. Individual users may opt for single-user licenses, while businesses requiring broader access may choose multi-user or enterprise licenses for cost-effective access to the report.
13. Are there any additional resources or data provided in the Noble Gas Market report?
While the report offers comprehensive insights, it's advisable to review the specific contents or supplementary materials provided to ascertain if additional resources or data are available.
14. How can I stay updated on further developments or reports in the Noble Gas Market?
To stay informed about further developments, trends, and reports in the Noble Gas Market, consider subscribing to industry newsletters, following relevant companies and organizations, or regularly checking reputable industry news sources and publications.
Methodology
Step 1 - Identification of Relevant Samples Size from Population Database


Step 2 - Approaches for Defining Global Market Size (Value, Volume* & Price*)

Note*: In applicable scenarios
Step 3 - Data Sources
Primary Research
- Web Analytics
- Survey Reports
- Research Institute
- Latest Research Reports
- Opinion Leaders
Secondary Research
- Annual Reports
- White Paper
- Latest Press Release
- Industry Association
- Paid Database
- Investor Presentations

Step 4 - Data Triangulation
Involves using different sources of information in order to increase the validity of a study
These sources are likely to be stakeholders in a program - participants, other researchers, program staff, other community members, and so on.
Then we put all data in single framework & apply various statistical tools to find out the dynamic on the market.
During the analysis stage, feedback from the stakeholder groups would be compared to determine areas of agreement as well as areas of divergence