
Key Insights
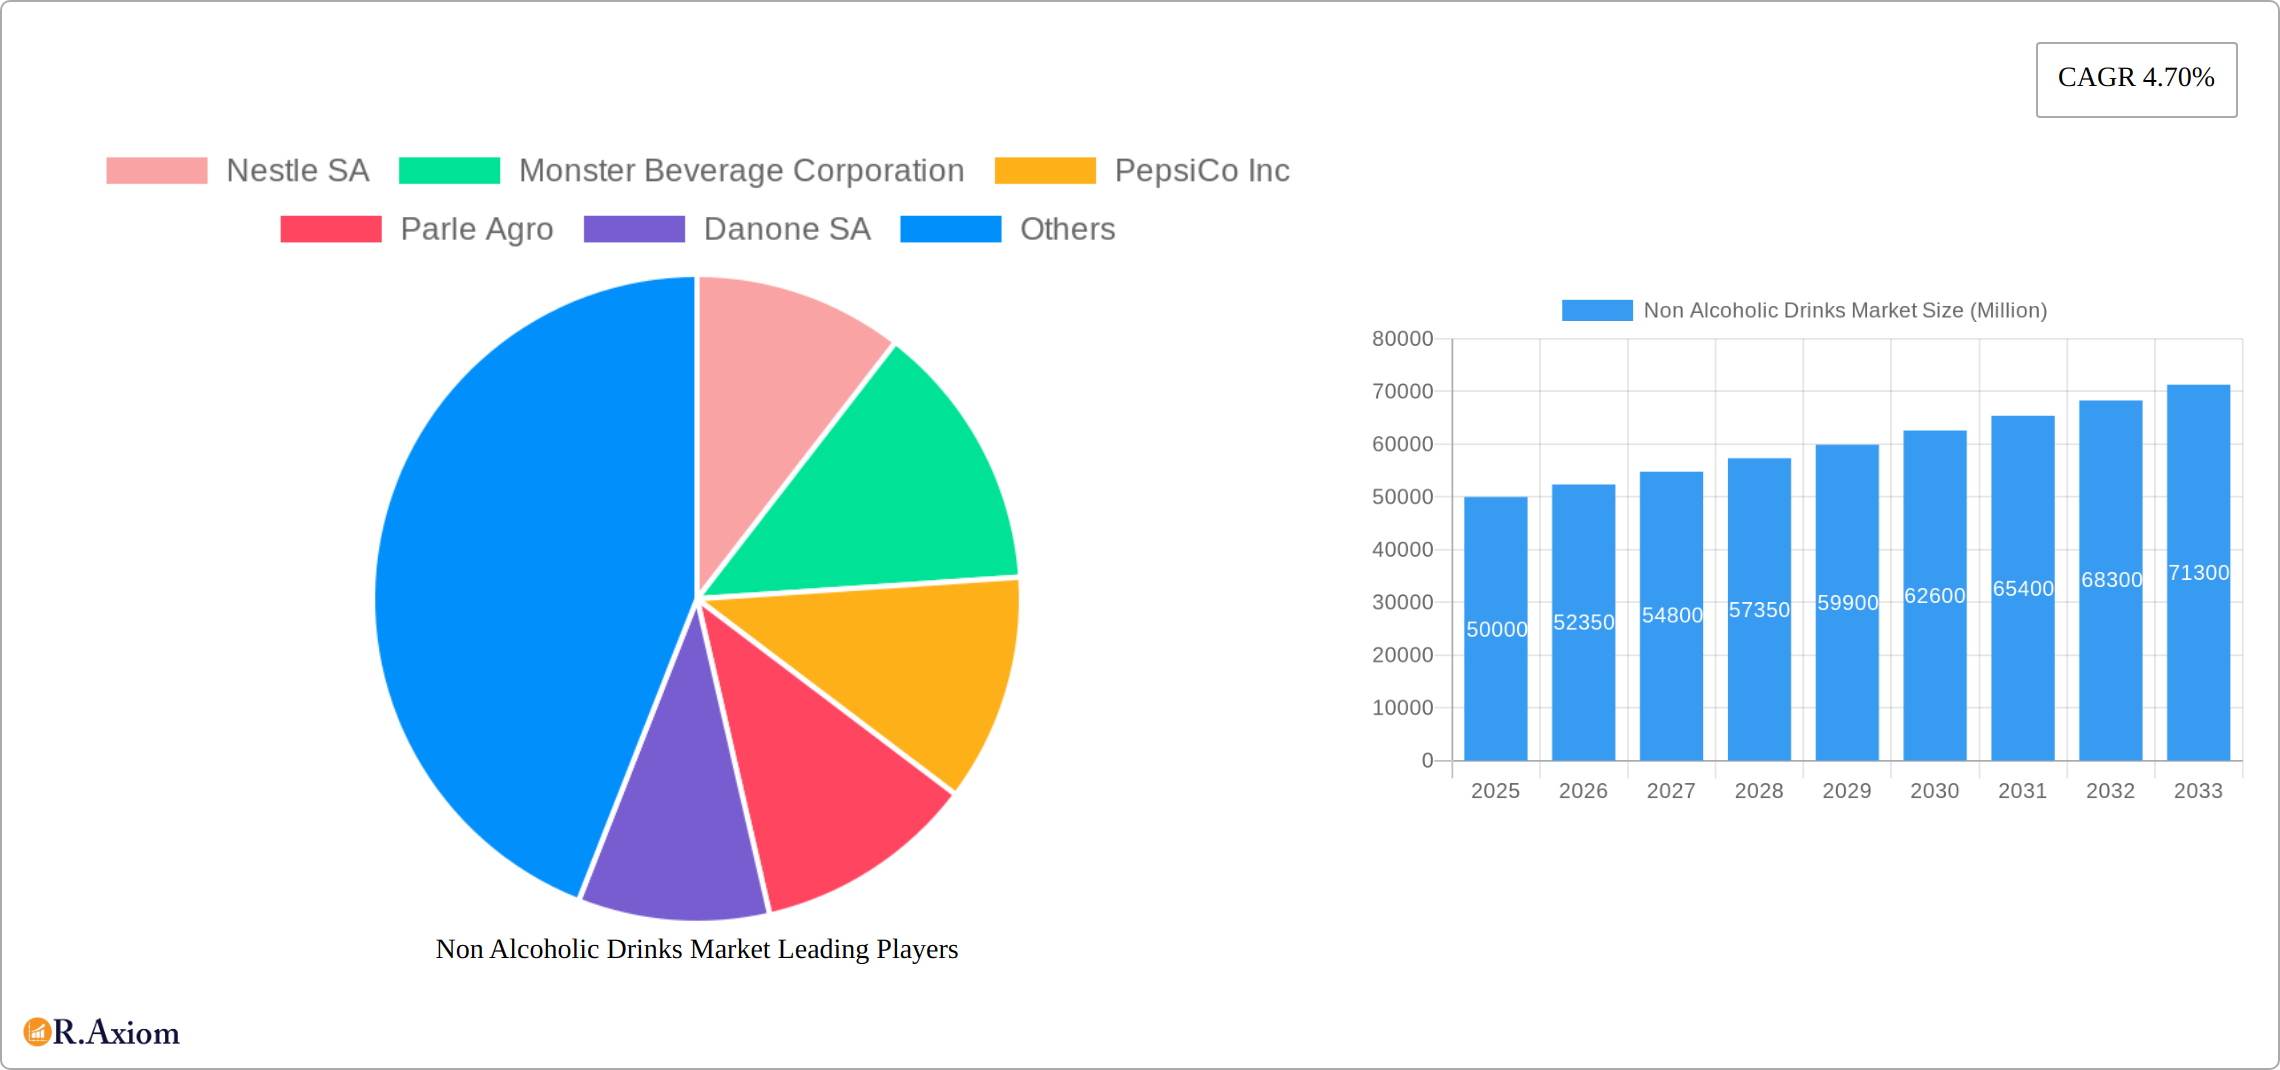
The global non-alcoholic beverage market, valued at approximately $XX million in 2025, is projected to experience robust growth, driven by several key factors. Health-conscious consumers are increasingly opting for healthier alternatives, fueling demand for functional beverages enriched with vitamins, minerals, and antioxidants. The rising popularity of natural and organic drinks, coupled with a growing preference for low-sugar and no-sugar options, further contributes to market expansion. Convenience also plays a significant role, with ready-to-drink (RTD) beverages gaining traction due to their ease of consumption and portability. The market is segmented by type (carbonated and non-carbonated) and distribution channels (supermarkets/hypermarkets, convenience stores, specialty stores, and online channels). Supermarkets and hypermarkets currently dominate distribution, but online channels are experiencing rapid growth, driven by e-commerce expansion and changing consumer behavior. Regional variations exist, with North America and Europe maintaining significant market shares due to high per capita consumption, while Asia-Pacific is expected to witness substantial growth fueled by increasing disposable incomes and changing lifestyle preferences. Competition is intense, with established players like Coca-Cola, PepsiCo, and Nestle vying for market share alongside emerging brands offering innovative products and targeting niche segments. However, factors like fluctuating raw material prices and increasing health concerns regarding artificial sweeteners pose challenges to the market's continued growth.
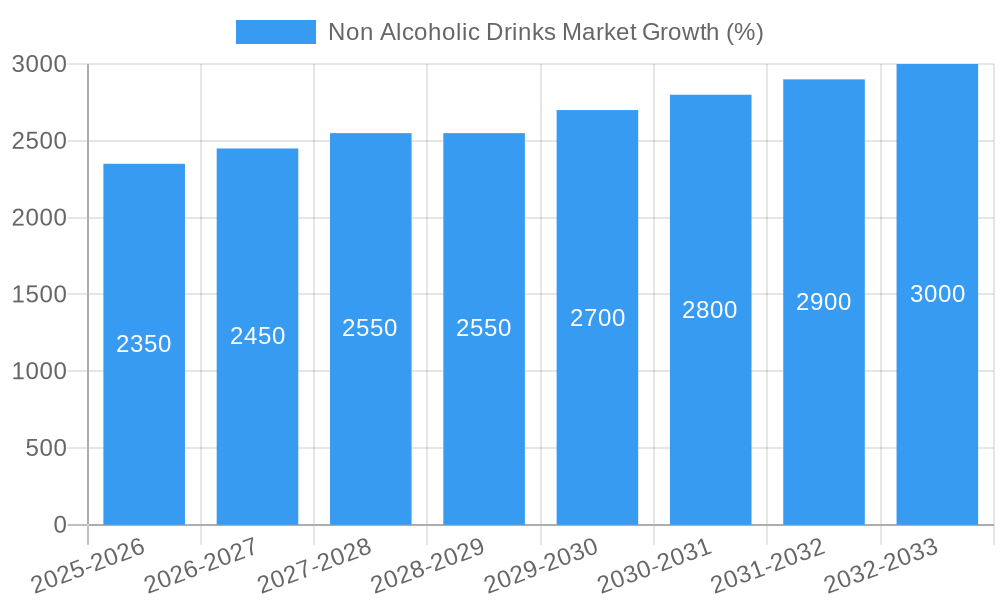
The projected 4.70% CAGR from 2025 to 2033 indicates a consistently expanding market. This growth is expected to be influenced by product innovation, including the introduction of new flavors, functional benefits, and sustainable packaging. Furthermore, strategic collaborations between beverage manufacturers and health and wellness companies are likely to further drive expansion. Aggressive marketing and branding strategies targeting specific consumer demographics will also play a significant role in market penetration. While challenges such as regulatory changes and potential economic downturns exist, the overall outlook for the non-alcoholic beverage market remains positive, with significant opportunities for both established and emerging players.
This detailed report provides a comprehensive analysis of the Non Alcoholic Drinks Market, covering market size, growth drivers, key players, and future trends. With a study period spanning from 2019 to 2033, including a base year of 2025 and a forecast period from 2025 to 2033, this report offers valuable insights for industry stakeholders, investors, and market researchers. The report utilizes data from the historical period (2019-2024) to project future market dynamics.
Non Alcoholic Drinks Market Concentration & Innovation
This section analyzes the competitive landscape of the Non Alcoholic Drinks Market, exploring market concentration, innovation drivers, regulatory influences, and market dynamics. The report assesses the market share of leading players like Nestle SA, Monster Beverage Corporation, PepsiCo Inc, Parle Agro, Danone SA, Keurig Dr Pepper Inc, Red Bull GmbH, The Coca-Cola Company, AriZona Beverages USA, and IBS Partners Lt, providing insights into their strategic maneuvers. We examine the impact of mergers and acquisitions (M&A) activities, analyzing deal values and their effects on market consolidation. Further, the analysis delves into the role of innovation, including new product launches, technological advancements, and regulatory changes, impacting the market's trajectory. The report also explores substitute products and evolving end-user trends, providing a holistic view of the market's competitive dynamics. For instance, the growing popularity of health-conscious beverages and the rise of plant-based drinks are considered, alongside the impact of evolving consumer preferences. The estimated M&A deal value for the period 2022-2024 is estimated at XX Million. Market share data for key players will be presented within the full report.
Non Alcoholic Drinks Market Industry Trends & Insights
This section presents an in-depth analysis of the Non Alcoholic Drinks Market trends and growth drivers. The report examines market growth rates (CAGR) for the historical and forecast periods, highlighting key factors that have shaped the market's evolution. We analyze technological advancements and their impact on production processes, product innovation, and consumer experience. The report will further investigate the evolving consumer preferences, encompassing factors such as health consciousness, sustainability concerns, and changing tastes. A detailed examination of the competitive dynamics will include an assessment of strategic alliances, competitive pricing strategies, and marketing campaigns that have shaped market share. This section provides a comprehensive overview of the market dynamics with a special emphasis on the shifting consumer preferences impacting the demand for different segments, including carbonated and non-carbonated drinks. The estimated CAGR for the forecast period (2025-2033) is projected to be xx%. The market penetration of different segments is also detailed.
Dominant Markets & Segments in Non Alcoholic Drinks Market
This section identifies the leading regions, countries, and market segments within the Non Alcoholic Drinks Market, based on both type (carbonated and non-carbonated beverages) and distribution channel (supermarkets/hypermarkets, convenience stores, specialty stores, online stores, and other channels).
By Type:
- Carbonated Beverages: Dominance analysis will detail the factors driving the carbonated beverage segment, including pricing strategies, marketing efforts, and consumer preference trends. The key drivers for this segment include established brand loyalty, widespread availability, and continued innovation within flavor profiles.
- Non-Carbonated Beverages: This segment's growth is fueled by health and wellness trends, with increasing demand for healthier alternatives like fruit juices, herbal teas, and functional beverages. Key factors driving the non-carbonated beverage segment include health consciousness and the increasing popularity of functional beverages.
By Distribution Channel:
- Supermarkets/Hypermarkets: This channel remains dominant due to its wide reach and established distribution networks.
- Convenience Stores: The convenience factor drives growth in this segment, particularly for impulse purchases.
- Specialty Stores: This segment's growth is fueled by a focus on niche products and higher-quality, premium options.
- Online Stores: E-commerce presents a growing opportunity, with increased convenience and access to diverse product offerings.
- Other Distribution Channels: This includes foodservice, vending machines, and direct-to-consumer channels, each with its unique characteristics and growth potential.
Specific regional and country dominance analyses will follow, focusing on key drivers such as economic policies and infrastructure. For example, regions with strong economies and well-developed retail infrastructure will typically show higher market penetration. The detailed analysis of each segment will incorporate factors such as consumer purchasing power, retail landscape, and distribution network effectiveness.
Non Alcoholic Drinks Market Product Developments
Recent product innovations reflect a focus on health, convenience, and unique flavor profiles. Technological advancements in packaging, such as sustainable materials and improved preservation techniques, are also shaping the market. Many brands are focusing on functional beverages with added vitamins, antioxidants, or other health benefits. This reflects a direct response to growing consumer demand for healthier options. The use of natural ingredients and reduced sugar content is a key trend. The market also showcases an increasing emphasis on customized beverages to cater to specific dietary needs and preferences.
Report Scope & Segmentation Analysis
This report provides a detailed segmentation of the Non Alcoholic Drinks Market based on type (carbonated and non-carbonated beverages) and distribution channel (supermarkets/hypermarkets, convenience stores, specialty stores, online stores, and other channels). Each segment is analyzed with growth projections, market sizes, and competitive dynamics outlined. For example, the carbonated beverage segment is further categorized by type of carbonation, sweetener used, and flavor profiles. Similarly, the distribution channel segment is broken down based on retail formats and online sales platforms. Growth projections for each segment will be provided, taking into consideration various factors, including consumer preferences, technological innovations, and economic trends.
Key Drivers of Non Alcoholic Drinks Market Growth
The Non Alcoholic Drinks Market is experiencing growth due to several key drivers. Rising health consciousness is driving demand for healthier alternatives, such as low-sugar or sugar-free options and functional beverages with added health benefits. Increased disposable incomes, particularly in emerging economies, contribute to higher spending on beverages. Technological advancements are enhancing the production efficiency, quality control, and sustainability of beverage manufacturing. Lastly, favorable regulatory frameworks supporting the industry's growth further contribute to the market expansion.
Challenges in the Non Alcoholic Drinks Market Sector
The Non Alcoholic Drinks Market faces several challenges. Fluctuating raw material prices impact production costs, affecting profitability. Intense competition among established and emerging players puts pressure on pricing strategies and margins. Stringent regulatory requirements regarding labeling, ingredients, and health claims add complexity and cost to operations. Supply chain disruptions due to geopolitical events or other unforeseen circumstances can impact the availability of raw materials and finished products, resulting in potential revenue losses.
Emerging Opportunities in Non Alcoholic Drinks Market
Emerging opportunities exist in the Non Alcoholic Drinks Market. The growing demand for functional beverages with specific health benefits offers significant potential for innovation. The rising popularity of premium and specialized beverages opens avenues for higher-margin products. Expansion into new markets, particularly in developing economies with rising disposable incomes, offers significant growth prospects. Technological advancements in personalization and customization open doors for tailored beverage experiences, catering to diverse consumer preferences.
Leading Players in the Non Alcoholic Drinks Market Market
- Nestle SA (https://www.nestle.com/)
- Monster Beverage Corporation (https://www.monsterenergy.com/)
- PepsiCo Inc (https://www.pepsico.com/)
- Parle Agro
- Danone SA (https://www.danone.com/)
- Keurig Dr Pepper Inc (https://www.keurigdrpepper.com/)
- Red Bull GmbH (https://www.redbull.com/)
- The Coca-Cola Company (https://www.coca-colacompany.com/)
- AriZona Beverages USA
- IBS Partners Lt
Key Developments in Non Alcoholic Drinks Market Industry
- July 2022: PepsiCo opened its largest US bottling plant in Colorado, focusing on renewable energy, water efficiency, and reduced plastic use. This demonstrates a commitment to sustainability, which is increasingly important to consumers.
- March 2022: Red Bull launched a limited-edition strawberry and apricot-flavored extension, showcasing product innovation to attract consumers.
- March 2022: PerfectTed, a UK-based start-up, launched a range of matcha green tea-powered energy drinks, highlighting the growing trend of natural and functional beverages.
Strategic Outlook for Non Alcoholic Drinks Market Market
The Non Alcoholic Drinks Market is poised for continued growth driven by health and wellness trends, increasing disposable incomes, and ongoing product innovation. Opportunities exist in developing healthier, more sustainable, and personalized beverage options. Expanding into new markets and leveraging technological advancements will be crucial for success. Companies focusing on sustainability initiatives and catering to evolving consumer preferences are best positioned for capturing market share in the years to come.
Non Alcoholic Drinks Market Segmentation
-
1. Type
- 1.1. Carbonated Beverage
-
1.2. Non-carbonated Beverage
- 1.2.1. Fruit and Vegetable Juice
- 1.2.2. Functional Drinks
- 1.2.3. RTD Tea and Coffee
- 1.2.4. Bottled Water
- 1.2.5. Other Types
-
2. Distribution Channel
- 2.1. Supermarkets/Hypermarkets
- 2.2. Convenience Stores
- 2.3. Speciality Stores
- 2.4. Online Stores
- 2.5. Other Distribution Channels
Non Alcoholic Drinks Market Segmentation By Geography
-
1. North America
- 1.1. United States
- 1.2. Canada
- 1.3. Mexico
- 1.4. Rest of North America
-
2. Europe
- 2.1. Germany
- 2.2. United Kingdom
- 2.3. France
- 2.4. Spain
- 2.5. Russia
- 2.6. Italy
- 2.7. Rest of Europe
-
3. Asia Pacific
- 3.1. China
- 3.2. India
- 3.3. Japan
- 3.4. Australia
- 3.5. Rest of Asia Pacific
-
4. South America
- 4.1. Brazil
- 4.2. Argentina
- 4.3. Rest of South America
- 5. Middle East
-
6. Saudi Arabia
- 6.1. South Africa
- 6.2. Rest of Middle East

Non Alcoholic Drinks Market REPORT HIGHLIGHTS
| Aspects | Details |
|---|---|
| Study Period | 2019-2033 |
| Base Year | 2024 |
| Estimated Year | 2025 |
| Forecast Period | 2025-2033 |
| Historical Period | 2019-2024 |
| Growth Rate | CAGR of 4.70% from 2019-2033 |
| Segmentation |
|
Table of Contents
- 1. Introduction
- 1.1. Research Scope
- 1.2. Market Segmentation
- 1.3. Research Methodology
- 1.4. Definitions and Assumptions
- 2. Executive Summary
- 2.1. Introduction
- 3. Market Dynamics
- 3.1. Introduction
- 3.2. Market Drivers
- 3.2.1. Increasing Health Consciousness Among Consumers; Increasing Demand for Vegan Food Products
- 3.3. Market Restrains
- 3.3.1. Poor Supply Chain
- 3.4. Market Trends
- 3.4.1. Strong Demand from Fitness Conscious Consumers
- 4. Market Factor Analysis
- 4.1. Porters Five Forces
- 4.2. Supply/Value Chain
- 4.3. PESTEL analysis
- 4.4. Market Entropy
- 4.5. Patent/Trademark Analysis
- 5. Global Non Alcoholic Drinks Market Analysis, Insights and Forecast, 2019-2031
- 5.1. Market Analysis, Insights and Forecast - by Type
- 5.1.1. Carbonated Beverage
- 5.1.2. Non-carbonated Beverage
- 5.1.2.1. Fruit and Vegetable Juice
- 5.1.2.2. Functional Drinks
- 5.1.2.3. RTD Tea and Coffee
- 5.1.2.4. Bottled Water
- 5.1.2.5. Other Types
- 5.2. Market Analysis, Insights and Forecast - by Distribution Channel
- 5.2.1. Supermarkets/Hypermarkets
- 5.2.2. Convenience Stores
- 5.2.3. Speciality Stores
- 5.2.4. Online Stores
- 5.2.5. Other Distribution Channels
- 5.3. Market Analysis, Insights and Forecast - by Region
- 5.3.1. North America
- 5.3.2. Europe
- 5.3.3. Asia Pacific
- 5.3.4. South America
- 5.3.5. Middle East
- 5.3.6. Saudi Arabia
- 5.1. Market Analysis, Insights and Forecast - by Type
- 6. North America Non Alcoholic Drinks Market Analysis, Insights and Forecast, 2019-2031
- 6.1. Market Analysis, Insights and Forecast - by Type
- 6.1.1. Carbonated Beverage
- 6.1.2. Non-carbonated Beverage
- 6.1.2.1. Fruit and Vegetable Juice
- 6.1.2.2. Functional Drinks
- 6.1.2.3. RTD Tea and Coffee
- 6.1.2.4. Bottled Water
- 6.1.2.5. Other Types
- 6.2. Market Analysis, Insights and Forecast - by Distribution Channel
- 6.2.1. Supermarkets/Hypermarkets
- 6.2.2. Convenience Stores
- 6.2.3. Speciality Stores
- 6.2.4. Online Stores
- 6.2.5. Other Distribution Channels
- 6.1. Market Analysis, Insights and Forecast - by Type
- 7. Europe Non Alcoholic Drinks Market Analysis, Insights and Forecast, 2019-2031
- 7.1. Market Analysis, Insights and Forecast - by Type
- 7.1.1. Carbonated Beverage
- 7.1.2. Non-carbonated Beverage
- 7.1.2.1. Fruit and Vegetable Juice
- 7.1.2.2. Functional Drinks
- 7.1.2.3. RTD Tea and Coffee
- 7.1.2.4. Bottled Water
- 7.1.2.5. Other Types
- 7.2. Market Analysis, Insights and Forecast - by Distribution Channel
- 7.2.1. Supermarkets/Hypermarkets
- 7.2.2. Convenience Stores
- 7.2.3. Speciality Stores
- 7.2.4. Online Stores
- 7.2.5. Other Distribution Channels
- 7.1. Market Analysis, Insights and Forecast - by Type
- 8. Asia Pacific Non Alcoholic Drinks Market Analysis, Insights and Forecast, 2019-2031
- 8.1. Market Analysis, Insights and Forecast - by Type
- 8.1.1. Carbonated Beverage
- 8.1.2. Non-carbonated Beverage
- 8.1.2.1. Fruit and Vegetable Juice
- 8.1.2.2. Functional Drinks
- 8.1.2.3. RTD Tea and Coffee
- 8.1.2.4. Bottled Water
- 8.1.2.5. Other Types
- 8.2. Market Analysis, Insights and Forecast - by Distribution Channel
- 8.2.1. Supermarkets/Hypermarkets
- 8.2.2. Convenience Stores
- 8.2.3. Speciality Stores
- 8.2.4. Online Stores
- 8.2.5. Other Distribution Channels
- 8.1. Market Analysis, Insights and Forecast - by Type
- 9. South America Non Alcoholic Drinks Market Analysis, Insights and Forecast, 2019-2031
- 9.1. Market Analysis, Insights and Forecast - by Type
- 9.1.1. Carbonated Beverage
- 9.1.2. Non-carbonated Beverage
- 9.1.2.1. Fruit and Vegetable Juice
- 9.1.2.2. Functional Drinks
- 9.1.2.3. RTD Tea and Coffee
- 9.1.2.4. Bottled Water
- 9.1.2.5. Other Types
- 9.2. Market Analysis, Insights and Forecast - by Distribution Channel
- 9.2.1. Supermarkets/Hypermarkets
- 9.2.2. Convenience Stores
- 9.2.3. Speciality Stores
- 9.2.4. Online Stores
- 9.2.5. Other Distribution Channels
- 9.1. Market Analysis, Insights and Forecast - by Type
- 10. Middle East Non Alcoholic Drinks Market Analysis, Insights and Forecast, 2019-2031
- 10.1. Market Analysis, Insights and Forecast - by Type
- 10.1.1. Carbonated Beverage
- 10.1.2. Non-carbonated Beverage
- 10.1.2.1. Fruit and Vegetable Juice
- 10.1.2.2. Functional Drinks
- 10.1.2.3. RTD Tea and Coffee
- 10.1.2.4. Bottled Water
- 10.1.2.5. Other Types
- 10.2. Market Analysis, Insights and Forecast - by Distribution Channel
- 10.2.1. Supermarkets/Hypermarkets
- 10.2.2. Convenience Stores
- 10.2.3. Speciality Stores
- 10.2.4. Online Stores
- 10.2.5. Other Distribution Channels
- 10.1. Market Analysis, Insights and Forecast - by Type
- 11. Saudi Arabia Non Alcoholic Drinks Market Analysis, Insights and Forecast, 2019-2031
- 11.1. Market Analysis, Insights and Forecast - by Type
- 11.1.1. Carbonated Beverage
- 11.1.2. Non-carbonated Beverage
- 11.1.2.1. Fruit and Vegetable Juice
- 11.1.2.2. Functional Drinks
- 11.1.2.3. RTD Tea and Coffee
- 11.1.2.4. Bottled Water
- 11.1.2.5. Other Types
- 11.2. Market Analysis, Insights and Forecast - by Distribution Channel
- 11.2.1. Supermarkets/Hypermarkets
- 11.2.2. Convenience Stores
- 11.2.3. Speciality Stores
- 11.2.4. Online Stores
- 11.2.5. Other Distribution Channels
- 11.1. Market Analysis, Insights and Forecast - by Type
- 12. North America Non Alcoholic Drinks Market Analysis, Insights and Forecast, 2019-2031
- 12.1. Market Analysis, Insights and Forecast - By Country/Sub-region
- 12.1.1 United States
- 12.1.2 Canada
- 12.1.3 Mexico
- 12.1.4 Rest of North America
- 13. Europe Non Alcoholic Drinks Market Analysis, Insights and Forecast, 2019-2031
- 13.1. Market Analysis, Insights and Forecast - By Country/Sub-region
- 13.1.1 Germany
- 13.1.2 United Kingdom
- 13.1.3 France
- 13.1.4 Spain
- 13.1.5 Russia
- 13.1.6 Italy
- 13.1.7 Rest of Europe
- 14. Asia Pacific Non Alcoholic Drinks Market Analysis, Insights and Forecast, 2019-2031
- 14.1. Market Analysis, Insights and Forecast - By Country/Sub-region
- 14.1.1 China
- 14.1.2 India
- 14.1.3 Japan
- 14.1.4 Australia
- 14.1.5 Rest of Asia Pacific
- 15. South America Non Alcoholic Drinks Market Analysis, Insights and Forecast, 2019-2031
- 15.1. Market Analysis, Insights and Forecast - By Country/Sub-region
- 15.1.1 Brazil
- 15.1.2 Argentina
- 15.1.3 Rest of South America
- 16. Middle East Non Alcoholic Drinks Market Analysis, Insights and Forecast, 2019-2031
- 16.1. Market Analysis, Insights and Forecast - By Country/Sub-region
- 16.1.1.
- 17. Saudi Arabia Non Alcoholic Drinks Market Analysis, Insights and Forecast, 2019-2031
- 17.1. Market Analysis, Insights and Forecast - By Country/Sub-region
- 17.1.1 South Africa
- 17.1.2 Rest of Middle East
- 18. Competitive Analysis
- 18.1. Global Market Share Analysis 2024
- 18.2. Company Profiles
- 18.2.1 Nestle SA
- 18.2.1.1. Overview
- 18.2.1.2. Products
- 18.2.1.3. SWOT Analysis
- 18.2.1.4. Recent Developments
- 18.2.1.5. Financials (Based on Availability)
- 18.2.2 Monster Beverage Corporation
- 18.2.2.1. Overview
- 18.2.2.2. Products
- 18.2.2.3. SWOT Analysis
- 18.2.2.4. Recent Developments
- 18.2.2.5. Financials (Based on Availability)
- 18.2.3 PepsiCo Inc
- 18.2.3.1. Overview
- 18.2.3.2. Products
- 18.2.3.3. SWOT Analysis
- 18.2.3.4. Recent Developments
- 18.2.3.5. Financials (Based on Availability)
- 18.2.4 Parle Agro
- 18.2.4.1. Overview
- 18.2.4.2. Products
- 18.2.4.3. SWOT Analysis
- 18.2.4.4. Recent Developments
- 18.2.4.5. Financials (Based on Availability)
- 18.2.5 Danone SA
- 18.2.5.1. Overview
- 18.2.5.2. Products
- 18.2.5.3. SWOT Analysis
- 18.2.5.4. Recent Developments
- 18.2.5.5. Financials (Based on Availability)
- 18.2.6 Keurig Dr Pepper Inc
- 18.2.6.1. Overview
- 18.2.6.2. Products
- 18.2.6.3. SWOT Analysis
- 18.2.6.4. Recent Developments
- 18.2.6.5. Financials (Based on Availability)
- 18.2.7 Red Bull GmbH
- 18.2.7.1. Overview
- 18.2.7.2. Products
- 18.2.7.3. SWOT Analysis
- 18.2.7.4. Recent Developments
- 18.2.7.5. Financials (Based on Availability)
- 18.2.8 The Coca-Cola Company
- 18.2.8.1. Overview
- 18.2.8.2. Products
- 18.2.8.3. SWOT Analysis
- 18.2.8.4. Recent Developments
- 18.2.8.5. Financials (Based on Availability)
- 18.2.9 AriZona Beverages USA
- 18.2.9.1. Overview
- 18.2.9.2. Products
- 18.2.9.3. SWOT Analysis
- 18.2.9.4. Recent Developments
- 18.2.9.5. Financials (Based on Availability)
- 18.2.10 IBS Partners Lt
- 18.2.10.1. Overview
- 18.2.10.2. Products
- 18.2.10.3. SWOT Analysis
- 18.2.10.4. Recent Developments
- 18.2.10.5. Financials (Based on Availability)
- 18.2.1 Nestle SA
List of Figures
- Figure 1: Global Non Alcoholic Drinks Market Revenue Breakdown (Million, %) by Region 2024 & 2032
- Figure 2: North America Non Alcoholic Drinks Market Revenue (Million), by Country 2024 & 2032
- Figure 3: North America Non Alcoholic Drinks Market Revenue Share (%), by Country 2024 & 2032
- Figure 4: Europe Non Alcoholic Drinks Market Revenue (Million), by Country 2024 & 2032
- Figure 5: Europe Non Alcoholic Drinks Market Revenue Share (%), by Country 2024 & 2032
- Figure 6: Asia Pacific Non Alcoholic Drinks Market Revenue (Million), by Country 2024 & 2032
- Figure 7: Asia Pacific Non Alcoholic Drinks Market Revenue Share (%), by Country 2024 & 2032
- Figure 8: South America Non Alcoholic Drinks Market Revenue (Million), by Country 2024 & 2032
- Figure 9: South America Non Alcoholic Drinks Market Revenue Share (%), by Country 2024 & 2032
- Figure 10: Middle East Non Alcoholic Drinks Market Revenue (Million), by Country 2024 & 2032
- Figure 11: Middle East Non Alcoholic Drinks Market Revenue Share (%), by Country 2024 & 2032
- Figure 12: Saudi Arabia Non Alcoholic Drinks Market Revenue (Million), by Country 2024 & 2032
- Figure 13: Saudi Arabia Non Alcoholic Drinks Market Revenue Share (%), by Country 2024 & 2032
- Figure 14: North America Non Alcoholic Drinks Market Revenue (Million), by Type 2024 & 2032
- Figure 15: North America Non Alcoholic Drinks Market Revenue Share (%), by Type 2024 & 2032
- Figure 16: North America Non Alcoholic Drinks Market Revenue (Million), by Distribution Channel 2024 & 2032
- Figure 17: North America Non Alcoholic Drinks Market Revenue Share (%), by Distribution Channel 2024 & 2032
- Figure 18: North America Non Alcoholic Drinks Market Revenue (Million), by Country 2024 & 2032
- Figure 19: North America Non Alcoholic Drinks Market Revenue Share (%), by Country 2024 & 2032
- Figure 20: Europe Non Alcoholic Drinks Market Revenue (Million), by Type 2024 & 2032
- Figure 21: Europe Non Alcoholic Drinks Market Revenue Share (%), by Type 2024 & 2032
- Figure 22: Europe Non Alcoholic Drinks Market Revenue (Million), by Distribution Channel 2024 & 2032
- Figure 23: Europe Non Alcoholic Drinks Market Revenue Share (%), by Distribution Channel 2024 & 2032
- Figure 24: Europe Non Alcoholic Drinks Market Revenue (Million), by Country 2024 & 2032
- Figure 25: Europe Non Alcoholic Drinks Market Revenue Share (%), by Country 2024 & 2032
- Figure 26: Asia Pacific Non Alcoholic Drinks Market Revenue (Million), by Type 2024 & 2032
- Figure 27: Asia Pacific Non Alcoholic Drinks Market Revenue Share (%), by Type 2024 & 2032
- Figure 28: Asia Pacific Non Alcoholic Drinks Market Revenue (Million), by Distribution Channel 2024 & 2032
- Figure 29: Asia Pacific Non Alcoholic Drinks Market Revenue Share (%), by Distribution Channel 2024 & 2032
- Figure 30: Asia Pacific Non Alcoholic Drinks Market Revenue (Million), by Country 2024 & 2032
- Figure 31: Asia Pacific Non Alcoholic Drinks Market Revenue Share (%), by Country 2024 & 2032
- Figure 32: South America Non Alcoholic Drinks Market Revenue (Million), by Type 2024 & 2032
- Figure 33: South America Non Alcoholic Drinks Market Revenue Share (%), by Type 2024 & 2032
- Figure 34: South America Non Alcoholic Drinks Market Revenue (Million), by Distribution Channel 2024 & 2032
- Figure 35: South America Non Alcoholic Drinks Market Revenue Share (%), by Distribution Channel 2024 & 2032
- Figure 36: South America Non Alcoholic Drinks Market Revenue (Million), by Country 2024 & 2032
- Figure 37: South America Non Alcoholic Drinks Market Revenue Share (%), by Country 2024 & 2032
- Figure 38: Middle East Non Alcoholic Drinks Market Revenue (Million), by Type 2024 & 2032
- Figure 39: Middle East Non Alcoholic Drinks Market Revenue Share (%), by Type 2024 & 2032
- Figure 40: Middle East Non Alcoholic Drinks Market Revenue (Million), by Distribution Channel 2024 & 2032
- Figure 41: Middle East Non Alcoholic Drinks Market Revenue Share (%), by Distribution Channel 2024 & 2032
- Figure 42: Middle East Non Alcoholic Drinks Market Revenue (Million), by Country 2024 & 2032
- Figure 43: Middle East Non Alcoholic Drinks Market Revenue Share (%), by Country 2024 & 2032
- Figure 44: Saudi Arabia Non Alcoholic Drinks Market Revenue (Million), by Type 2024 & 2032
- Figure 45: Saudi Arabia Non Alcoholic Drinks Market Revenue Share (%), by Type 2024 & 2032
- Figure 46: Saudi Arabia Non Alcoholic Drinks Market Revenue (Million), by Distribution Channel 2024 & 2032
- Figure 47: Saudi Arabia Non Alcoholic Drinks Market Revenue Share (%), by Distribution Channel 2024 & 2032
- Figure 48: Saudi Arabia Non Alcoholic Drinks Market Revenue (Million), by Country 2024 & 2032
- Figure 49: Saudi Arabia Non Alcoholic Drinks Market Revenue Share (%), by Country 2024 & 2032
List of Tables
- Table 1: Global Non Alcoholic Drinks Market Revenue Million Forecast, by Region 2019 & 2032
- Table 2: Global Non Alcoholic Drinks Market Revenue Million Forecast, by Type 2019 & 2032
- Table 3: Global Non Alcoholic Drinks Market Revenue Million Forecast, by Distribution Channel 2019 & 2032
- Table 4: Global Non Alcoholic Drinks Market Revenue Million Forecast, by Region 2019 & 2032
- Table 5: Global Non Alcoholic Drinks Market Revenue Million Forecast, by Country 2019 & 2032
- Table 6: United States Non Alcoholic Drinks Market Revenue (Million) Forecast, by Application 2019 & 2032
- Table 7: Canada Non Alcoholic Drinks Market Revenue (Million) Forecast, by Application 2019 & 2032
- Table 8: Mexico Non Alcoholic Drinks Market Revenue (Million) Forecast, by Application 2019 & 2032
- Table 9: Rest of North America Non Alcoholic Drinks Market Revenue (Million) Forecast, by Application 2019 & 2032
- Table 10: Global Non Alcoholic Drinks Market Revenue Million Forecast, by Country 2019 & 2032
- Table 11: Germany Non Alcoholic Drinks Market Revenue (Million) Forecast, by Application 2019 & 2032
- Table 12: United Kingdom Non Alcoholic Drinks Market Revenue (Million) Forecast, by Application 2019 & 2032
- Table 13: France Non Alcoholic Drinks Market Revenue (Million) Forecast, by Application 2019 & 2032
- Table 14: Spain Non Alcoholic Drinks Market Revenue (Million) Forecast, by Application 2019 & 2032
- Table 15: Russia Non Alcoholic Drinks Market Revenue (Million) Forecast, by Application 2019 & 2032
- Table 16: Italy Non Alcoholic Drinks Market Revenue (Million) Forecast, by Application 2019 & 2032
- Table 17: Rest of Europe Non Alcoholic Drinks Market Revenue (Million) Forecast, by Application 2019 & 2032
- Table 18: Global Non Alcoholic Drinks Market Revenue Million Forecast, by Country 2019 & 2032
- Table 19: China Non Alcoholic Drinks Market Revenue (Million) Forecast, by Application 2019 & 2032
- Table 20: India Non Alcoholic Drinks Market Revenue (Million) Forecast, by Application 2019 & 2032
- Table 21: Japan Non Alcoholic Drinks Market Revenue (Million) Forecast, by Application 2019 & 2032
- Table 22: Australia Non Alcoholic Drinks Market Revenue (Million) Forecast, by Application 2019 & 2032
- Table 23: Rest of Asia Pacific Non Alcoholic Drinks Market Revenue (Million) Forecast, by Application 2019 & 2032
- Table 24: Global Non Alcoholic Drinks Market Revenue Million Forecast, by Country 2019 & 2032
- Table 25: Brazil Non Alcoholic Drinks Market Revenue (Million) Forecast, by Application 2019 & 2032
- Table 26: Argentina Non Alcoholic Drinks Market Revenue (Million) Forecast, by Application 2019 & 2032
- Table 27: Rest of South America Non Alcoholic Drinks Market Revenue (Million) Forecast, by Application 2019 & 2032
- Table 28: Global Non Alcoholic Drinks Market Revenue Million Forecast, by Country 2019 & 2032
- Table 29: Non Alcoholic Drinks Market Revenue (Million) Forecast, by Application 2019 & 2032
- Table 30: Global Non Alcoholic Drinks Market Revenue Million Forecast, by Country 2019 & 2032
- Table 31: South Africa Non Alcoholic Drinks Market Revenue (Million) Forecast, by Application 2019 & 2032
- Table 32: Rest of Middle East Non Alcoholic Drinks Market Revenue (Million) Forecast, by Application 2019 & 2032
- Table 33: Global Non Alcoholic Drinks Market Revenue Million Forecast, by Type 2019 & 2032
- Table 34: Global Non Alcoholic Drinks Market Revenue Million Forecast, by Distribution Channel 2019 & 2032
- Table 35: Global Non Alcoholic Drinks Market Revenue Million Forecast, by Country 2019 & 2032
- Table 36: United States Non Alcoholic Drinks Market Revenue (Million) Forecast, by Application 2019 & 2032
- Table 37: Canada Non Alcoholic Drinks Market Revenue (Million) Forecast, by Application 2019 & 2032
- Table 38: Mexico Non Alcoholic Drinks Market Revenue (Million) Forecast, by Application 2019 & 2032
- Table 39: Rest of North America Non Alcoholic Drinks Market Revenue (Million) Forecast, by Application 2019 & 2032
- Table 40: Global Non Alcoholic Drinks Market Revenue Million Forecast, by Type 2019 & 2032
- Table 41: Global Non Alcoholic Drinks Market Revenue Million Forecast, by Distribution Channel 2019 & 2032
- Table 42: Global Non Alcoholic Drinks Market Revenue Million Forecast, by Country 2019 & 2032
- Table 43: Germany Non Alcoholic Drinks Market Revenue (Million) Forecast, by Application 2019 & 2032
- Table 44: United Kingdom Non Alcoholic Drinks Market Revenue (Million) Forecast, by Application 2019 & 2032
- Table 45: France Non Alcoholic Drinks Market Revenue (Million) Forecast, by Application 2019 & 2032
- Table 46: Spain Non Alcoholic Drinks Market Revenue (Million) Forecast, by Application 2019 & 2032
- Table 47: Russia Non Alcoholic Drinks Market Revenue (Million) Forecast, by Application 2019 & 2032
- Table 48: Italy Non Alcoholic Drinks Market Revenue (Million) Forecast, by Application 2019 & 2032
- Table 49: Rest of Europe Non Alcoholic Drinks Market Revenue (Million) Forecast, by Application 2019 & 2032
- Table 50: Global Non Alcoholic Drinks Market Revenue Million Forecast, by Type 2019 & 2032
- Table 51: Global Non Alcoholic Drinks Market Revenue Million Forecast, by Distribution Channel 2019 & 2032
- Table 52: Global Non Alcoholic Drinks Market Revenue Million Forecast, by Country 2019 & 2032
- Table 53: China Non Alcoholic Drinks Market Revenue (Million) Forecast, by Application 2019 & 2032
- Table 54: India Non Alcoholic Drinks Market Revenue (Million) Forecast, by Application 2019 & 2032
- Table 55: Japan Non Alcoholic Drinks Market Revenue (Million) Forecast, by Application 2019 & 2032
- Table 56: Australia Non Alcoholic Drinks Market Revenue (Million) Forecast, by Application 2019 & 2032
- Table 57: Rest of Asia Pacific Non Alcoholic Drinks Market Revenue (Million) Forecast, by Application 2019 & 2032
- Table 58: Global Non Alcoholic Drinks Market Revenue Million Forecast, by Type 2019 & 2032
- Table 59: Global Non Alcoholic Drinks Market Revenue Million Forecast, by Distribution Channel 2019 & 2032
- Table 60: Global Non Alcoholic Drinks Market Revenue Million Forecast, by Country 2019 & 2032
- Table 61: Brazil Non Alcoholic Drinks Market Revenue (Million) Forecast, by Application 2019 & 2032
- Table 62: Argentina Non Alcoholic Drinks Market Revenue (Million) Forecast, by Application 2019 & 2032
- Table 63: Rest of South America Non Alcoholic Drinks Market Revenue (Million) Forecast, by Application 2019 & 2032
- Table 64: Global Non Alcoholic Drinks Market Revenue Million Forecast, by Type 2019 & 2032
- Table 65: Global Non Alcoholic Drinks Market Revenue Million Forecast, by Distribution Channel 2019 & 2032
- Table 66: Global Non Alcoholic Drinks Market Revenue Million Forecast, by Country 2019 & 2032
- Table 67: Global Non Alcoholic Drinks Market Revenue Million Forecast, by Type 2019 & 2032
- Table 68: Global Non Alcoholic Drinks Market Revenue Million Forecast, by Distribution Channel 2019 & 2032
- Table 69: Global Non Alcoholic Drinks Market Revenue Million Forecast, by Country 2019 & 2032
- Table 70: South Africa Non Alcoholic Drinks Market Revenue (Million) Forecast, by Application 2019 & 2032
- Table 71: Rest of Middle East Non Alcoholic Drinks Market Revenue (Million) Forecast, by Application 2019 & 2032
Frequently Asked Questions
1. What is the projected Compound Annual Growth Rate (CAGR) of the Non Alcoholic Drinks Market?
The projected CAGR is approximately 4.70%.
2. Which companies are prominent players in the Non Alcoholic Drinks Market?
Key companies in the market include Nestle SA, Monster Beverage Corporation, PepsiCo Inc, Parle Agro, Danone SA, Keurig Dr Pepper Inc, Red Bull GmbH, The Coca-Cola Company, AriZona Beverages USA, IBS Partners Lt.
3. What are the main segments of the Non Alcoholic Drinks Market?
The market segments include Type, Distribution Channel.
4. Can you provide details about the market size?
The market size is estimated to be USD XX Million as of 2022.
5. What are some drivers contributing to market growth?
Increasing Health Consciousness Among Consumers; Increasing Demand for Vegan Food Products.
6. What are the notable trends driving market growth?
Strong Demand from Fitness Conscious Consumers.
7. Are there any restraints impacting market growth?
Poor Supply Chain.
8. Can you provide examples of recent developments in the market?
In July 2022, PepsiCo opened its largest US bottling plant in Colorado. The proposed facility might achieve 100% renewable electricity, best-in-class water efficiency, and reduced virgin plastic use.
9. What pricing options are available for accessing the report?
Pricing options include single-user, multi-user, and enterprise licenses priced at USD 4750, USD 5250, and USD 8750 respectively.
10. Is the market size provided in terms of value or volume?
The market size is provided in terms of value, measured in Million.
11. Are there any specific market keywords associated with the report?
Yes, the market keyword associated with the report is "Non Alcoholic Drinks Market," which aids in identifying and referencing the specific market segment covered.
12. How do I determine which pricing option suits my needs best?
The pricing options vary based on user requirements and access needs. Individual users may opt for single-user licenses, while businesses requiring broader access may choose multi-user or enterprise licenses for cost-effective access to the report.
13. Are there any additional resources or data provided in the Non Alcoholic Drinks Market report?
While the report offers comprehensive insights, it's advisable to review the specific contents or supplementary materials provided to ascertain if additional resources or data are available.
14. How can I stay updated on further developments or reports in the Non Alcoholic Drinks Market?
To stay informed about further developments, trends, and reports in the Non Alcoholic Drinks Market, consider subscribing to industry newsletters, following relevant companies and organizations, or regularly checking reputable industry news sources and publications.
Methodology
Step 1 - Identification of Relevant Samples Size from Population Database


Step 2 - Approaches for Defining Global Market Size (Value, Volume* & Price*)

Note*: In applicable scenarios
Step 3 - Data Sources
Primary Research
- Web Analytics
- Survey Reports
- Research Institute
- Latest Research Reports
- Opinion Leaders
Secondary Research
- Annual Reports
- White Paper
- Latest Press Release
- Industry Association
- Paid Database
- Investor Presentations

Step 4 - Data Triangulation
Involves using different sources of information in order to increase the validity of a study
These sources are likely to be stakeholders in a program - participants, other researchers, program staff, other community members, and so on.
Then we put all data in single framework & apply various statistical tools to find out the dynamic on the market.
During the analysis stage, feedback from the stakeholder groups would be compared to determine areas of agreement as well as areas of divergence


