
Key Insights
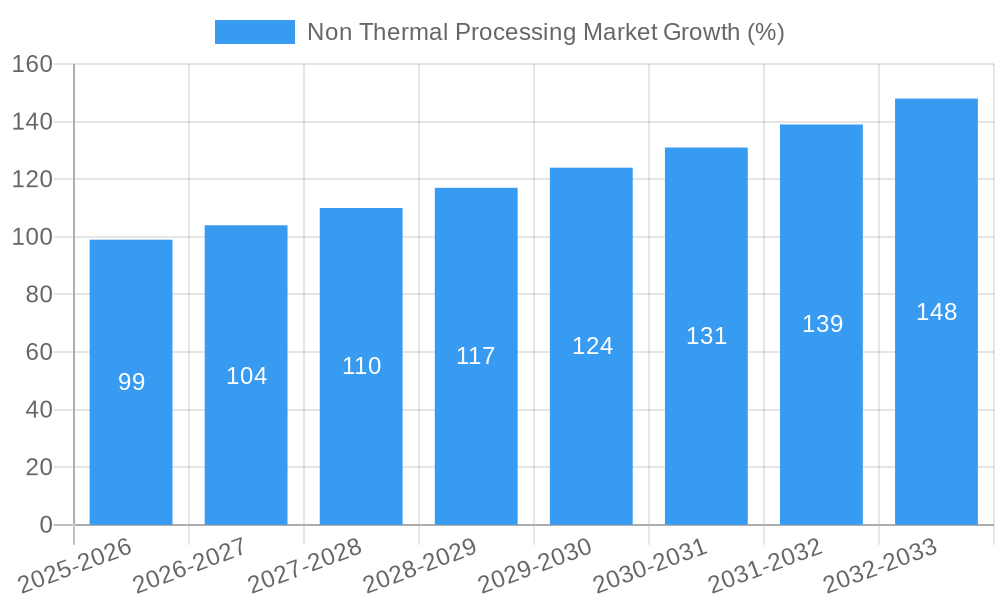
The non-thermal processing market is experiencing robust growth, driven by increasing consumer demand for extended shelf life, improved food safety, and enhanced nutritional value in food and beverages. A CAGR of 6.15% from 2019 to 2024 suggests a significant market expansion, projected to continue into the forecast period (2025-2033). Key drivers include the rising prevalence of foodborne illnesses, stricter regulatory standards for food safety, and the growing adoption of minimally processed foods. Technological advancements in High-Pressure Processing (HPP), Ultraviolet (UV) processing, and Pulsed Electrical Fields (PEF) are further fueling market growth. The market is segmented by technology (HPP holding a significant share, followed by UV processing, PEF, and others) and food type (with beverages and fruits & vegetables representing substantial segments due to their susceptibility to spoilage). While the market faces some restraints such as high initial investment costs for equipment and potential limitations in processing certain food types, the overall outlook remains positive, with substantial growth opportunities across various regions, particularly in North America and Europe, driven by strong regulatory support and consumer awareness. The Asia-Pacific region presents a significant emerging market due to increasing population and evolving consumer preferences.
The competitive landscape is comprised of both established players and emerging companies, indicating a dynamic market with ongoing innovation. Key players are focused on expanding their product portfolio, geographical reach, and technological capabilities to meet the rising demand. Strategic partnerships, acquisitions, and technological advancements are likely to reshape the market dynamics in the coming years. Future market growth will be influenced by factors such as technological innovation, regulatory changes, evolving consumer preferences, and the emergence of novel non-thermal processing technologies. The ongoing research and development efforts aimed at enhancing efficiency and expanding applications across a wider range of food products will further contribute to the market's expansion.
Non-Thermal Processing Market: A Comprehensive Report (2019-2033)
This comprehensive report provides an in-depth analysis of the Non-Thermal Processing market, offering valuable insights for industry stakeholders, investors, and strategic decision-makers. Covering the period from 2019 to 2033, with 2025 as the base year and a forecast period from 2025 to 2033, this report meticulously examines market dynamics, growth drivers, challenges, and opportunities. The report segments the market by technology (HPP, UV Processing, Pulsed Electrical Fields, Ultrasonic, Irradiation, Others) and food type (Beverages, Meat, Dairy, Fruits and Vegetables, Others), providing a granular view of market trends and future projections. The global Non-Thermal Processing market is estimated to be valued at xx Million in 2025 and is projected to reach xx Million by 2033, exhibiting a CAGR of xx% during the forecast period.
Non Thermal Processing Market Concentration & Innovation
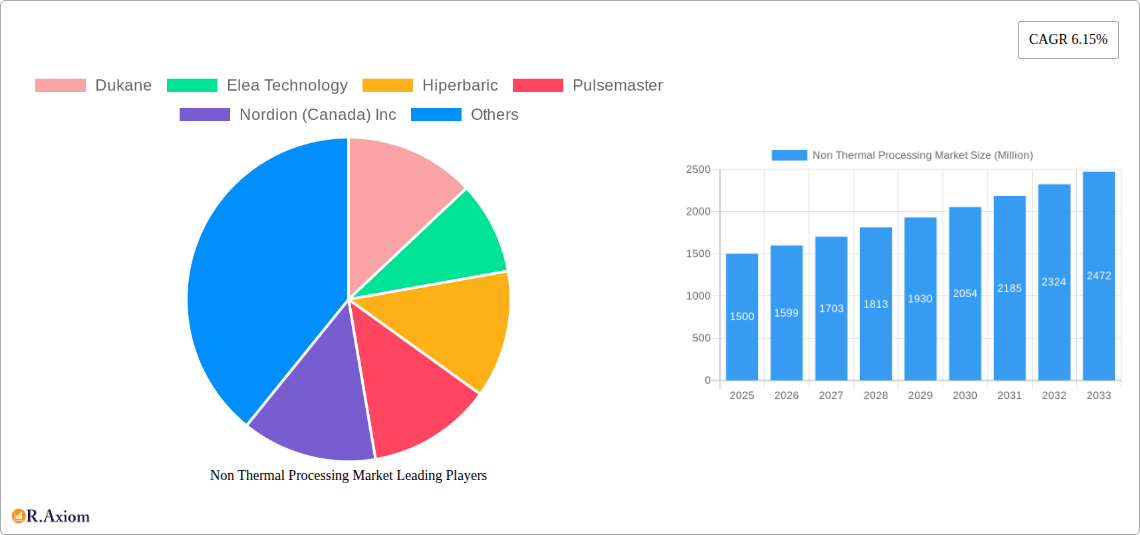
The Non-Thermal Processing market exhibits a moderately concentrated landscape, with a few dominant players holding significant market share. However, the market is also witnessing increasing innovation, driven by the need for efficient and safe food preservation techniques. Key players like Dukane, Elea Technology, Hiperbaric, and Pulsemaster are actively investing in R&D to develop advanced technologies and expand their product portfolios. Market share dynamics are influenced by factors such as technological advancements, regulatory approvals, and strategic partnerships. Recent M&A activities, though not extensively documented with precise deal values, indicate a consolidation trend within the industry. For instance, xx% of the market share is held by the top 5 players in 2025. The average deal value for M&A activities in the sector during 2020-2024 was approximately xx Million. This relatively low deal value could be attributable to factors such as market maturity in certain segments, but the overall trend shows the potential for increased consolidation. The regulatory landscape significantly impacts innovation and market entry. Stringent safety and quality standards necessitate extensive testing and approvals, creating barriers for smaller companies. Moreover, the availability of product substitutes, such as traditional thermal processing, poses a competitive challenge. Finally, evolving end-user preferences toward healthier and minimally processed foods are driving the demand for non-thermal technologies.
Non Thermal Processing Market Industry Trends & Insights
The Non-Thermal Processing market is experiencing robust growth, fueled by several key trends. The rising consumer preference for fresh, minimally processed foods is a primary driver, as non-thermal methods retain the nutritional value and sensory attributes of food products better than traditional thermal processing. Technological disruptions, such as advancements in HPP and pulsed electric field technology, are enhancing the efficiency and cost-effectiveness of these processes, further boosting market growth. The market penetration of non-thermal processing technologies varies across different food segments, with beverages and fruits and vegetables currently demonstrating higher adoption rates. This disparity is influenced by factors such as the suitability of the technology for specific food types, regulatory approvals, and consumer acceptance. Competitive dynamics are shaped by innovation, pricing strategies, and the expansion of geographical reach. Major players are engaging in strategic collaborations, partnerships, and investments to enhance their market position and expand into new geographical territories. The market's future trajectory is strongly influenced by the growing awareness of food safety and the increasing demand for extended shelf life. The forecasted CAGR of xx% suggests a robust growth momentum for the foreseeable future.
Dominant Markets & Segments in Non Thermal Processing Market
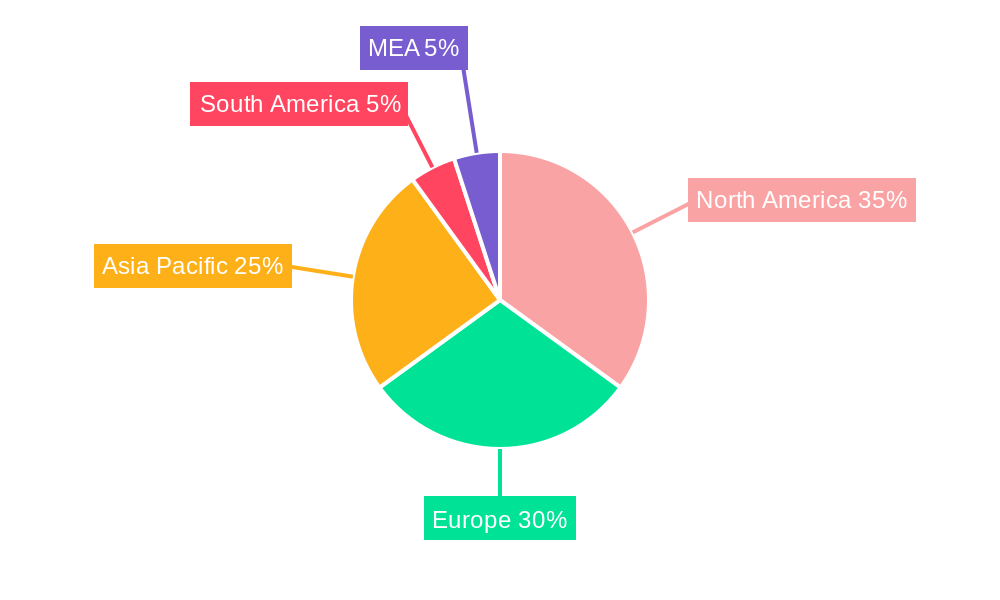
The Non-Thermal Processing market showcases regional variations in dominance and segment-specific growth. While precise regional dominance data is not available, the North American and European markets are currently leading in adoption and market size, driven by advanced infrastructure and stringent food safety regulations. Within the technological segments, High-Pressure Processing (HPP) currently holds a leading market share, owing to its established track record and broader applicability across various food types. However, Pulsed Electric Fields (PEF) and UV processing are emerging as promising technologies, attracting significant investments and research efforts. In terms of food type segmentation, the Beverages segment demonstrates the highest market share due to its adaptability and high consumer demand for fresh, shelf-stable beverages.
- Key Drivers for North American Dominance: Strong regulatory framework, robust infrastructure, high consumer disposable income, advanced technological adoption.
- Key Drivers for European Dominance: Stringent food safety standards, focus on preserving nutritional value, high demand for minimally processed foods.
- HPP Segment Dominance Drivers: Established technology, wide applicability, proven efficacy in extending shelf life and preserving quality.
Non Thermal Processing Market Product Developments
Recent product innovations focus on enhancing efficiency, reducing processing times, and improving scalability of non-thermal technologies. Advancements in HPP equipment design have led to increased throughput and reduced energy consumption. Meanwhile, the development of more compact and affordable UV and PEF systems is broadening their accessibility to small and medium-sized enterprises. This market is seeing a focus on achieving optimal balance between efficacy, cost-effectiveness, and ease of integration into existing food processing workflows. Such advancements are directly improving market fit and creating a competitive edge for companies that successfully bring them to market.
Report Scope & Segmentation Analysis
This report comprehensively analyzes the Non-Thermal Processing market across various segments. By Technology: HPP, UV Processing, Pulsed Electrical Fields, Ultrasonic, Irradiation, and Others each segment presents unique market dynamics, growth projections, and competitive landscapes. Similarly, the market is segmented by Food Type: Beverages, Meat, Dairy, Fruits and Vegetables, and Others, each exhibiting specific processing requirements and market demand. Each segment’s growth is projected based on current trends, technological advancements, and regulatory factors. Competitive dynamics differ considerably across segments due to the varying technology maturity and consumer preferences.
Key Drivers of Non Thermal Processing Market Growth
Several factors drive the growth of the Non-Thermal Processing market. Technological advancements leading to improved efficiency and affordability of non-thermal processing equipment are key. The growing consumer demand for minimally processed foods with extended shelf life further fuels market expansion. Stringent food safety regulations are also driving the adoption of non-thermal technologies as safer alternatives to traditional methods. Finally, supportive government policies promoting innovation and investment in the food processing sector contribute to market expansion.
Challenges in the Non Thermal Processing Market Sector
Despite the positive growth outlook, the Non-Thermal Processing market faces several challenges. The high initial investment costs associated with acquiring non-thermal processing equipment can deter smaller companies from adopting these technologies. Supply chain disruptions, particularly in the procurement of specialized equipment components, can impact production and market availability. Intense competition among existing players, coupled with the entry of new players, puts pressure on pricing and profit margins. The varying regulatory landscapes across different regions also pose a challenge for global market expansion. For example, delays in obtaining regulatory approvals can significantly affect market entry and growth.
Emerging Opportunities in Non Thermal Processing Market
The Non-Thermal Processing market presents several emerging opportunities. The expansion into new and developing markets with growing consumer demand for processed foods holds significant potential. The development of innovative combinations of non-thermal technologies, such as combining HPP with UV processing, offers enhanced efficacy and expanded applications. Finally, catering to the increasing consumer awareness of food safety and sustainability presents new opportunities for companies offering environmentally friendly processing solutions.
Leading Players in the Non Thermal Processing Market Market
- Dukane
- Elea Technology
- Hiperbaric
- Pulsemaster
- Nordion (Canada) Inc
- CHIC Group
- Symbios Technologies
- GRAY*STAR Inc
- *List Not Exhaustive
Key Developments in Non Thermal Processing Market Industry
- 2024 Q4: Hiperbaric launched a new generation of HPP equipment with enhanced efficiency.
- 2023 Q2: A major merger occurred between two smaller players in the UV processing segment, creating a larger, more competitive entity.
- 2022 Q1: Several new regulatory guidelines were introduced impacting HPP equipment in the European Union.
(Further developments need to be populated with specific data.)
Strategic Outlook for Non Thermal Processing Market Market
The Non-Thermal Processing market is poised for significant growth, driven by the confluence of technological advancements, changing consumer preferences, and supportive regulatory environments. The market will continue to expand as new technologies emerge and existing ones become more efficient and cost-effective. Companies that prioritize innovation, strategic partnerships, and adaptability to evolving consumer needs will be best positioned to capitalize on the opportunities within this dynamic market. The focus will likely shift toward sustainable and environmentally friendly processing solutions to meet the growing demand for eco-conscious food production.
Non Thermal Processing Market Segmentation
-
1. Technology
- 1.1. HPP
- 1.2. UV Processing
- 1.3. Pulsed Electrical Fields
- 1.4. Ultrasonic
- 1.5. Irradiation
- 1.6. Others
-
2. Food Type
- 2.1. Beverages
- 2.2. Meat
- 2.3. Dairy
- 2.4. Fruits and Vegetables
- 2.5. Others
Non Thermal Processing Market Segmentation By Geography
-
1. North America
- 1.1. United States
- 1.2. Canada
- 1.3. Mexico
- 1.4. Rest of North America
-
2. Europe
- 2.1. Spain
- 2.2. United Kingdom
- 2.3. Germany
- 2.4. France
- 2.5. Italy
- 2.6. Russia
- 2.7. Rest of Europe
-
3. Asia Pacific
- 3.1. China
- 3.2. Japan
- 3.3. India
- 3.4. Australia
- 3.5. Rest of Asia Pacific
- 4. Rest of the World
Non Thermal Processing Market REPORT HIGHLIGHTS
| Aspects | Details |
|---|---|
| Study Period | 2019-2033 |
| Base Year | 2024 |
| Estimated Year | 2025 |
| Forecast Period | 2025-2033 |
| Historical Period | 2019-2024 |
| Growth Rate | CAGR of 6.15% from 2019-2033 |
| Segmentation |
|
Table of Contents
- 1. Introduction
- 1.1. Research Scope
- 1.2. Market Segmentation
- 1.3. Research Methodology
- 1.4. Definitions and Assumptions
- 2. Executive Summary
- 2.1. Introduction
- 3. Market Dynamics
- 3.1. Introduction
- 3.2. Market Drivers
- 3.2.1. Rising Health & Wellness Trends; Strategic Initiatives By Key Players
- 3.3. Market Restrains
- 3.3.1. Cost Considerations Coupled With Availability Of Alternatives
- 3.4. Market Trends
- 3.4.1. Growing Demand For High Quality Foods
- 4. Market Factor Analysis
- 4.1. Porters Five Forces
- 4.2. Supply/Value Chain
- 4.3. PESTEL analysis
- 4.4. Market Entropy
- 4.5. Patent/Trademark Analysis
- 5. Global Non Thermal Processing Market Analysis, Insights and Forecast, 2019-2031
- 5.1. Market Analysis, Insights and Forecast - by Technology
- 5.1.1. HPP
- 5.1.2. UV Processing
- 5.1.3. Pulsed Electrical Fields
- 5.1.4. Ultrasonic
- 5.1.5. Irradiation
- 5.1.6. Others
- 5.2. Market Analysis, Insights and Forecast - by Food Type
- 5.2.1. Beverages
- 5.2.2. Meat
- 5.2.3. Dairy
- 5.2.4. Fruits and Vegetables
- 5.2.5. Others
- 5.3. Market Analysis, Insights and Forecast - by Region
- 5.3.1. North America
- 5.3.2. Europe
- 5.3.3. Asia Pacific
- 5.3.4. Rest of the World
- 5.1. Market Analysis, Insights and Forecast - by Technology
- 6. North America Non Thermal Processing Market Analysis, Insights and Forecast, 2019-2031
- 6.1. Market Analysis, Insights and Forecast - by Technology
- 6.1.1. HPP
- 6.1.2. UV Processing
- 6.1.3. Pulsed Electrical Fields
- 6.1.4. Ultrasonic
- 6.1.5. Irradiation
- 6.1.6. Others
- 6.2. Market Analysis, Insights and Forecast - by Food Type
- 6.2.1. Beverages
- 6.2.2. Meat
- 6.2.3. Dairy
- 6.2.4. Fruits and Vegetables
- 6.2.5. Others
- 6.1. Market Analysis, Insights and Forecast - by Technology
- 7. Europe Non Thermal Processing Market Analysis, Insights and Forecast, 2019-2031
- 7.1. Market Analysis, Insights and Forecast - by Technology
- 7.1.1. HPP
- 7.1.2. UV Processing
- 7.1.3. Pulsed Electrical Fields
- 7.1.4. Ultrasonic
- 7.1.5. Irradiation
- 7.1.6. Others
- 7.2. Market Analysis, Insights and Forecast - by Food Type
- 7.2.1. Beverages
- 7.2.2. Meat
- 7.2.3. Dairy
- 7.2.4. Fruits and Vegetables
- 7.2.5. Others
- 7.1. Market Analysis, Insights and Forecast - by Technology
- 8. Asia Pacific Non Thermal Processing Market Analysis, Insights and Forecast, 2019-2031
- 8.1. Market Analysis, Insights and Forecast - by Technology
- 8.1.1. HPP
- 8.1.2. UV Processing
- 8.1.3. Pulsed Electrical Fields
- 8.1.4. Ultrasonic
- 8.1.5. Irradiation
- 8.1.6. Others
- 8.2. Market Analysis, Insights and Forecast - by Food Type
- 8.2.1. Beverages
- 8.2.2. Meat
- 8.2.3. Dairy
- 8.2.4. Fruits and Vegetables
- 8.2.5. Others
- 8.1. Market Analysis, Insights and Forecast - by Technology
- 9. Rest of the World Non Thermal Processing Market Analysis, Insights and Forecast, 2019-2031
- 9.1. Market Analysis, Insights and Forecast - by Technology
- 9.1.1. HPP
- 9.1.2. UV Processing
- 9.1.3. Pulsed Electrical Fields
- 9.1.4. Ultrasonic
- 9.1.5. Irradiation
- 9.1.6. Others
- 9.2. Market Analysis, Insights and Forecast - by Food Type
- 9.2.1. Beverages
- 9.2.2. Meat
- 9.2.3. Dairy
- 9.2.4. Fruits and Vegetables
- 9.2.5. Others
- 9.1. Market Analysis, Insights and Forecast - by Technology
- 10. North America Non Thermal Processing Market Analysis, Insights and Forecast, 2019-2031
- 10.1. Market Analysis, Insights and Forecast - By Country/Sub-region
- 10.1.1 United States
- 10.1.2 Canada
- 10.1.3 Mexico
- 11. Europe Non Thermal Processing Market Analysis, Insights and Forecast, 2019-2031
- 11.1. Market Analysis, Insights and Forecast - By Country/Sub-region
- 11.1.1 Germany
- 11.1.2 United Kingdom
- 11.1.3 France
- 11.1.4 Spain
- 11.1.5 Italy
- 11.1.6 Spain
- 11.1.7 Belgium
- 11.1.8 Netherland
- 11.1.9 Nordics
- 11.1.10 Rest of Europe
- 12. Asia Pacific Non Thermal Processing Market Analysis, Insights and Forecast, 2019-2031
- 12.1. Market Analysis, Insights and Forecast - By Country/Sub-region
- 12.1.1 China
- 12.1.2 Japan
- 12.1.3 India
- 12.1.4 South Korea
- 12.1.5 Southeast Asia
- 12.1.6 Australia
- 12.1.7 Indonesia
- 12.1.8 Phillipes
- 12.1.9 Singapore
- 12.1.10 Thailandc
- 12.1.11 Rest of Asia Pacific
- 13. South America Non Thermal Processing Market Analysis, Insights and Forecast, 2019-2031
- 13.1. Market Analysis, Insights and Forecast - By Country/Sub-region
- 13.1.1 Brazil
- 13.1.2 Argentina
- 13.1.3 Peru
- 13.1.4 Chile
- 13.1.5 Colombia
- 13.1.6 Ecuador
- 13.1.7 Venezuela
- 13.1.8 Rest of South America
- 14. North America Non Thermal Processing Market Analysis, Insights and Forecast, 2019-2031
- 14.1. Market Analysis, Insights and Forecast - By Country/Sub-region
- 14.1.1 United States
- 14.1.2 Canada
- 14.1.3 Mexico
- 15. MEA Non Thermal Processing Market Analysis, Insights and Forecast, 2019-2031
- 15.1. Market Analysis, Insights and Forecast - By Country/Sub-region
- 15.1.1 United Arab Emirates
- 15.1.2 Saudi Arabia
- 15.1.3 South Africa
- 15.1.4 Rest of Middle East and Africa
- 16. Competitive Analysis
- 16.1. Global Market Share Analysis 2024
- 16.2. Company Profiles
- 16.2.1 Dukane
- 16.2.1.1. Overview
- 16.2.1.2. Products
- 16.2.1.3. SWOT Analysis
- 16.2.1.4. Recent Developments
- 16.2.1.5. Financials (Based on Availability)
- 16.2.2 Elea Technology
- 16.2.2.1. Overview
- 16.2.2.2. Products
- 16.2.2.3. SWOT Analysis
- 16.2.2.4. Recent Developments
- 16.2.2.5. Financials (Based on Availability)
- 16.2.3 Hiperbaric
- 16.2.3.1. Overview
- 16.2.3.2. Products
- 16.2.3.3. SWOT Analysis
- 16.2.3.4. Recent Developments
- 16.2.3.5. Financials (Based on Availability)
- 16.2.4 Pulsemaster
- 16.2.4.1. Overview
- 16.2.4.2. Products
- 16.2.4.3. SWOT Analysis
- 16.2.4.4. Recent Developments
- 16.2.4.5. Financials (Based on Availability)
- 16.2.5 Nordion (Canada) Inc
- 16.2.5.1. Overview
- 16.2.5.2. Products
- 16.2.5.3. SWOT Analysis
- 16.2.5.4. Recent Developments
- 16.2.5.5. Financials (Based on Availability)
- 16.2.6 CHIC Group
- 16.2.6.1. Overview
- 16.2.6.2. Products
- 16.2.6.3. SWOT Analysis
- 16.2.6.4. Recent Developments
- 16.2.6.5. Financials (Based on Availability)
- 16.2.7 Symbios Technologies
- 16.2.7.1. Overview
- 16.2.7.2. Products
- 16.2.7.3. SWOT Analysis
- 16.2.7.4. Recent Developments
- 16.2.7.5. Financials (Based on Availability)
- 16.2.8 GRAY*STAR Inc *List Not Exhaustive
- 16.2.8.1. Overview
- 16.2.8.2. Products
- 16.2.8.3. SWOT Analysis
- 16.2.8.4. Recent Developments
- 16.2.8.5. Financials (Based on Availability)
- 16.2.1 Dukane
List of Figures
- Figure 1: Global Non Thermal Processing Market Revenue Breakdown (Million, %) by Region 2024 & 2032
- Figure 2: North America Non Thermal Processing Market Revenue (Million), by Country 2024 & 2032
- Figure 3: North America Non Thermal Processing Market Revenue Share (%), by Country 2024 & 2032
- Figure 4: Europe Non Thermal Processing Market Revenue (Million), by Country 2024 & 2032
- Figure 5: Europe Non Thermal Processing Market Revenue Share (%), by Country 2024 & 2032
- Figure 6: Asia Pacific Non Thermal Processing Market Revenue (Million), by Country 2024 & 2032
- Figure 7: Asia Pacific Non Thermal Processing Market Revenue Share (%), by Country 2024 & 2032
- Figure 8: South America Non Thermal Processing Market Revenue (Million), by Country 2024 & 2032
- Figure 9: South America Non Thermal Processing Market Revenue Share (%), by Country 2024 & 2032
- Figure 10: North America Non Thermal Processing Market Revenue (Million), by Country 2024 & 2032
- Figure 11: North America Non Thermal Processing Market Revenue Share (%), by Country 2024 & 2032
- Figure 12: MEA Non Thermal Processing Market Revenue (Million), by Country 2024 & 2032
- Figure 13: MEA Non Thermal Processing Market Revenue Share (%), by Country 2024 & 2032
- Figure 14: North America Non Thermal Processing Market Revenue (Million), by Technology 2024 & 2032
- Figure 15: North America Non Thermal Processing Market Revenue Share (%), by Technology 2024 & 2032
- Figure 16: North America Non Thermal Processing Market Revenue (Million), by Food Type 2024 & 2032
- Figure 17: North America Non Thermal Processing Market Revenue Share (%), by Food Type 2024 & 2032
- Figure 18: North America Non Thermal Processing Market Revenue (Million), by Country 2024 & 2032
- Figure 19: North America Non Thermal Processing Market Revenue Share (%), by Country 2024 & 2032
- Figure 20: Europe Non Thermal Processing Market Revenue (Million), by Technology 2024 & 2032
- Figure 21: Europe Non Thermal Processing Market Revenue Share (%), by Technology 2024 & 2032
- Figure 22: Europe Non Thermal Processing Market Revenue (Million), by Food Type 2024 & 2032
- Figure 23: Europe Non Thermal Processing Market Revenue Share (%), by Food Type 2024 & 2032
- Figure 24: Europe Non Thermal Processing Market Revenue (Million), by Country 2024 & 2032
- Figure 25: Europe Non Thermal Processing Market Revenue Share (%), by Country 2024 & 2032
- Figure 26: Asia Pacific Non Thermal Processing Market Revenue (Million), by Technology 2024 & 2032
- Figure 27: Asia Pacific Non Thermal Processing Market Revenue Share (%), by Technology 2024 & 2032
- Figure 28: Asia Pacific Non Thermal Processing Market Revenue (Million), by Food Type 2024 & 2032
- Figure 29: Asia Pacific Non Thermal Processing Market Revenue Share (%), by Food Type 2024 & 2032
- Figure 30: Asia Pacific Non Thermal Processing Market Revenue (Million), by Country 2024 & 2032
- Figure 31: Asia Pacific Non Thermal Processing Market Revenue Share (%), by Country 2024 & 2032
- Figure 32: Rest of the World Non Thermal Processing Market Revenue (Million), by Technology 2024 & 2032
- Figure 33: Rest of the World Non Thermal Processing Market Revenue Share (%), by Technology 2024 & 2032
- Figure 34: Rest of the World Non Thermal Processing Market Revenue (Million), by Food Type 2024 & 2032
- Figure 35: Rest of the World Non Thermal Processing Market Revenue Share (%), by Food Type 2024 & 2032
- Figure 36: Rest of the World Non Thermal Processing Market Revenue (Million), by Country 2024 & 2032
- Figure 37: Rest of the World Non Thermal Processing Market Revenue Share (%), by Country 2024 & 2032
List of Tables
- Table 1: Global Non Thermal Processing Market Revenue Million Forecast, by Region 2019 & 2032
- Table 2: Global Non Thermal Processing Market Revenue Million Forecast, by Technology 2019 & 2032
- Table 3: Global Non Thermal Processing Market Revenue Million Forecast, by Food Type 2019 & 2032
- Table 4: Global Non Thermal Processing Market Revenue Million Forecast, by Region 2019 & 2032
- Table 5: Global Non Thermal Processing Market Revenue Million Forecast, by Country 2019 & 2032
- Table 6: United States Non Thermal Processing Market Revenue (Million) Forecast, by Application 2019 & 2032
- Table 7: Canada Non Thermal Processing Market Revenue (Million) Forecast, by Application 2019 & 2032
- Table 8: Mexico Non Thermal Processing Market Revenue (Million) Forecast, by Application 2019 & 2032
- Table 9: Global Non Thermal Processing Market Revenue Million Forecast, by Country 2019 & 2032
- Table 10: Germany Non Thermal Processing Market Revenue (Million) Forecast, by Application 2019 & 2032
- Table 11: United Kingdom Non Thermal Processing Market Revenue (Million) Forecast, by Application 2019 & 2032
- Table 12: France Non Thermal Processing Market Revenue (Million) Forecast, by Application 2019 & 2032
- Table 13: Spain Non Thermal Processing Market Revenue (Million) Forecast, by Application 2019 & 2032
- Table 14: Italy Non Thermal Processing Market Revenue (Million) Forecast, by Application 2019 & 2032
- Table 15: Spain Non Thermal Processing Market Revenue (Million) Forecast, by Application 2019 & 2032
- Table 16: Belgium Non Thermal Processing Market Revenue (Million) Forecast, by Application 2019 & 2032
- Table 17: Netherland Non Thermal Processing Market Revenue (Million) Forecast, by Application 2019 & 2032
- Table 18: Nordics Non Thermal Processing Market Revenue (Million) Forecast, by Application 2019 & 2032
- Table 19: Rest of Europe Non Thermal Processing Market Revenue (Million) Forecast, by Application 2019 & 2032
- Table 20: Global Non Thermal Processing Market Revenue Million Forecast, by Country 2019 & 2032
- Table 21: China Non Thermal Processing Market Revenue (Million) Forecast, by Application 2019 & 2032
- Table 22: Japan Non Thermal Processing Market Revenue (Million) Forecast, by Application 2019 & 2032
- Table 23: India Non Thermal Processing Market Revenue (Million) Forecast, by Application 2019 & 2032
- Table 24: South Korea Non Thermal Processing Market Revenue (Million) Forecast, by Application 2019 & 2032
- Table 25: Southeast Asia Non Thermal Processing Market Revenue (Million) Forecast, by Application 2019 & 2032
- Table 26: Australia Non Thermal Processing Market Revenue (Million) Forecast, by Application 2019 & 2032
- Table 27: Indonesia Non Thermal Processing Market Revenue (Million) Forecast, by Application 2019 & 2032
- Table 28: Phillipes Non Thermal Processing Market Revenue (Million) Forecast, by Application 2019 & 2032
- Table 29: Singapore Non Thermal Processing Market Revenue (Million) Forecast, by Application 2019 & 2032
- Table 30: Thailandc Non Thermal Processing Market Revenue (Million) Forecast, by Application 2019 & 2032
- Table 31: Rest of Asia Pacific Non Thermal Processing Market Revenue (Million) Forecast, by Application 2019 & 2032
- Table 32: Global Non Thermal Processing Market Revenue Million Forecast, by Country 2019 & 2032
- Table 33: Brazil Non Thermal Processing Market Revenue (Million) Forecast, by Application 2019 & 2032
- Table 34: Argentina Non Thermal Processing Market Revenue (Million) Forecast, by Application 2019 & 2032
- Table 35: Peru Non Thermal Processing Market Revenue (Million) Forecast, by Application 2019 & 2032
- Table 36: Chile Non Thermal Processing Market Revenue (Million) Forecast, by Application 2019 & 2032
- Table 37: Colombia Non Thermal Processing Market Revenue (Million) Forecast, by Application 2019 & 2032
- Table 38: Ecuador Non Thermal Processing Market Revenue (Million) Forecast, by Application 2019 & 2032
- Table 39: Venezuela Non Thermal Processing Market Revenue (Million) Forecast, by Application 2019 & 2032
- Table 40: Rest of South America Non Thermal Processing Market Revenue (Million) Forecast, by Application 2019 & 2032
- Table 41: Global Non Thermal Processing Market Revenue Million Forecast, by Country 2019 & 2032
- Table 42: United States Non Thermal Processing Market Revenue (Million) Forecast, by Application 2019 & 2032
- Table 43: Canada Non Thermal Processing Market Revenue (Million) Forecast, by Application 2019 & 2032
- Table 44: Mexico Non Thermal Processing Market Revenue (Million) Forecast, by Application 2019 & 2032
- Table 45: Global Non Thermal Processing Market Revenue Million Forecast, by Country 2019 & 2032
- Table 46: United Arab Emirates Non Thermal Processing Market Revenue (Million) Forecast, by Application 2019 & 2032
- Table 47: Saudi Arabia Non Thermal Processing Market Revenue (Million) Forecast, by Application 2019 & 2032
- Table 48: South Africa Non Thermal Processing Market Revenue (Million) Forecast, by Application 2019 & 2032
- Table 49: Rest of Middle East and Africa Non Thermal Processing Market Revenue (Million) Forecast, by Application 2019 & 2032
- Table 50: Global Non Thermal Processing Market Revenue Million Forecast, by Technology 2019 & 2032
- Table 51: Global Non Thermal Processing Market Revenue Million Forecast, by Food Type 2019 & 2032
- Table 52: Global Non Thermal Processing Market Revenue Million Forecast, by Country 2019 & 2032
- Table 53: United States Non Thermal Processing Market Revenue (Million) Forecast, by Application 2019 & 2032
- Table 54: Canada Non Thermal Processing Market Revenue (Million) Forecast, by Application 2019 & 2032
- Table 55: Mexico Non Thermal Processing Market Revenue (Million) Forecast, by Application 2019 & 2032
- Table 56: Rest of North America Non Thermal Processing Market Revenue (Million) Forecast, by Application 2019 & 2032
- Table 57: Global Non Thermal Processing Market Revenue Million Forecast, by Technology 2019 & 2032
- Table 58: Global Non Thermal Processing Market Revenue Million Forecast, by Food Type 2019 & 2032
- Table 59: Global Non Thermal Processing Market Revenue Million Forecast, by Country 2019 & 2032
- Table 60: Spain Non Thermal Processing Market Revenue (Million) Forecast, by Application 2019 & 2032
- Table 61: United Kingdom Non Thermal Processing Market Revenue (Million) Forecast, by Application 2019 & 2032
- Table 62: Germany Non Thermal Processing Market Revenue (Million) Forecast, by Application 2019 & 2032
- Table 63: France Non Thermal Processing Market Revenue (Million) Forecast, by Application 2019 & 2032
- Table 64: Italy Non Thermal Processing Market Revenue (Million) Forecast, by Application 2019 & 2032
- Table 65: Russia Non Thermal Processing Market Revenue (Million) Forecast, by Application 2019 & 2032
- Table 66: Rest of Europe Non Thermal Processing Market Revenue (Million) Forecast, by Application 2019 & 2032
- Table 67: Global Non Thermal Processing Market Revenue Million Forecast, by Technology 2019 & 2032
- Table 68: Global Non Thermal Processing Market Revenue Million Forecast, by Food Type 2019 & 2032
- Table 69: Global Non Thermal Processing Market Revenue Million Forecast, by Country 2019 & 2032
- Table 70: China Non Thermal Processing Market Revenue (Million) Forecast, by Application 2019 & 2032
- Table 71: Japan Non Thermal Processing Market Revenue (Million) Forecast, by Application 2019 & 2032
- Table 72: India Non Thermal Processing Market Revenue (Million) Forecast, by Application 2019 & 2032
- Table 73: Australia Non Thermal Processing Market Revenue (Million) Forecast, by Application 2019 & 2032
- Table 74: Rest of Asia Pacific Non Thermal Processing Market Revenue (Million) Forecast, by Application 2019 & 2032
- Table 75: Global Non Thermal Processing Market Revenue Million Forecast, by Technology 2019 & 2032
- Table 76: Global Non Thermal Processing Market Revenue Million Forecast, by Food Type 2019 & 2032
- Table 77: Global Non Thermal Processing Market Revenue Million Forecast, by Country 2019 & 2032
Frequently Asked Questions
1. What is the projected Compound Annual Growth Rate (CAGR) of the Non Thermal Processing Market?
The projected CAGR is approximately 6.15%.
2. Which companies are prominent players in the Non Thermal Processing Market?
Key companies in the market include Dukane, Elea Technology, Hiperbaric, Pulsemaster, Nordion (Canada) Inc, CHIC Group, Symbios Technologies, GRAY*STAR Inc *List Not Exhaustive.
3. What are the main segments of the Non Thermal Processing Market?
The market segments include Technology, Food Type.
4. Can you provide details about the market size?
The market size is estimated to be USD XX Million as of 2022.
5. What are some drivers contributing to market growth?
Rising Health & Wellness Trends; Strategic Initiatives By Key Players.
6. What are the notable trends driving market growth?
Growing Demand For High Quality Foods.
7. Are there any restraints impacting market growth?
Cost Considerations Coupled With Availability Of Alternatives.
8. Can you provide examples of recent developments in the market?
N/A
9. What pricing options are available for accessing the report?
Pricing options include single-user, multi-user, and enterprise licenses priced at USD 4750, USD 5250, and USD 8750 respectively.
10. Is the market size provided in terms of value or volume?
The market size is provided in terms of value, measured in Million.
11. Are there any specific market keywords associated with the report?
Yes, the market keyword associated with the report is "Non Thermal Processing Market," which aids in identifying and referencing the specific market segment covered.
12. How do I determine which pricing option suits my needs best?
The pricing options vary based on user requirements and access needs. Individual users may opt for single-user licenses, while businesses requiring broader access may choose multi-user or enterprise licenses for cost-effective access to the report.
13. Are there any additional resources or data provided in the Non Thermal Processing Market report?
While the report offers comprehensive insights, it's advisable to review the specific contents or supplementary materials provided to ascertain if additional resources or data are available.
14. How can I stay updated on further developments or reports in the Non Thermal Processing Market?
To stay informed about further developments, trends, and reports in the Non Thermal Processing Market, consider subscribing to industry newsletters, following relevant companies and organizations, or regularly checking reputable industry news sources and publications.
Methodology
Step 1 - Identification of Relevant Samples Size from Population Database


Step 2 - Approaches for Defining Global Market Size (Value, Volume* & Price*)

Note*: In applicable scenarios
Step 3 - Data Sources
Primary Research
- Web Analytics
- Survey Reports
- Research Institute
- Latest Research Reports
- Opinion Leaders
Secondary Research
- Annual Reports
- White Paper
- Latest Press Release
- Industry Association
- Paid Database
- Investor Presentations

Step 4 - Data Triangulation
Involves using different sources of information in order to increase the validity of a study
These sources are likely to be stakeholders in a program - participants, other researchers, program staff, other community members, and so on.
Then we put all data in single framework & apply various statistical tools to find out the dynamic on the market.
During the analysis stage, feedback from the stakeholder groups would be compared to determine areas of agreement as well as areas of divergence


