
Key Insights
The Nordic renewable energy market, encompassing countries like Sweden, Norway, Finland, Denmark, and Iceland, presents a robust and rapidly expanding sector. Driven by stringent environmental policies, ambitious renewable energy targets, and a geographically advantageous landscape conducive to various renewable sources, the market exhibits a Compound Annual Growth Rate (CAGR) exceeding 5% throughout the forecast period (2025-2033). Hydropower, historically dominant, continues to play a significant role, particularly in Norway and Iceland. However, substantial growth is projected in solar and wind power, fueled by decreasing technology costs and increasing energy independence ambitions. Onshore wind farms are expanding across the region, while offshore wind projects, especially in the North Sea, are attracting significant investments, promising to become major contributors in the coming years. Bioenergy, another key segment, benefits from established forestry and agricultural sectors. The market segmentation by application reveals a diversified demand, with residential, commercial, and industrial sectors all contributing significantly, alongside a growing transportation sector increasingly reliant on renewable fuels and electricity. Government incentives, such as subsidies and tax breaks, alongside growing consumer awareness of sustainable energy, further support market expansion.
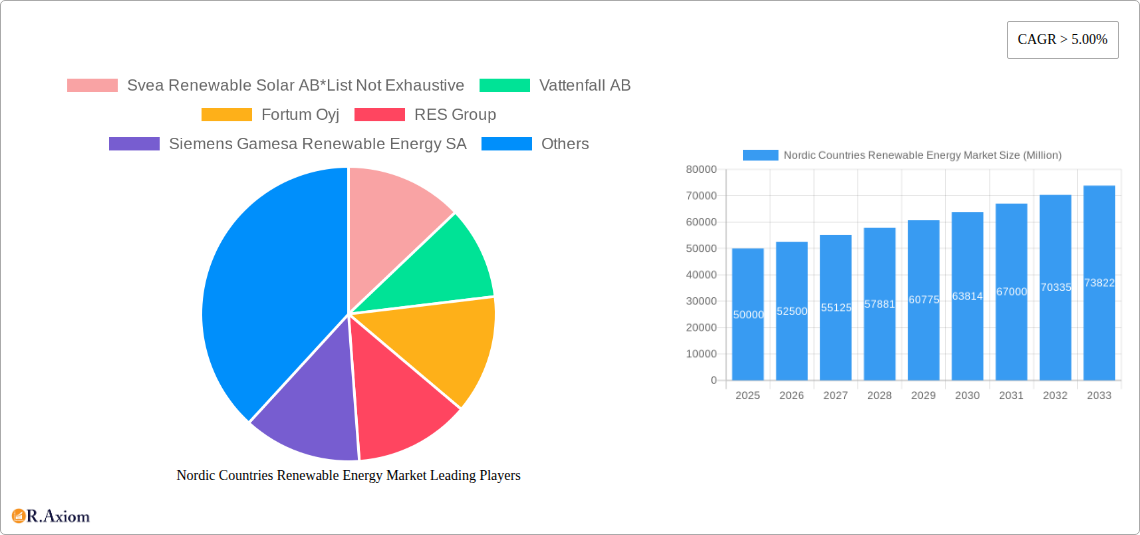
The competitive landscape involves a mix of established international players and local Nordic companies. Large energy utilities like Vattenfall AB and Fortum Oyj are active across multiple renewable energy segments, alongside specialized companies focused on solar (Svea Renewable Solar AB), wind (InnoVentum AB), and biofuels (Swedish Biofuels AB). This competitive dynamic fosters innovation and ensures a continuous supply of competitive renewable energy solutions. However, challenges remain, including grid infrastructure limitations in accommodating the intermittent nature of some renewable sources, and the need for continued investment in research and development to improve efficiency and reduce costs, particularly for offshore wind projects. Overall, the Nordic renewable energy market is poised for significant expansion, driven by supportive policy environments, technological advancements, and a commitment to achieving ambitious sustainability goals.
Nordic Countries Renewable Energy Market: A Comprehensive Report (2019-2033)
This in-depth report provides a comprehensive analysis of the Nordic countries' renewable energy market, covering the period from 2019 to 2033. It offers invaluable insights for investors, industry stakeholders, and policymakers seeking to understand the market's dynamics, growth potential, and future trajectory. The report leverages extensive data analysis, incorporating key market indicators, company profiles, and recent industry developments to deliver actionable intelligence. The base year for this report is 2025, with forecasts extending to 2033.
Nordic Countries Renewable Energy Market Concentration & Innovation
This section analyzes the competitive landscape of the Nordic renewable energy market, examining market concentration, innovation drivers, regulatory frameworks, and M&A activities. The market is characterized by a mix of large multinational corporations and smaller, specialized players. Market share is highly dynamic, with ongoing consolidation and new entrants.
- Market Concentration: The market exhibits moderate concentration, with a few dominant players holding significant market share, particularly in hydro and wind power. However, the solar segment shows a more fragmented landscape with numerous smaller companies competing for projects. Precise market share figures for each player are unavailable for xx.
- Innovation Drivers: Strong government support through subsidies, tax incentives, and ambitious renewable energy targets is a primary driver of innovation. Technological advancements, particularly in wind turbine technology (e.g., increased capacity and efficiency) and solar PV technology (e.g., advancements in perovskite solar cells), also stimulate innovation.
- Regulatory Frameworks: The Nordic countries have robust regulatory frameworks promoting renewable energy development, including feed-in tariffs, auctions for renewable energy projects, and stringent environmental regulations. These regulations significantly influence investment decisions and project development.
- Product Substitutes: While renewable energy sources are increasingly cost-competitive with fossil fuels, the main substitute remains fossil fuels, particularly in heavy industries and transportation. The competitiveness of renewable energy solutions will continue to play an important role in its growth.
- End-User Trends: Growing awareness of climate change and the desire for sustainable energy sources are driving increased demand for renewable energy among residential, commercial, and industrial consumers.
- M&A Activities: The renewable energy sector in the Nordics has witnessed significant M&A activity, driven by companies seeking to expand their project portfolios and enhance their market position. Transaction values vary significantly, with some deals exceeding xx Million. The report includes a detailed analysis of major M&A transactions from the past few years, quantifying deal values where available.
Nordic Countries Renewable Energy Market Industry Trends & Insights
This section explores key trends shaping the Nordic renewable energy market, including market growth drivers, technological disruptions, and competitive dynamics. The market is characterized by strong growth potential, driven by supportive government policies, technological advancements, and increasing consumer demand for renewable energy.
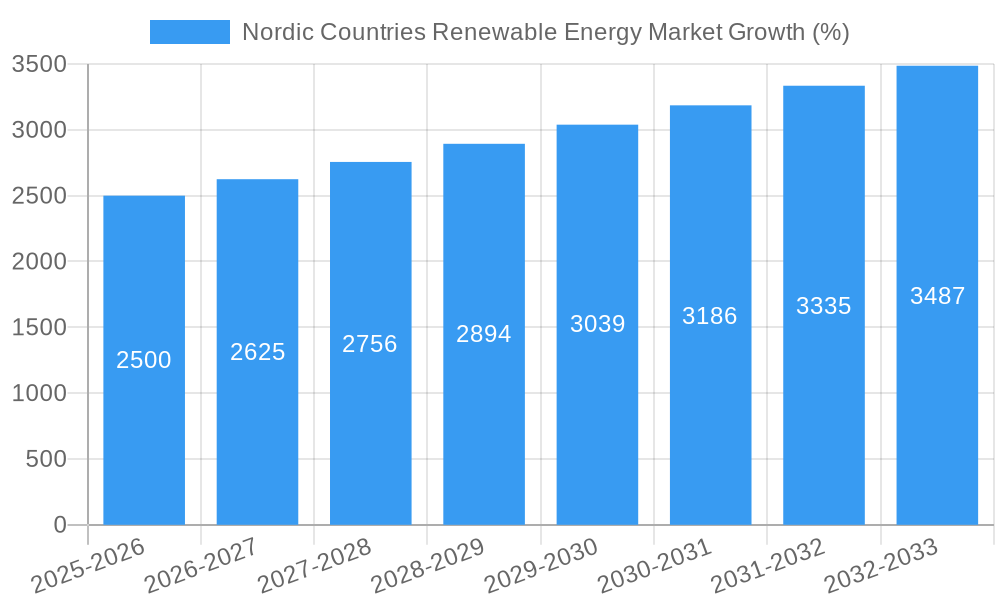
The market is experiencing robust growth, with a projected Compound Annual Growth Rate (CAGR) of xx% during the forecast period (2025-2033). Market penetration of renewable energy in the overall energy mix is steadily increasing, driven primarily by a shift toward wind and solar power. Technological advancements such as increased efficiency in solar and wind technologies are contributing factors to its growth. Consumer preferences are shifting towards renewable energy as concerns regarding climate change and environmental sustainability grow, while competitive dynamics are marked by increasing competition among energy providers and renewable energy developers. Specific sector CAGR will be detailed in the report.
Dominant Markets & Segments in Nordic Countries Renewable Energy Market
This section identifies the leading regions, countries, and segments within the Nordic renewable energy market.
By Type:
- Wind (Onshore & Offshore): Wind energy, particularly offshore wind, is the dominant renewable energy source in the Nordics, benefiting from strong wind resources and government support. Key drivers include substantial government investment in offshore wind farms and technological advancements in turbine technology.
- Hydropower: Hydropower remains a significant contributor, with countries like Norway possessing vast hydropower resources. However, new hydropower projects are facing increasing environmental concerns and permitting challenges, limiting the growth in this segment.
- Solar: Solar power is experiencing rapid growth, driven by decreasing costs and increasing government incentives. However, the relatively lower solar irradiance compared to other regions somewhat limits the market.
- Bioenergy: Bioenergy plays a significant role, particularly in heating and electricity generation.
- Other Types (Geothermal, Tidal, etc.): These sources represent a smaller share of the overall market but hold potential for future growth.
By Application:
- Electricity Generation: The most dominant application of renewable energy.
- Heating: Bioenergy and heat pumps are widely used for heating in residential and commercial sectors.
- Transportation: The electrification of transportation is driving increased demand for renewable energy sources.
- Industry: Renewable energy is gaining traction in industrial applications, particularly in processes that can utilize heat.
Detailed analysis of the market dominance of each segment, including economic policies and infrastructure influences, will be elaborated in the report.
Nordic Countries Renewable Energy Market Product Developments
Recent years have witnessed significant advancements in renewable energy technologies, particularly in wind and solar power. Larger and more efficient wind turbines, coupled with advancements in solar PV technology (e.g., increased efficiency, bifacial panels), are driving down the cost of renewable energy. Innovations in energy storage solutions are also crucial in increasing the reliability and viability of renewable energy sources. This increasing efficiency and affordability directly impact market penetration and competitive dynamics.
Report Scope & Segmentation Analysis
This report comprehensively segments the Nordic renewable energy market by type (solar, wind, hydro, bioenergy, and others) and application (residential, commercial, industrial, and transportation). Each segment's growth projections, market size estimations (in Millions), and competitive dynamics are meticulously analyzed. For example, the wind energy segment is further divided into onshore and offshore, reflecting the significant differences in technology, investment costs, and regulatory frameworks. Similarly, detailed analysis of solar PV technology (e.g., crystalline silicon, thin-film) and its market segment breakdown will be included.
Key Drivers of Nordic Countries Renewable Energy Market Growth
The Nordic renewable energy market's growth is propelled by several key factors. Stringent climate targets and ambitious renewable energy policies implemented by Nordic governments are stimulating significant investment in renewable energy projects. Decreasing technology costs (particularly in wind and solar) and improving energy storage solutions also play a major role. The increased environmental consciousness among consumers and businesses and the diversification of energy supply to enhance energy security further fuels the market expansion.
Challenges in the Nordic Countries Renewable Energy Market Sector
Despite the promising growth prospects, the Nordic renewable energy market faces several challenges. Intermittency of renewable energy sources (wind and solar) remains a key concern, requiring investment in energy storage solutions or grid balancing mechanisms. Permitting processes for new renewable energy projects can be lengthy and complex, delaying project development. Grid infrastructure limitations and the need for significant upgrades to accommodate increased renewable energy capacity pose considerable challenges, as do potential supply chain bottlenecks due to material shortages, particularly in components for wind turbines and solar panels.
Emerging Opportunities in Nordic Countries Renewable Energy Market
The Nordic renewable energy market presents several exciting opportunities. The growing demand for green hydrogen production offers significant growth potential. Offshore wind energy, with its vast untapped potential, presents a considerable market opportunity. Integration of renewable energy with smart grids and energy management systems enables optimization of energy utilization and grid stability. Further expansion of renewable energy applications in industries like transportation, heating and cooling also offers promising opportunities.
Leading Players in the Nordic Countries Renewable Energy Market Market
- Svea Renewable Solar AB
- Vattenfall AB
- Fortum Oyj
- RES Group
- Siemens Gamesa Renewable Energy SA
- Swedish Biofuels AB
- InnoVentum AB
- Axpo Holding AG
- General Electric Company
Key Developments in Nordic Countries Renewable Energy Market Industry
- December 2021: Eolus Vind AB expanded an existing wind power off-take deal bundle to 117 MW and announced the construction of a 400-MW onshore wind farm for Aquila Capital in Norway. This demonstrates the strong investor interest in the Nordic onshore wind market.
- June 2022: SveaSolar's subsidiary, SveaSolar Utility, secured USD 106 Million in funding from CarValInvestors to develop 500 MW of solar projects. This signifies the growing investment in utility-scale solar projects in the region.
- October 2022: Enlight Renewable Energy Ltd. commenced commercial production at the 372-MW Bjornberget wind farm in Sweden, utilizing Siemens Gamesa 6.2-MW turbines. This highlights the deployment of advanced wind turbine technology in the region.
Strategic Outlook for Nordic Countries Renewable Energy Market Market
The Nordic renewable energy market is poised for continued strong growth, driven by supportive policies, technological advancements, and increasing consumer demand. The region's commitment to sustainability and its abundant renewable resources position it as a global leader in the transition to a clean energy future. Further investment in grid infrastructure, energy storage solutions, and the development of new technologies will be crucial in unlocking the full potential of the market. The opportunities in offshore wind, green hydrogen, and smart grids are expected to generate significant growth in the coming years.
Nordic Countries Renewable Energy Market Segmentation
-
1. Type
- 1.1. Solar
- 1.2. Wind (incl. Onshore & Offshore)
- 1.3. Hydro
- 1.4. Bioenergy
- 1.5. Other Types (Geothermal, Tidal, etc.)
-
2. Geography
- 2.1. Norway
- 2.2. Sweden
- 2.3. Denmark
- 2.4. Finland
Nordic Countries Renewable Energy Market Segmentation By Geography
- 1. Norway
- 2. Sweden
- 3. Denmark
- 4. Finland
Nordic Countries Renewable Energy Market REPORT HIGHLIGHTS
| Aspects | Details |
|---|---|
| Study Period | 2019-2033 |
| Base Year | 2024 |
| Estimated Year | 2025 |
| Forecast Period | 2025-2033 |
| Historical Period | 2019-2024 |
| Growth Rate | CAGR of > 5.00% from 2019-2033 |
| Segmentation |
|
Table of Contents
- 1. Introduction
- 1.1. Research Scope
- 1.2. Market Segmentation
- 1.3. Research Methodology
- 1.4. Definitions and Assumptions
- 2. Executive Summary
- 2.1. Introduction
- 3. Market Dynamics
- 3.1. Introduction
- 3.2. Market Drivers
- 3.2.1. 4.; Growing Penetration of the Technology in Long-Duration Energy Storage Applications4.; Increasing Adoption of Renewable Energy
- 3.3. Market Restrains
- 3.3.1. 4.; Low Energy of Battery Cells
- 3.4. Market Trends
- 3.4.1. Hydro-based Electricity Generation is Expected to Dominate the Market
- 4. Market Factor Analysis
- 4.1. Porters Five Forces
- 4.2. Supply/Value Chain
- 4.3. PESTEL analysis
- 4.4. Market Entropy
- 4.5. Patent/Trademark Analysis
- 5. Nordic Countries Renewable Energy Market Analysis, Insights and Forecast, 2019-2031
- 5.1. Market Analysis, Insights and Forecast - by Type
- 5.1.1. Solar
- 5.1.2. Wind (incl. Onshore & Offshore)
- 5.1.3. Hydro
- 5.1.4. Bioenergy
- 5.1.5. Other Types (Geothermal, Tidal, etc.)
- 5.2. Market Analysis, Insights and Forecast - by Geography
- 5.2.1. Norway
- 5.2.2. Sweden
- 5.2.3. Denmark
- 5.2.4. Finland
- 5.3. Market Analysis, Insights and Forecast - by Region
- 5.3.1. Norway
- 5.3.2. Sweden
- 5.3.3. Denmark
- 5.3.4. Finland
- 5.1. Market Analysis, Insights and Forecast - by Type
- 6. Norway Nordic Countries Renewable Energy Market Analysis, Insights and Forecast, 2019-2031
- 6.1. Market Analysis, Insights and Forecast - by Type
- 6.1.1. Solar
- 6.1.2. Wind (incl. Onshore & Offshore)
- 6.1.3. Hydro
- 6.1.4. Bioenergy
- 6.1.5. Other Types (Geothermal, Tidal, etc.)
- 6.2. Market Analysis, Insights and Forecast - by Geography
- 6.2.1. Norway
- 6.2.2. Sweden
- 6.2.3. Denmark
- 6.2.4. Finland
- 6.1. Market Analysis, Insights and Forecast - by Type
- 7. Sweden Nordic Countries Renewable Energy Market Analysis, Insights and Forecast, 2019-2031
- 7.1. Market Analysis, Insights and Forecast - by Type
- 7.1.1. Solar
- 7.1.2. Wind (incl. Onshore & Offshore)
- 7.1.3. Hydro
- 7.1.4. Bioenergy
- 7.1.5. Other Types (Geothermal, Tidal, etc.)
- 7.2. Market Analysis, Insights and Forecast - by Geography
- 7.2.1. Norway
- 7.2.2. Sweden
- 7.2.3. Denmark
- 7.2.4. Finland
- 7.1. Market Analysis, Insights and Forecast - by Type
- 8. Denmark Nordic Countries Renewable Energy Market Analysis, Insights and Forecast, 2019-2031
- 8.1. Market Analysis, Insights and Forecast - by Type
- 8.1.1. Solar
- 8.1.2. Wind (incl. Onshore & Offshore)
- 8.1.3. Hydro
- 8.1.4. Bioenergy
- 8.1.5. Other Types (Geothermal, Tidal, etc.)
- 8.2. Market Analysis, Insights and Forecast - by Geography
- 8.2.1. Norway
- 8.2.2. Sweden
- 8.2.3. Denmark
- 8.2.4. Finland
- 8.1. Market Analysis, Insights and Forecast - by Type
- 9. Finland Nordic Countries Renewable Energy Market Analysis, Insights and Forecast, 2019-2031
- 9.1. Market Analysis, Insights and Forecast - by Type
- 9.1.1. Solar
- 9.1.2. Wind (incl. Onshore & Offshore)
- 9.1.3. Hydro
- 9.1.4. Bioenergy
- 9.1.5. Other Types (Geothermal, Tidal, etc.)
- 9.2. Market Analysis, Insights and Forecast - by Geography
- 9.2.1. Norway
- 9.2.2. Sweden
- 9.2.3. Denmark
- 9.2.4. Finland
- 9.1. Market Analysis, Insights and Forecast - by Type
- 10. North America Nordic Countries Renewable Energy Market Analysis, Insights and Forecast, 2019-2031
- 10.1. Market Analysis, Insights and Forecast - By Country/Sub-region
- 10.1.1 United States
- 10.1.2 Canada
- 10.1.3 Mexico
- 11. Europe Nordic Countries Renewable Energy Market Analysis, Insights and Forecast, 2019-2031
- 11.1. Market Analysis, Insights and Forecast - By Country/Sub-region
- 11.1.1 Germany
- 11.1.2 United Kingdom
- 11.1.3 France
- 11.1.4 Spain
- 11.1.5 Italy
- 11.1.6 Spain
- 11.1.7 Belgium
- 11.1.8 Netherland
- 11.1.9 Nordics
- 11.1.10 Rest of Europe
- 12. Asia Pacific Nordic Countries Renewable Energy Market Analysis, Insights and Forecast, 2019-2031
- 12.1. Market Analysis, Insights and Forecast - By Country/Sub-region
- 12.1.1 China
- 12.1.2 Japan
- 12.1.3 India
- 12.1.4 South Korea
- 12.1.5 Southeast Asia
- 12.1.6 Australia
- 12.1.7 Indonesia
- 12.1.8 Phillipes
- 12.1.9 Singapore
- 12.1.10 Thailandc
- 12.1.11 Rest of Asia Pacific
- 13. South America Nordic Countries Renewable Energy Market Analysis, Insights and Forecast, 2019-2031
- 13.1. Market Analysis, Insights and Forecast - By Country/Sub-region
- 13.1.1 Brazil
- 13.1.2 Argentina
- 13.1.3 Peru
- 13.1.4 Chile
- 13.1.5 Colombia
- 13.1.6 Ecuador
- 13.1.7 Venezuela
- 13.1.8 Rest of South America
- 14. North America Nordic Countries Renewable Energy Market Analysis, Insights and Forecast, 2019-2031
- 14.1. Market Analysis, Insights and Forecast - By Country/Sub-region
- 14.1.1 United States
- 14.1.2 Canada
- 14.1.3 Mexico
- 15. MEA Nordic Countries Renewable Energy Market Analysis, Insights and Forecast, 2019-2031
- 15.1. Market Analysis, Insights and Forecast - By Country/Sub-region
- 15.1.1 United Arab Emirates
- 15.1.2 Saudi Arabia
- 15.1.3 South Africa
- 15.1.4 Rest of Middle East and Africa
- 16. Competitive Analysis
- 16.1. Market Share Analysis 2024
- 16.2. Company Profiles
- 16.2.1 Svea Renewable Solar AB*List Not Exhaustive
- 16.2.1.1. Overview
- 16.2.1.2. Products
- 16.2.1.3. SWOT Analysis
- 16.2.1.4. Recent Developments
- 16.2.1.5. Financials (Based on Availability)
- 16.2.2 Vattenfall AB
- 16.2.2.1. Overview
- 16.2.2.2. Products
- 16.2.2.3. SWOT Analysis
- 16.2.2.4. Recent Developments
- 16.2.2.5. Financials (Based on Availability)
- 16.2.3 Fortum Oyj
- 16.2.3.1. Overview
- 16.2.3.2. Products
- 16.2.3.3. SWOT Analysis
- 16.2.3.4. Recent Developments
- 16.2.3.5. Financials (Based on Availability)
- 16.2.4 RES Group
- 16.2.4.1. Overview
- 16.2.4.2. Products
- 16.2.4.3. SWOT Analysis
- 16.2.4.4. Recent Developments
- 16.2.4.5. Financials (Based on Availability)
- 16.2.5 Siemens Gamesa Renewable Energy SA
- 16.2.5.1. Overview
- 16.2.5.2. Products
- 16.2.5.3. SWOT Analysis
- 16.2.5.4. Recent Developments
- 16.2.5.5. Financials (Based on Availability)
- 16.2.6 Swedish Biofuels AB
- 16.2.6.1. Overview
- 16.2.6.2. Products
- 16.2.6.3. SWOT Analysis
- 16.2.6.4. Recent Developments
- 16.2.6.5. Financials (Based on Availability)
- 16.2.7 InnoVentum AB
- 16.2.7.1. Overview
- 16.2.7.2. Products
- 16.2.7.3. SWOT Analysis
- 16.2.7.4. Recent Developments
- 16.2.7.5. Financials (Based on Availability)
- 16.2.8 Axpo Holding AG
- 16.2.8.1. Overview
- 16.2.8.2. Products
- 16.2.8.3. SWOT Analysis
- 16.2.8.4. Recent Developments
- 16.2.8.5. Financials (Based on Availability)
- 16.2.9 General Electric Company
- 16.2.9.1. Overview
- 16.2.9.2. Products
- 16.2.9.3. SWOT Analysis
- 16.2.9.4. Recent Developments
- 16.2.9.5. Financials (Based on Availability)
- 16.2.1 Svea Renewable Solar AB*List Not Exhaustive
List of Figures
- Figure 1: Nordic Countries Renewable Energy Market Revenue Breakdown (Million, %) by Product 2024 & 2032
- Figure 2: Nordic Countries Renewable Energy Market Share (%) by Company 2024
List of Tables
- Table 1: Nordic Countries Renewable Energy Market Revenue Million Forecast, by Region 2019 & 2032
- Table 2: Nordic Countries Renewable Energy Market Volume gigawatt Forecast, by Region 2019 & 2032
- Table 3: Nordic Countries Renewable Energy Market Revenue Million Forecast, by Type 2019 & 2032
- Table 4: Nordic Countries Renewable Energy Market Volume gigawatt Forecast, by Type 2019 & 2032
- Table 5: Nordic Countries Renewable Energy Market Revenue Million Forecast, by Geography 2019 & 2032
- Table 6: Nordic Countries Renewable Energy Market Volume gigawatt Forecast, by Geography 2019 & 2032
- Table 7: Nordic Countries Renewable Energy Market Revenue Million Forecast, by Region 2019 & 2032
- Table 8: Nordic Countries Renewable Energy Market Volume gigawatt Forecast, by Region 2019 & 2032
- Table 9: Nordic Countries Renewable Energy Market Revenue Million Forecast, by Country 2019 & 2032
- Table 10: Nordic Countries Renewable Energy Market Volume gigawatt Forecast, by Country 2019 & 2032
- Table 11: United States Nordic Countries Renewable Energy Market Revenue (Million) Forecast, by Application 2019 & 2032
- Table 12: United States Nordic Countries Renewable Energy Market Volume (gigawatt) Forecast, by Application 2019 & 2032
- Table 13: Canada Nordic Countries Renewable Energy Market Revenue (Million) Forecast, by Application 2019 & 2032
- Table 14: Canada Nordic Countries Renewable Energy Market Volume (gigawatt) Forecast, by Application 2019 & 2032
- Table 15: Mexico Nordic Countries Renewable Energy Market Revenue (Million) Forecast, by Application 2019 & 2032
- Table 16: Mexico Nordic Countries Renewable Energy Market Volume (gigawatt) Forecast, by Application 2019 & 2032
- Table 17: Nordic Countries Renewable Energy Market Revenue Million Forecast, by Country 2019 & 2032
- Table 18: Nordic Countries Renewable Energy Market Volume gigawatt Forecast, by Country 2019 & 2032
- Table 19: Germany Nordic Countries Renewable Energy Market Revenue (Million) Forecast, by Application 2019 & 2032
- Table 20: Germany Nordic Countries Renewable Energy Market Volume (gigawatt) Forecast, by Application 2019 & 2032
- Table 21: United Kingdom Nordic Countries Renewable Energy Market Revenue (Million) Forecast, by Application 2019 & 2032
- Table 22: United Kingdom Nordic Countries Renewable Energy Market Volume (gigawatt) Forecast, by Application 2019 & 2032
- Table 23: France Nordic Countries Renewable Energy Market Revenue (Million) Forecast, by Application 2019 & 2032
- Table 24: France Nordic Countries Renewable Energy Market Volume (gigawatt) Forecast, by Application 2019 & 2032
- Table 25: Spain Nordic Countries Renewable Energy Market Revenue (Million) Forecast, by Application 2019 & 2032
- Table 26: Spain Nordic Countries Renewable Energy Market Volume (gigawatt) Forecast, by Application 2019 & 2032
- Table 27: Italy Nordic Countries Renewable Energy Market Revenue (Million) Forecast, by Application 2019 & 2032
- Table 28: Italy Nordic Countries Renewable Energy Market Volume (gigawatt) Forecast, by Application 2019 & 2032
- Table 29: Spain Nordic Countries Renewable Energy Market Revenue (Million) Forecast, by Application 2019 & 2032
- Table 30: Spain Nordic Countries Renewable Energy Market Volume (gigawatt) Forecast, by Application 2019 & 2032
- Table 31: Belgium Nordic Countries Renewable Energy Market Revenue (Million) Forecast, by Application 2019 & 2032
- Table 32: Belgium Nordic Countries Renewable Energy Market Volume (gigawatt) Forecast, by Application 2019 & 2032
- Table 33: Netherland Nordic Countries Renewable Energy Market Revenue (Million) Forecast, by Application 2019 & 2032
- Table 34: Netherland Nordic Countries Renewable Energy Market Volume (gigawatt) Forecast, by Application 2019 & 2032
- Table 35: Nordics Nordic Countries Renewable Energy Market Revenue (Million) Forecast, by Application 2019 & 2032
- Table 36: Nordics Nordic Countries Renewable Energy Market Volume (gigawatt) Forecast, by Application 2019 & 2032
- Table 37: Rest of Europe Nordic Countries Renewable Energy Market Revenue (Million) Forecast, by Application 2019 & 2032
- Table 38: Rest of Europe Nordic Countries Renewable Energy Market Volume (gigawatt) Forecast, by Application 2019 & 2032
- Table 39: Nordic Countries Renewable Energy Market Revenue Million Forecast, by Country 2019 & 2032
- Table 40: Nordic Countries Renewable Energy Market Volume gigawatt Forecast, by Country 2019 & 2032
- Table 41: China Nordic Countries Renewable Energy Market Revenue (Million) Forecast, by Application 2019 & 2032
- Table 42: China Nordic Countries Renewable Energy Market Volume (gigawatt) Forecast, by Application 2019 & 2032
- Table 43: Japan Nordic Countries Renewable Energy Market Revenue (Million) Forecast, by Application 2019 & 2032
- Table 44: Japan Nordic Countries Renewable Energy Market Volume (gigawatt) Forecast, by Application 2019 & 2032
- Table 45: India Nordic Countries Renewable Energy Market Revenue (Million) Forecast, by Application 2019 & 2032
- Table 46: India Nordic Countries Renewable Energy Market Volume (gigawatt) Forecast, by Application 2019 & 2032
- Table 47: South Korea Nordic Countries Renewable Energy Market Revenue (Million) Forecast, by Application 2019 & 2032
- Table 48: South Korea Nordic Countries Renewable Energy Market Volume (gigawatt) Forecast, by Application 2019 & 2032
- Table 49: Southeast Asia Nordic Countries Renewable Energy Market Revenue (Million) Forecast, by Application 2019 & 2032
- Table 50: Southeast Asia Nordic Countries Renewable Energy Market Volume (gigawatt) Forecast, by Application 2019 & 2032
- Table 51: Australia Nordic Countries Renewable Energy Market Revenue (Million) Forecast, by Application 2019 & 2032
- Table 52: Australia Nordic Countries Renewable Energy Market Volume (gigawatt) Forecast, by Application 2019 & 2032
- Table 53: Indonesia Nordic Countries Renewable Energy Market Revenue (Million) Forecast, by Application 2019 & 2032
- Table 54: Indonesia Nordic Countries Renewable Energy Market Volume (gigawatt) Forecast, by Application 2019 & 2032
- Table 55: Phillipes Nordic Countries Renewable Energy Market Revenue (Million) Forecast, by Application 2019 & 2032
- Table 56: Phillipes Nordic Countries Renewable Energy Market Volume (gigawatt) Forecast, by Application 2019 & 2032
- Table 57: Singapore Nordic Countries Renewable Energy Market Revenue (Million) Forecast, by Application 2019 & 2032
- Table 58: Singapore Nordic Countries Renewable Energy Market Volume (gigawatt) Forecast, by Application 2019 & 2032
- Table 59: Thailandc Nordic Countries Renewable Energy Market Revenue (Million) Forecast, by Application 2019 & 2032
- Table 60: Thailandc Nordic Countries Renewable Energy Market Volume (gigawatt) Forecast, by Application 2019 & 2032
- Table 61: Rest of Asia Pacific Nordic Countries Renewable Energy Market Revenue (Million) Forecast, by Application 2019 & 2032
- Table 62: Rest of Asia Pacific Nordic Countries Renewable Energy Market Volume (gigawatt) Forecast, by Application 2019 & 2032
- Table 63: Nordic Countries Renewable Energy Market Revenue Million Forecast, by Country 2019 & 2032
- Table 64: Nordic Countries Renewable Energy Market Volume gigawatt Forecast, by Country 2019 & 2032
- Table 65: Brazil Nordic Countries Renewable Energy Market Revenue (Million) Forecast, by Application 2019 & 2032
- Table 66: Brazil Nordic Countries Renewable Energy Market Volume (gigawatt) Forecast, by Application 2019 & 2032
- Table 67: Argentina Nordic Countries Renewable Energy Market Revenue (Million) Forecast, by Application 2019 & 2032
- Table 68: Argentina Nordic Countries Renewable Energy Market Volume (gigawatt) Forecast, by Application 2019 & 2032
- Table 69: Peru Nordic Countries Renewable Energy Market Revenue (Million) Forecast, by Application 2019 & 2032
- Table 70: Peru Nordic Countries Renewable Energy Market Volume (gigawatt) Forecast, by Application 2019 & 2032
- Table 71: Chile Nordic Countries Renewable Energy Market Revenue (Million) Forecast, by Application 2019 & 2032
- Table 72: Chile Nordic Countries Renewable Energy Market Volume (gigawatt) Forecast, by Application 2019 & 2032
- Table 73: Colombia Nordic Countries Renewable Energy Market Revenue (Million) Forecast, by Application 2019 & 2032
- Table 74: Colombia Nordic Countries Renewable Energy Market Volume (gigawatt) Forecast, by Application 2019 & 2032
- Table 75: Ecuador Nordic Countries Renewable Energy Market Revenue (Million) Forecast, by Application 2019 & 2032
- Table 76: Ecuador Nordic Countries Renewable Energy Market Volume (gigawatt) Forecast, by Application 2019 & 2032
- Table 77: Venezuela Nordic Countries Renewable Energy Market Revenue (Million) Forecast, by Application 2019 & 2032
- Table 78: Venezuela Nordic Countries Renewable Energy Market Volume (gigawatt) Forecast, by Application 2019 & 2032
- Table 79: Rest of South America Nordic Countries Renewable Energy Market Revenue (Million) Forecast, by Application 2019 & 2032
- Table 80: Rest of South America Nordic Countries Renewable Energy Market Volume (gigawatt) Forecast, by Application 2019 & 2032
- Table 81: Nordic Countries Renewable Energy Market Revenue Million Forecast, by Country 2019 & 2032
- Table 82: Nordic Countries Renewable Energy Market Volume gigawatt Forecast, by Country 2019 & 2032
- Table 83: United States Nordic Countries Renewable Energy Market Revenue (Million) Forecast, by Application 2019 & 2032
- Table 84: United States Nordic Countries Renewable Energy Market Volume (gigawatt) Forecast, by Application 2019 & 2032
- Table 85: Canada Nordic Countries Renewable Energy Market Revenue (Million) Forecast, by Application 2019 & 2032
- Table 86: Canada Nordic Countries Renewable Energy Market Volume (gigawatt) Forecast, by Application 2019 & 2032
- Table 87: Mexico Nordic Countries Renewable Energy Market Revenue (Million) Forecast, by Application 2019 & 2032
- Table 88: Mexico Nordic Countries Renewable Energy Market Volume (gigawatt) Forecast, by Application 2019 & 2032
- Table 89: Nordic Countries Renewable Energy Market Revenue Million Forecast, by Country 2019 & 2032
- Table 90: Nordic Countries Renewable Energy Market Volume gigawatt Forecast, by Country 2019 & 2032
- Table 91: United Arab Emirates Nordic Countries Renewable Energy Market Revenue (Million) Forecast, by Application 2019 & 2032
- Table 92: United Arab Emirates Nordic Countries Renewable Energy Market Volume (gigawatt) Forecast, by Application 2019 & 2032
- Table 93: Saudi Arabia Nordic Countries Renewable Energy Market Revenue (Million) Forecast, by Application 2019 & 2032
- Table 94: Saudi Arabia Nordic Countries Renewable Energy Market Volume (gigawatt) Forecast, by Application 2019 & 2032
- Table 95: South Africa Nordic Countries Renewable Energy Market Revenue (Million) Forecast, by Application 2019 & 2032
- Table 96: South Africa Nordic Countries Renewable Energy Market Volume (gigawatt) Forecast, by Application 2019 & 2032
- Table 97: Rest of Middle East and Africa Nordic Countries Renewable Energy Market Revenue (Million) Forecast, by Application 2019 & 2032
- Table 98: Rest of Middle East and Africa Nordic Countries Renewable Energy Market Volume (gigawatt) Forecast, by Application 2019 & 2032
- Table 99: Nordic Countries Renewable Energy Market Revenue Million Forecast, by Type 2019 & 2032
- Table 100: Nordic Countries Renewable Energy Market Volume gigawatt Forecast, by Type 2019 & 2032
- Table 101: Nordic Countries Renewable Energy Market Revenue Million Forecast, by Geography 2019 & 2032
- Table 102: Nordic Countries Renewable Energy Market Volume gigawatt Forecast, by Geography 2019 & 2032
- Table 103: Nordic Countries Renewable Energy Market Revenue Million Forecast, by Country 2019 & 2032
- Table 104: Nordic Countries Renewable Energy Market Volume gigawatt Forecast, by Country 2019 & 2032
- Table 105: Nordic Countries Renewable Energy Market Revenue Million Forecast, by Type 2019 & 2032
- Table 106: Nordic Countries Renewable Energy Market Volume gigawatt Forecast, by Type 2019 & 2032
- Table 107: Nordic Countries Renewable Energy Market Revenue Million Forecast, by Geography 2019 & 2032
- Table 108: Nordic Countries Renewable Energy Market Volume gigawatt Forecast, by Geography 2019 & 2032
- Table 109: Nordic Countries Renewable Energy Market Revenue Million Forecast, by Country 2019 & 2032
- Table 110: Nordic Countries Renewable Energy Market Volume gigawatt Forecast, by Country 2019 & 2032
- Table 111: Nordic Countries Renewable Energy Market Revenue Million Forecast, by Type 2019 & 2032
- Table 112: Nordic Countries Renewable Energy Market Volume gigawatt Forecast, by Type 2019 & 2032
- Table 113: Nordic Countries Renewable Energy Market Revenue Million Forecast, by Geography 2019 & 2032
- Table 114: Nordic Countries Renewable Energy Market Volume gigawatt Forecast, by Geography 2019 & 2032
- Table 115: Nordic Countries Renewable Energy Market Revenue Million Forecast, by Country 2019 & 2032
- Table 116: Nordic Countries Renewable Energy Market Volume gigawatt Forecast, by Country 2019 & 2032
- Table 117: Nordic Countries Renewable Energy Market Revenue Million Forecast, by Type 2019 & 2032
- Table 118: Nordic Countries Renewable Energy Market Volume gigawatt Forecast, by Type 2019 & 2032
- Table 119: Nordic Countries Renewable Energy Market Revenue Million Forecast, by Geography 2019 & 2032
- Table 120: Nordic Countries Renewable Energy Market Volume gigawatt Forecast, by Geography 2019 & 2032
- Table 121: Nordic Countries Renewable Energy Market Revenue Million Forecast, by Country 2019 & 2032
- Table 122: Nordic Countries Renewable Energy Market Volume gigawatt Forecast, by Country 2019 & 2032
Frequently Asked Questions
1. What is the projected Compound Annual Growth Rate (CAGR) of the Nordic Countries Renewable Energy Market?
The projected CAGR is approximately > 5.00%.
2. Which companies are prominent players in the Nordic Countries Renewable Energy Market?
Key companies in the market include Svea Renewable Solar AB*List Not Exhaustive, Vattenfall AB, Fortum Oyj, RES Group, Siemens Gamesa Renewable Energy SA, Swedish Biofuels AB, InnoVentum AB, Axpo Holding AG, General Electric Company.
3. What are the main segments of the Nordic Countries Renewable Energy Market?
The market segments include Type, Geography.
4. Can you provide details about the market size?
The market size is estimated to be USD XX Million as of 2022.
5. What are some drivers contributing to market growth?
4.; Growing Penetration of the Technology in Long-Duration Energy Storage Applications4.; Increasing Adoption of Renewable Energy.
6. What are the notable trends driving market growth?
Hydro-based Electricity Generation is Expected to Dominate the Market.
7. Are there any restraints impacting market growth?
4.; Low Energy of Battery Cells.
8. Can you provide examples of recent developments in the market?
October 2022: Enlight Renewable Energy Ltd., an Israeli renewable energy developer, announced the start of commercial production on the first of 60 wind turbines that compose the 372-MW Bjornberget wind farm in Sweden. The wind farm uses Siemens Gamesa 6.2-MW turbines.
9. What pricing options are available for accessing the report?
Pricing options include single-user, multi-user, and enterprise licenses priced at USD 4750, USD 5250, and USD 8750 respectively.
10. Is the market size provided in terms of value or volume?
The market size is provided in terms of value, measured in Million and volume, measured in gigawatt.
11. Are there any specific market keywords associated with the report?
Yes, the market keyword associated with the report is "Nordic Countries Renewable Energy Market," which aids in identifying and referencing the specific market segment covered.
12. How do I determine which pricing option suits my needs best?
The pricing options vary based on user requirements and access needs. Individual users may opt for single-user licenses, while businesses requiring broader access may choose multi-user or enterprise licenses for cost-effective access to the report.
13. Are there any additional resources or data provided in the Nordic Countries Renewable Energy Market report?
While the report offers comprehensive insights, it's advisable to review the specific contents or supplementary materials provided to ascertain if additional resources or data are available.
14. How can I stay updated on further developments or reports in the Nordic Countries Renewable Energy Market?
To stay informed about further developments, trends, and reports in the Nordic Countries Renewable Energy Market, consider subscribing to industry newsletters, following relevant companies and organizations, or regularly checking reputable industry news sources and publications.
Methodology
Step 1 - Identification of Relevant Samples Size from Population Database


Step 2 - Approaches for Defining Global Market Size (Value, Volume* & Price*)

Note*: In applicable scenarios
Step 3 - Data Sources
Primary Research
- Web Analytics
- Survey Reports
- Research Institute
- Latest Research Reports
- Opinion Leaders
Secondary Research
- Annual Reports
- White Paper
- Latest Press Release
- Industry Association
- Paid Database
- Investor Presentations

Step 4 - Data Triangulation
Involves using different sources of information in order to increase the validity of a study
These sources are likely to be stakeholders in a program - participants, other researchers, program staff, other community members, and so on.
Then we put all data in single framework & apply various statistical tools to find out the dynamic on the market.
During the analysis stage, feedback from the stakeholder groups would be compared to determine areas of agreement as well as areas of divergence


