
Key Insights
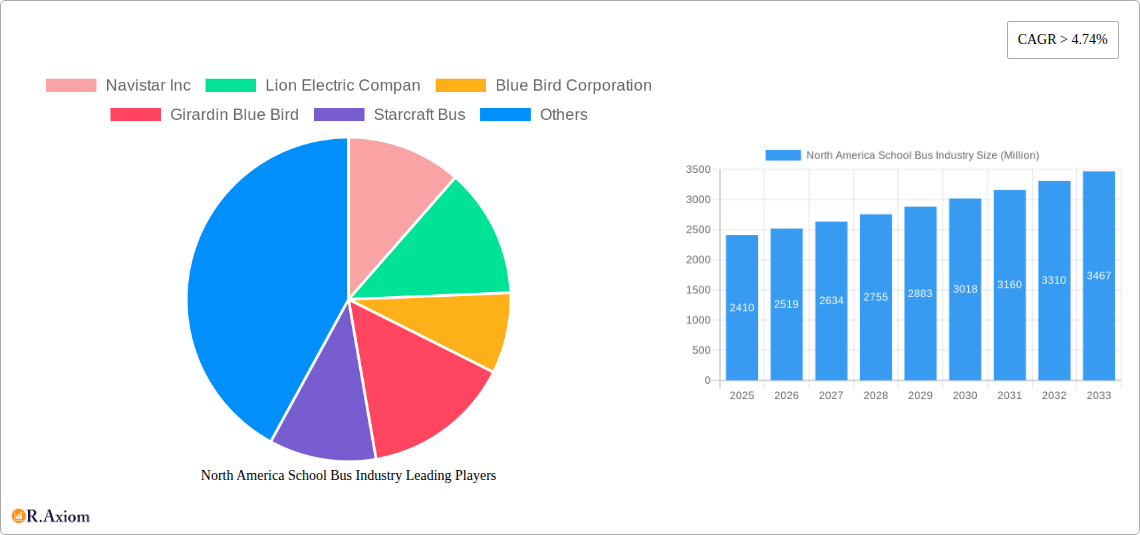
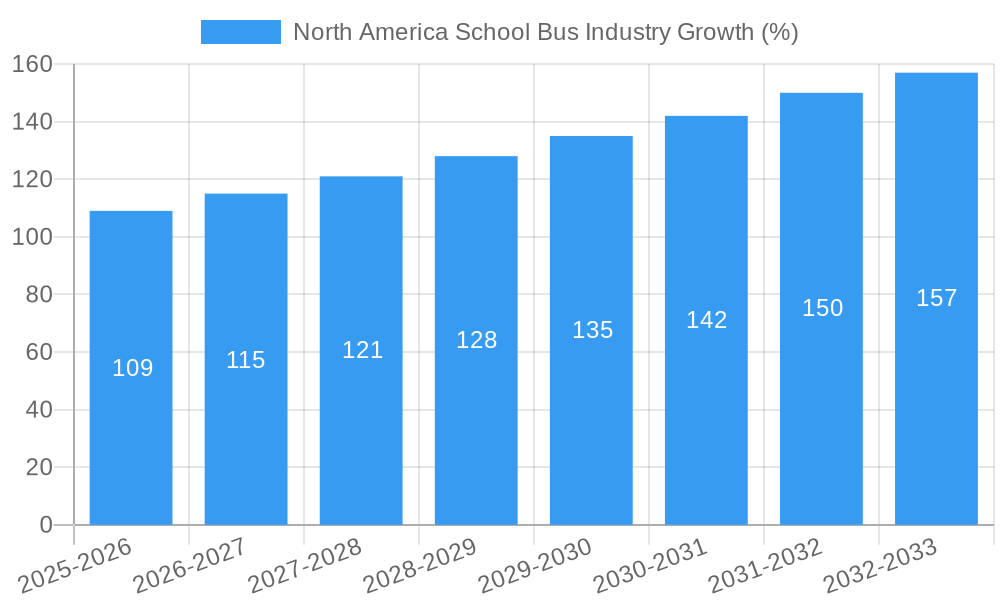
The North American school bus industry, valued at $2.41 billion in 2025, is projected to experience robust growth, with a compound annual growth rate (CAGR) exceeding 4.74% from 2025 to 2033. This expansion is driven by several key factors. Increased student enrollment in many regions fuels demand for more buses. Furthermore, a growing emphasis on student safety and comfort is prompting school districts to invest in newer, more technologically advanced vehicles, including those with enhanced safety features and improved fuel efficiency. The transition towards electric and alternative fuel school buses is also a significant trend, influenced by environmental concerns and government incentives aimed at reducing emissions. This shift, however, presents challenges, with electric buses often commanding higher initial purchase prices compared to traditional internal combustion engine (ICE) buses. The industry is segmented by powertrain (ICE, electric) and bus type (Type C, Type D, other), with Type C and D buses dominating the market. Key players like Navistar Inc., Lion Electric Co., Blue Bird Corporation, and Daimler AG (Thomas Built Buses) are actively competing in this dynamic landscape, innovating to meet evolving demands and regulatory requirements. Geographic variations exist within North America, with the United States representing the largest market share, followed by Canada and Mexico. While the growth outlook is positive, potential restraints include fluctuating fuel prices, economic downturns impacting school district budgets, and the complexities associated with the large-scale adoption of electric bus infrastructure.
The competitive landscape is marked by both established manufacturers and emerging electric vehicle players. Established companies leverage their extensive experience and distribution networks, while new entrants bring innovative electric and alternative fuel technologies. Future market growth will depend on several factors, including the continued adoption of electric buses, government support for green initiatives, the overall economic climate, and demographic trends impacting student population numbers. The industry's ability to adapt to technological advancements and address sustainability concerns will play a crucial role in shaping its future trajectory. The forecast period of 2025-2033 presents significant opportunities for companies that can effectively navigate these challenges and capitalize on emerging trends. Strategic partnerships, technological innovation, and a focus on customer needs will be critical for success in this dynamic market.
This comprehensive report provides an in-depth analysis of the North America school bus industry, covering market size, segmentation, growth drivers, challenges, and key players. The study period spans from 2019 to 2033, with 2025 serving as the base and estimated year. This report is crucial for industry stakeholders, investors, and strategic decision-makers seeking actionable insights into this dynamic sector.
North America School Bus Industry Market Concentration & Innovation
The North American school bus industry exhibits a moderately concentrated market structure, with several major players holding significant market share. While precise figures are proprietary, companies like Blue Bird Corporation, Thomas Built Buses (Daimler AG), and Lion Electric Company are prominent leaders, commanding a combined xx% of the market in 2025. However, the presence of several smaller regional players and emerging electric vehicle manufacturers indicates a dynamic competitive landscape. Innovation is driven by stringent emission regulations, increasing demand for fuel efficiency, and a growing focus on safety features. Recent mergers and acquisitions (M&A) activity, though not reaching billions in value for individual deals, reflects ongoing consolidation and strategic expansion in the sector. For example, Lion Electric Company's acquisition of a provisional order for 50 electric buses illustrates strategic partnerships shaping the market. Regulatory frameworks, particularly those focusing on emissions and safety standards, heavily influence industry development. The emergence of electric buses presents a significant technological disruption, driving the need for improved charging infrastructure and battery technology. Substitutes, while limited, include other forms of student transportation, which are constrained by logistical and cost factors. End-user trends increasingly favor electric buses due to environmental concerns and potential long-term cost savings.
North America School Bus Industry Industry Trends & Insights
The North American school bus industry is experiencing significant transformation, driven by the increasing adoption of electric vehicles and evolving safety regulations. The market is projected to witness a CAGR of xx% during the forecast period (2025-2033). This growth is fueled by several factors: the growing awareness of environmental sustainability, government incentives promoting electric vehicle adoption (reaching xx Million in incentives by 2033), and increasing concerns about student safety. Technological disruptions, primarily the transition from internal combustion engines to electric powertrains, are reshaping the industry's dynamics. Consumer preferences are shifting towards safer, more environmentally friendly, and technologically advanced buses. The competitive dynamics are intense, with established players facing competition from both new entrants and innovative technology providers. Market penetration of electric buses is increasing rapidly, with a projected xx% market share by 2033, mainly driven by increasing demand and government initiatives.
Dominant Markets & Segments in North America School Bus Industry
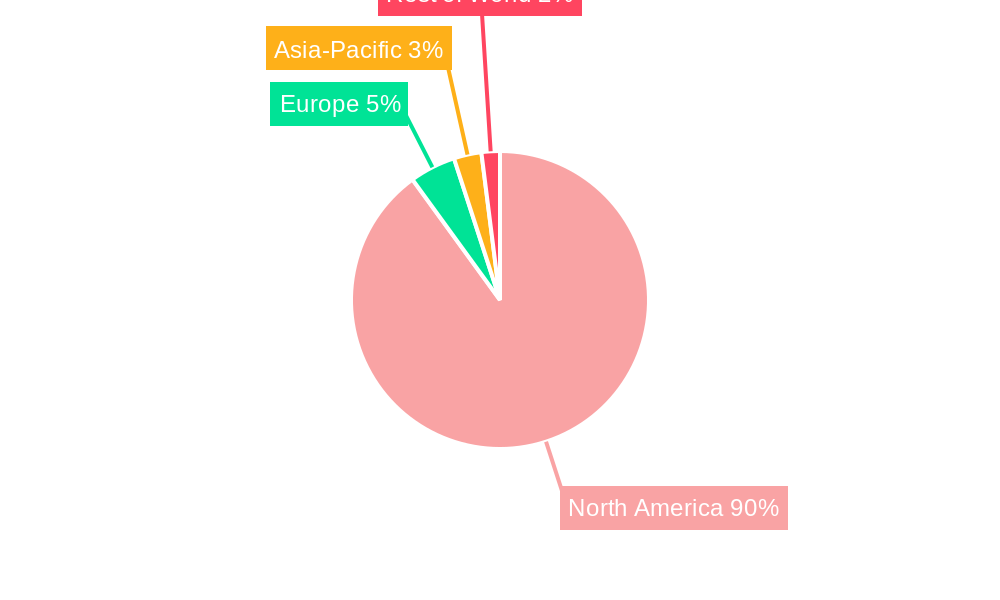
Dominant Region: The largest market for school buses in North America remains the United States, driven by its large student population and extensive school bus transportation systems. Canada follows as a significant market.
Dominant Segment (Powertrain): While Internal Combustion Engines (ICE) still hold a larger market share in 2025, the Electric segment is the fastest-growing powertrain type. The rapid technological advancements in battery technology and increasing government support are driving this trend.
Dominant Segment (Bus Type): Type C and Type D buses dominate the market, accounting for xx% and xx% respectively in 2025. These represent the standard sizes utilized for most school transportation requirements. Other types comprise a smaller niche segment.
Key Drivers:
- Government Regulations: Stringent emission standards and safety regulations are driving the adoption of electric buses and advanced safety technologies.
- Economic Factors: Government subsidies, tax incentives, and lower operating costs associated with electric buses are stimulating market growth.
- Infrastructure Development: Investments in charging infrastructure are essential for the widespread adoption of electric school buses.
The dominance of the United States market stems from its larger population and higher spending on education. The rapid shift towards electric powertrains presents an exciting growth opportunity, driven primarily by environmental concerns and potentially lower lifetime costs despite higher initial investment.
North America School Bus Industry Product Developments
The school bus industry is witnessing significant product innovation focused on electrification, enhanced safety features, and improved fuel efficiency. Electric school buses with extended range and improved charging times are gaining traction. Advanced driver-assistance systems (ADAS) and improved safety technologies, such as improved braking systems and enhanced seatbelts, are being incorporated into newer models. These innovations are primarily driven by the need to meet evolving safety standards and address environmental concerns. The market fit for these innovative products is strong, aligning with growing governmental mandates and consumer preferences.
Report Scope & Segmentation Analysis
This report segments the North American school bus market based on powertrain (IC Engine, Electric) and bus type (Type C, Type D, Other Types). Each segment is analyzed for its market size, growth projections, and competitive landscape. The Electric segment shows considerable growth potential, with projections indicating a significant market share by 2033. The Type C and Type D bus segments remain dominant. Competitive dynamics vary by segment, with both established and new players competing across the different powertrain and bus type categories. The "Other Types" segment represents specialized vehicles.
Key Drivers of North America School Bus Industry Growth
Several factors contribute to the growth of the North American school bus industry. Technological advancements, particularly in electric powertrain technology, are driving efficiency and sustainability. Government regulations promoting cleaner transportation and improved safety standards are pushing industry innovation. Economic factors, including government incentives and potential long-term cost savings associated with electric buses, are also contributing to market growth. This combination of technological progress, regulatory pressures, and economic advantages is propelling expansion in this sector.
Challenges in the North America School Bus Industry Sector
The industry faces challenges such as high upfront costs associated with electric buses, the need for extensive charging infrastructure, and potential supply chain disruptions affecting component availability. Stringent regulatory compliance requirements can also impose significant costs. Furthermore, intense competition amongst existing players and new entrants can pressure profit margins. These factors collectively impact industry growth and profitability, posing hurdles to the sector's full potential.
Emerging Opportunities in North America School Bus Industry
The increasing demand for electric school buses creates significant opportunities for manufacturers and supporting industries. Technological advancements in battery technology and charging infrastructure present further opportunities for innovation and growth. Expanding into new markets and exploring opportunities to serve underserved communities can also unlock new revenue streams. Government initiatives focusing on cleaner transportation provide additional impetus for industry expansion and technological advancements.
Leading Players in the North America School Bus Industry Market
- Navistar Inc
- Lion Electric Company
- Blue Bird Corporation
- Girardin Blue Bird
- Starcraft Bus
- Trans Tech
- Collins Bus Corporation
- Daimler AG (Thomas Built Buses)
Key Developments in North America School Bus Industry Industry
- October 2023: Blue Bird delivered its 1,500th electric school bus and inaugurated its EV Build-up Center in Georgia, aiming for 5,000 annual electric bus production.
- November 2023: Lion Electric received a provisional order for 50 LionC all-electric school buses from Highland Electric Fleets.
- November 2022: Lion Electric produced its first zero-emission LionC school bus in Joliet, Illinois.
- October 2022: Thomas Built Buses delivered its 200th Proterra Powered Saf-T-Liner C2 Jouley electric school bus.
- March 2022: Thomas Built Buses and Highland Electric Fleets expanded their partnership to accelerate electric bus adoption.
These developments highlight the industry's rapid shift towards electric vehicles and the increasing focus on sustainable transportation solutions.
Strategic Outlook for North America School Bus Industry Market
The North American school bus industry is poised for continued growth, driven by the increasing adoption of electric vehicles and advancements in safety technology. The transition to electric powertrains presents significant opportunities for manufacturers, while investments in charging infrastructure will be crucial for widespread adoption. Government incentives and growing environmental awareness will continue to support this positive outlook. The industry's strategic focus on innovation, sustainability, and safety will shape its future trajectory.
North America School Bus Industry Segmentation
-
1. Powertrain
- 1.1. IC Engine
- 1.2. Electric
-
2. Bus Type
- 2.1. Type C
- 2.2. Type D
- 2.3. Other Types
-
3. Geography
- 3.1. United States
- 3.2. Canada
- 3.3. Rest of North America
North America School Bus Industry Segmentation By Geography
- 1. United States
- 2. Canada
- 3. Rest of North America
North America School Bus Industry REPORT HIGHLIGHTS
| Aspects | Details |
|---|---|
| Study Period | 2019-2033 |
| Base Year | 2024 |
| Estimated Year | 2025 |
| Forecast Period | 2025-2033 |
| Historical Period | 2019-2024 |
| Growth Rate | CAGR of > 4.74% from 2019-2033 |
| Segmentation |
|
Table of Contents
- 1. Introduction
- 1.1. Research Scope
- 1.2. Market Segmentation
- 1.3. Research Methodology
- 1.4. Definitions and Assumptions
- 2. Executive Summary
- 2.1. Introduction
- 3. Market Dynamics
- 3.1. Introduction
- 3.2. Market Drivers
- 3.2.1. Increasing Demand For Electric School Buses
- 3.3. Market Restrains
- 3.3.1. Uncertainty of The Global Pandemic
- 3.4. Market Trends
- 3.4.1. The Industry’s Shift Toward the Adoption of Electric School Buses
- 4. Market Factor Analysis
- 4.1. Porters Five Forces
- 4.2. Supply/Value Chain
- 4.3. PESTEL analysis
- 4.4. Market Entropy
- 4.5. Patent/Trademark Analysis
- 5. North America School Bus Industry Analysis, Insights and Forecast, 2019-2031
- 5.1. Market Analysis, Insights and Forecast - by Powertrain
- 5.1.1. IC Engine
- 5.1.2. Electric
- 5.2. Market Analysis, Insights and Forecast - by Bus Type
- 5.2.1. Type C
- 5.2.2. Type D
- 5.2.3. Other Types
- 5.3. Market Analysis, Insights and Forecast - by Geography
- 5.3.1. United States
- 5.3.2. Canada
- 5.3.3. Rest of North America
- 5.4. Market Analysis, Insights and Forecast - by Region
- 5.4.1. United States
- 5.4.2. Canada
- 5.4.3. Rest of North America
- 5.1. Market Analysis, Insights and Forecast - by Powertrain
- 6. United States North America School Bus Industry Analysis, Insights and Forecast, 2019-2031
- 6.1. Market Analysis, Insights and Forecast - by Powertrain
- 6.1.1. IC Engine
- 6.1.2. Electric
- 6.2. Market Analysis, Insights and Forecast - by Bus Type
- 6.2.1. Type C
- 6.2.2. Type D
- 6.2.3. Other Types
- 6.3. Market Analysis, Insights and Forecast - by Geography
- 6.3.1. United States
- 6.3.2. Canada
- 6.3.3. Rest of North America
- 6.1. Market Analysis, Insights and Forecast - by Powertrain
- 7. Canada North America School Bus Industry Analysis, Insights and Forecast, 2019-2031
- 7.1. Market Analysis, Insights and Forecast - by Powertrain
- 7.1.1. IC Engine
- 7.1.2. Electric
- 7.2. Market Analysis, Insights and Forecast - by Bus Type
- 7.2.1. Type C
- 7.2.2. Type D
- 7.2.3. Other Types
- 7.3. Market Analysis, Insights and Forecast - by Geography
- 7.3.1. United States
- 7.3.2. Canada
- 7.3.3. Rest of North America
- 7.1. Market Analysis, Insights and Forecast - by Powertrain
- 8. Rest of North America North America School Bus Industry Analysis, Insights and Forecast, 2019-2031
- 8.1. Market Analysis, Insights and Forecast - by Powertrain
- 8.1.1. IC Engine
- 8.1.2. Electric
- 8.2. Market Analysis, Insights and Forecast - by Bus Type
- 8.2.1. Type C
- 8.2.2. Type D
- 8.2.3. Other Types
- 8.3. Market Analysis, Insights and Forecast - by Geography
- 8.3.1. United States
- 8.3.2. Canada
- 8.3.3. Rest of North America
- 8.1. Market Analysis, Insights and Forecast - by Powertrain
- 9. United States North America School Bus Industry Analysis, Insights and Forecast, 2019-2031
- 10. Canada North America School Bus Industry Analysis, Insights and Forecast, 2019-2031
- 11. Mexico North America School Bus Industry Analysis, Insights and Forecast, 2019-2031
- 12. Rest of North America North America School Bus Industry Analysis, Insights and Forecast, 2019-2031
- 13. Competitive Analysis
- 13.1. Market Share Analysis 2024
- 13.2. Company Profiles
- 13.2.1 Navistar Inc
- 13.2.1.1. Overview
- 13.2.1.2. Products
- 13.2.1.3. SWOT Analysis
- 13.2.1.4. Recent Developments
- 13.2.1.5. Financials (Based on Availability)
- 13.2.2 Lion Electric Compan
- 13.2.2.1. Overview
- 13.2.2.2. Products
- 13.2.2.3. SWOT Analysis
- 13.2.2.4. Recent Developments
- 13.2.2.5. Financials (Based on Availability)
- 13.2.3 Blue Bird Corporation
- 13.2.3.1. Overview
- 13.2.3.2. Products
- 13.2.3.3. SWOT Analysis
- 13.2.3.4. Recent Developments
- 13.2.3.5. Financials (Based on Availability)
- 13.2.4 Girardin Blue Bird
- 13.2.4.1. Overview
- 13.2.4.2. Products
- 13.2.4.3. SWOT Analysis
- 13.2.4.4. Recent Developments
- 13.2.4.5. Financials (Based on Availability)
- 13.2.5 Starcraft Bus
- 13.2.5.1. Overview
- 13.2.5.2. Products
- 13.2.5.3. SWOT Analysis
- 13.2.5.4. Recent Developments
- 13.2.5.5. Financials (Based on Availability)
- 13.2.6 Trans Tech
- 13.2.6.1. Overview
- 13.2.6.2. Products
- 13.2.6.3. SWOT Analysis
- 13.2.6.4. Recent Developments
- 13.2.6.5. Financials (Based on Availability)
- 13.2.7 Collins Bus Corporation
- 13.2.7.1. Overview
- 13.2.7.2. Products
- 13.2.7.3. SWOT Analysis
- 13.2.7.4. Recent Developments
- 13.2.7.5. Financials (Based on Availability)
- 13.2.8 Daimler AG (Thomas Built Buses)
- 13.2.8.1. Overview
- 13.2.8.2. Products
- 13.2.8.3. SWOT Analysis
- 13.2.8.4. Recent Developments
- 13.2.8.5. Financials (Based on Availability)
- 13.2.1 Navistar Inc
List of Figures
- Figure 1: North America School Bus Industry Revenue Breakdown (Million, %) by Product 2024 & 2032
- Figure 2: North America School Bus Industry Share (%) by Company 2024
List of Tables
- Table 1: North America School Bus Industry Revenue Million Forecast, by Region 2019 & 2032
- Table 2: North America School Bus Industry Revenue Million Forecast, by Powertrain 2019 & 2032
- Table 3: North America School Bus Industry Revenue Million Forecast, by Bus Type 2019 & 2032
- Table 4: North America School Bus Industry Revenue Million Forecast, by Geography 2019 & 2032
- Table 5: North America School Bus Industry Revenue Million Forecast, by Region 2019 & 2032
- Table 6: North America School Bus Industry Revenue Million Forecast, by Country 2019 & 2032
- Table 7: United States North America School Bus Industry Revenue (Million) Forecast, by Application 2019 & 2032
- Table 8: Canada North America School Bus Industry Revenue (Million) Forecast, by Application 2019 & 2032
- Table 9: Mexico North America School Bus Industry Revenue (Million) Forecast, by Application 2019 & 2032
- Table 10: Rest of North America North America School Bus Industry Revenue (Million) Forecast, by Application 2019 & 2032
- Table 11: North America School Bus Industry Revenue Million Forecast, by Powertrain 2019 & 2032
- Table 12: North America School Bus Industry Revenue Million Forecast, by Bus Type 2019 & 2032
- Table 13: North America School Bus Industry Revenue Million Forecast, by Geography 2019 & 2032
- Table 14: North America School Bus Industry Revenue Million Forecast, by Country 2019 & 2032
- Table 15: North America School Bus Industry Revenue Million Forecast, by Powertrain 2019 & 2032
- Table 16: North America School Bus Industry Revenue Million Forecast, by Bus Type 2019 & 2032
- Table 17: North America School Bus Industry Revenue Million Forecast, by Geography 2019 & 2032
- Table 18: North America School Bus Industry Revenue Million Forecast, by Country 2019 & 2032
- Table 19: North America School Bus Industry Revenue Million Forecast, by Powertrain 2019 & 2032
- Table 20: North America School Bus Industry Revenue Million Forecast, by Bus Type 2019 & 2032
- Table 21: North America School Bus Industry Revenue Million Forecast, by Geography 2019 & 2032
- Table 22: North America School Bus Industry Revenue Million Forecast, by Country 2019 & 2032
Frequently Asked Questions
1. What is the projected Compound Annual Growth Rate (CAGR) of the North America School Bus Industry?
The projected CAGR is approximately > 4.74%.
2. Which companies are prominent players in the North America School Bus Industry?
Key companies in the market include Navistar Inc, Lion Electric Compan, Blue Bird Corporation, Girardin Blue Bird, Starcraft Bus, Trans Tech, Collins Bus Corporation, Daimler AG (Thomas Built Buses).
3. What are the main segments of the North America School Bus Industry?
The market segments include Powertrain, Bus Type, Geography.
4. Can you provide details about the market size?
The market size is estimated to be USD 2.41 Million as of 2022.
5. What are some drivers contributing to market growth?
Increasing Demand For Electric School Buses.
6. What are the notable trends driving market growth?
The Industry’s Shift Toward the Adoption of Electric School Buses.
7. Are there any restraints impacting market growth?
Uncertainty of The Global Pandemic.
8. Can you provide examples of recent developments in the market?
October 2023: Blue Bird achieved a milestone by delivering its 1,500th electric, zero-emission school bus to Modesto City Schools in California. Recently, the company marked the inauguration of its Electric Vehicle (EV) Build-up Center in Georgia, aiming to boost its long-term production capacity to 5,000 electric school buses annually. This expansion underscores Blue Bird's commitment to advancing zero-emission school buses.
9. What pricing options are available for accessing the report?
Pricing options include single-user, multi-user, and enterprise licenses priced at USD 4750, USD 5250, and USD 8750 respectively.
10. Is the market size provided in terms of value or volume?
The market size is provided in terms of value, measured in Million.
11. Are there any specific market keywords associated with the report?
Yes, the market keyword associated with the report is "North America School Bus Industry," which aids in identifying and referencing the specific market segment covered.
12. How do I determine which pricing option suits my needs best?
The pricing options vary based on user requirements and access needs. Individual users may opt for single-user licenses, while businesses requiring broader access may choose multi-user or enterprise licenses for cost-effective access to the report.
13. Are there any additional resources or data provided in the North America School Bus Industry report?
While the report offers comprehensive insights, it's advisable to review the specific contents or supplementary materials provided to ascertain if additional resources or data are available.
14. How can I stay updated on further developments or reports in the North America School Bus Industry?
To stay informed about further developments, trends, and reports in the North America School Bus Industry, consider subscribing to industry newsletters, following relevant companies and organizations, or regularly checking reputable industry news sources and publications.
Methodology
Step 1 - Identification of Relevant Samples Size from Population Database


Step 2 - Approaches for Defining Global Market Size (Value, Volume* & Price*)

Note*: In applicable scenarios
Step 3 - Data Sources
Primary Research
- Web Analytics
- Survey Reports
- Research Institute
- Latest Research Reports
- Opinion Leaders
Secondary Research
- Annual Reports
- White Paper
- Latest Press Release
- Industry Association
- Paid Database
- Investor Presentations

Step 4 - Data Triangulation
Involves using different sources of information in order to increase the validity of a study
These sources are likely to be stakeholders in a program - participants, other researchers, program staff, other community members, and so on.
Then we put all data in single framework & apply various statistical tools to find out the dynamic on the market.
During the analysis stage, feedback from the stakeholder groups would be compared to determine areas of agreement as well as areas of divergence


