

Key Insights
The North America soft drinks packaging market, projected to reach $42.16 billion by 2025, is poised for significant expansion. This growth is primarily fueled by escalating consumer demand for convenient, on-the-go beverage options and a strong preference for sustainable packaging solutions. While plastic packaging maintains its dominance due to cost-effectiveness and versatility, increasing environmental awareness is driving a notable shift towards eco-friendly alternatives, including paperboard and glass, particularly for bottled water and juices. This transition is further supported by stringent government regulations focused on reducing plastic waste and promoting recycling initiatives. Innovative packaging designs that prioritize enhanced functionality, tamper-evidence, and extended shelf life are also gaining traction, especially within the Ready-to-Drink (RTD) beverage sector. Leading industry players are actively investing in research and development to meet these evolving consumer and regulatory expectations, fostering a competitive environment characterized by strategic mergers, acquisitions, and the introduction of advanced packaging technologies.
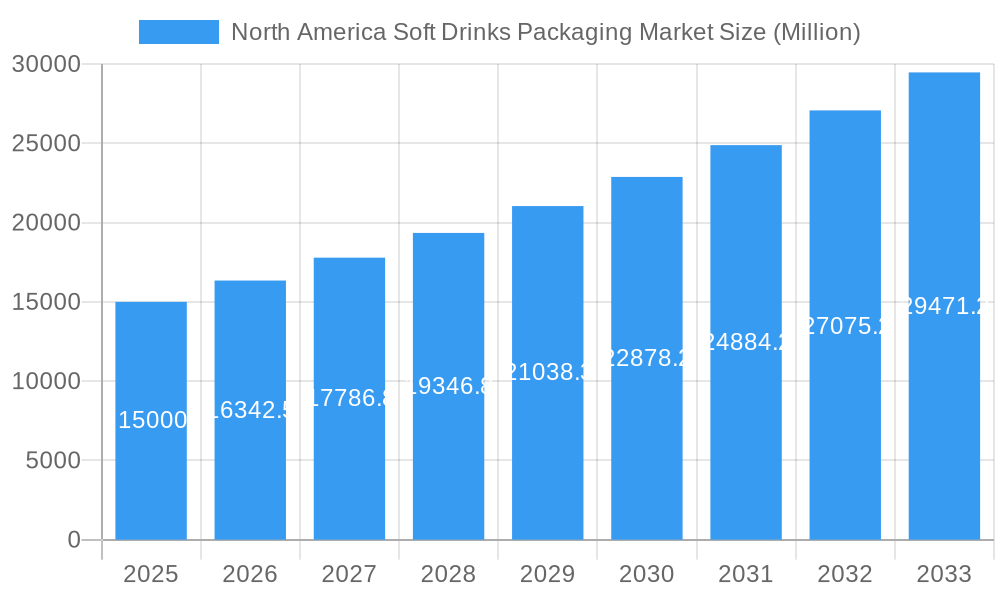
North America Soft Drinks Packaging Market Market Size (In Billion)
The market is anticipated to grow at a Compound Annual Growth Rate (CAGR) of 6.57% from the base year 2025 through the forecast period. This robust growth trajectory is particularly evident in the premium beverage segment, where the increasing popularity of functional drinks and premiumization trends are boosting demand for sophisticated packaging that elevates product perceived value. Key challenges include fluctuating raw material prices, particularly for plastics and paperboard, and logistical constraints or supply chain disruptions. Nevertheless, continuous innovation in packaging technologies, coupled with strategic collaborations between packaging manufacturers and beverage producers, is expected to drive market growth, presenting substantial opportunities in the sustainable and functional beverage packaging segments.
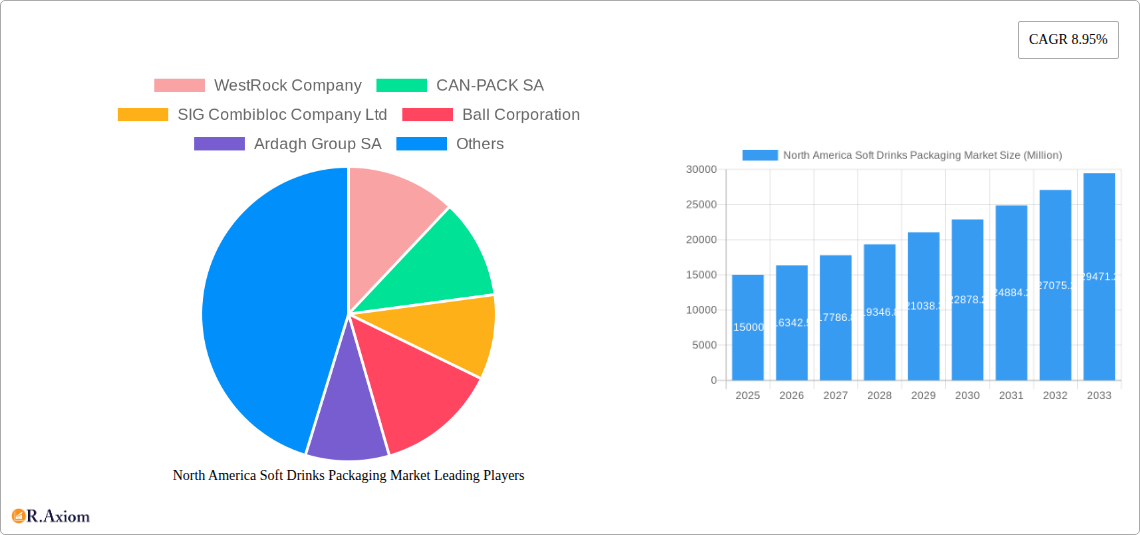
North America Soft Drinks Packaging Market Company Market Share
This comprehensive report analyzes the North America soft drinks packaging market, detailing market size, segmentation, growth drivers, challenges, key players, and future projections. The study encompasses the period from 2019 to 2033, with 2025 designated as the base year. This report serves as a vital resource for industry stakeholders, investors, and strategic decision-makers seeking in-depth insights into this evolving market.
North America Soft Drinks Packaging Market Market Concentration & Innovation
The North America soft drinks packaging market exhibits a moderately concentrated structure, with several large multinational companies holding significant market share. Key players like WestRock Company, Ball Corporation, Amcor Ltd, and Crown Holdings Inc. dominate the landscape, leveraging their extensive production capabilities and established distribution networks. However, smaller niche players also contribute significantly, particularly in specialized packaging segments. The market share of the top 5 players is estimated to be around xx%.
Market innovation is primarily driven by consumer demand for sustainable and convenient packaging solutions. This is leading to increased adoption of lightweighting technologies, eco-friendly materials (such as recycled plastics and plant-based materials), and innovative designs that enhance product shelf life and appeal. Stricter environmental regulations are further pushing the industry towards more sustainable packaging options.
Mergers and acquisitions (M&A) activities have been moderate in recent years. For example, Amcor's investment in ePac flexible packaging exemplifies the strategic focus on enhancing digital printing capabilities and expanding into the short-run flexible packaging segment. The estimated value of M&A deals in the last five years was around xx Million. Other factors driving innovation include advancements in barrier technology, improved printing techniques, and the integration of smart packaging features.
- Market Concentration: Moderate, with a few dominant players.
- Innovation Drivers: Sustainability concerns, consumer preferences, and regulatory pressures.
- M&A Activity: Moderate, focused on expanding capabilities and market reach.
- Regulatory Framework: Increasingly stringent environmental regulations.
- Product Substitutes: Limited, with the primary substitutes being alternative packaging materials for specific product types.
- End-User Trends: Growing preference for convenience, sustainability, and premium packaging.
North America Soft Drinks Packaging Market Industry Trends & Insights
The North America soft drinks packaging market is experiencing robust growth, fueled by increasing soft drink consumption, particularly in ready-to-drink (RTD) beverages and bottled water. The market is projected to register a CAGR of xx% during the forecast period (2025-2033). This growth is driven by several factors, including changing consumer lifestyles, rising disposable incomes, and the increasing popularity of on-the-go consumption.
Technological advancements are also transforming the market. The adoption of lightweighting technologies, such as thin-wall plastics and lightweight aluminum cans, is reducing packaging costs and environmental impact. Furthermore, advancements in printing and labeling technologies are enabling more sophisticated and visually appealing packaging designs. The market penetration of sustainable packaging solutions is gradually increasing, though challenges remain in terms of cost and scalability. The competitive landscape is highly dynamic, with both established players and new entrants constantly vying for market share. This intense competition is leading to product innovations, price reductions, and improved packaging solutions for consumers.
Dominant Markets & Segments in North America Soft Drinks Packaging Market
The United States is the largest market for soft drinks packaging in North America, accounting for approximately xx% of the total market value. This dominance is primarily attributed to a large and mature soft drinks industry, strong consumer demand, and well-established distribution networks. Canada and Mexico are significant secondary markets.
Dominant Packaging Material Types:
- Plastic: Holds the largest market share due to its cost-effectiveness, versatility, and lightweight nature. However, environmental concerns are impacting its long-term growth prospects.
- Paper and Paperboard: Growing steadily due to the increasing demand for sustainable packaging options. Carton packaging is particularly popular for juices and RTD beverages.
- Metal: Aluminum cans maintain a strong market position, particularly for carbonated drinks, owing to their recyclability and protective properties.
- Glass: Retains a niche market segment, primarily for premium beverages, driven by its perceived quality and recyclability.
- Other Materials: This includes materials like bioplastics and composite materials; this segment shows potential for future growth, given the ongoing focus on sustainability.
Dominant Product Types:
- Bottled Water: This is the fastest-growing segment, driven by increasing health consciousness and convenience.
- Carbonated Drinks: Maintains a significant market share, although growth is slower than bottled water due to increasing health concerns.
- RTD Beverages: This segment is experiencing robust growth, with the increased popularity of functional beverages and premium ready-to-drink options.
- Juices: Remains a substantial segment, though growth is relatively stable.
- Sports Drinks: This is experiencing moderate growth, driven by the increasing popularity of fitness and sports activities.
North America Soft Drinks Packaging Market Product Developments
Recent product innovations focus on sustainability, convenience, and enhanced product protection. Lightweighting technologies are key, alongside the development of bio-based and recycled materials. Improved barrier properties ensure longer shelf life, while smart packaging solutions are enhancing consumer engagement and traceability. The overall trend is towards more sustainable, functional, and consumer-friendly packaging solutions that offer a competitive advantage in a crowded marketplace.
Report Scope & Segmentation Analysis
This report segments the North America soft drinks packaging market based on packaging material type (plastic, paper and paperboard, glass, metal, other materials) and product type (bottled water, carbonated drinks, juices, RTD beverages, sports drinks, other product types). Each segment is analyzed in detail, including market size, growth projections, and competitive dynamics. The report also examines regional variations across North America.
Key Drivers of North America Soft Drinks Packaging Market Growth
The North America soft drinks packaging market is propelled by several key drivers:
- Rising Soft Drink Consumption: The continued popularity of various soft drinks is a major factor in the market's growth.
- Technological Advancements: Innovations in packaging materials and manufacturing processes are creating more efficient and sustainable solutions.
- Evolving Consumer Preferences: Consumers increasingly seek convenience and environmentally friendly options.
- Favorable Economic Conditions: Economic growth in various regions fuels higher disposable income and increased consumption.
Challenges in the North America Soft Drinks Packaging Market Sector
Several factors hinder market growth, including:
- Fluctuating Raw Material Prices: Changes in the cost of raw materials (plastic, aluminum, paper) significantly impact profitability.
- Stringent Environmental Regulations: Compliance with ever-stricter regulations can increase production costs.
- Intense Competition: The market is highly competitive, with significant players constantly innovating and seeking new markets.
Emerging Opportunities in North America Soft Drinks Packaging Market
Emerging opportunities include:
- Sustainable Packaging Solutions: The market offers immense potential for eco-friendly options and innovations.
- Smart Packaging Technologies: Integration of smart features enhances consumer engagement and product traceability.
- Growth in E-commerce: The expanding e-commerce sector necessitates packaging innovations for safe and efficient online delivery.
Leading Players in the North America Soft Drinks Packaging Market Market
- WestRock Company
- CAN-PACK SA
- SIG Combibloc Company Ltd
- Ball Corporation
- Ardagh Group SA
- Alcoa Corporation
- Crown Holdings Inc
- Graham Packaging Company
- Tetra Pak International
- The Scoular Company
- Toyo Seikan Group Holdings Ltd
- Pactive LLC
- Placon Corporation
- Genpak LLC
- Owens-Illinois Inc
- Amcor Ltd
Key Developments in North America Soft Drinks Packaging Market Industry
- May 2021: Ball Corporation launched its Ball Aluminum Cup for soft drinks, expanding into a new market segment.
- April 2021: Amcor invested in ePac flexible packaging, strengthening its position in the digital printing segment.
Strategic Outlook for North America Soft Drinks Packaging Market Market
The North America soft drinks packaging market is poised for sustained growth, driven by increasing demand, technological innovation, and a shift towards sustainable packaging solutions. Companies that embrace sustainability, invest in R&D, and adapt to changing consumer preferences are likely to thrive in this dynamic and competitive market. The focus on lightweighting, eco-friendly materials, and smart packaging technologies will shape the future landscape.
North America Soft Drinks Packaging Market Segmentation
-
1. Packaging Material Type
- 1.1. Plastic
- 1.2. Paper and Paperboard
- 1.3. Glass
- 1.4. Metal
- 1.5. Other Materials
-
2. Product Type
- 2.1. Bottled Water
- 2.2. Carbonated Drinks
- 2.3. Juices
- 2.4. RTD Beverages
- 2.5. Sports Drinks
- 2.6. Other Product Types
-
3. Geography
- 3.1. United States
- 3.2. Canada
North America Soft Drinks Packaging Market Segmentation By Geography
- 1. United States
- 2. Canada
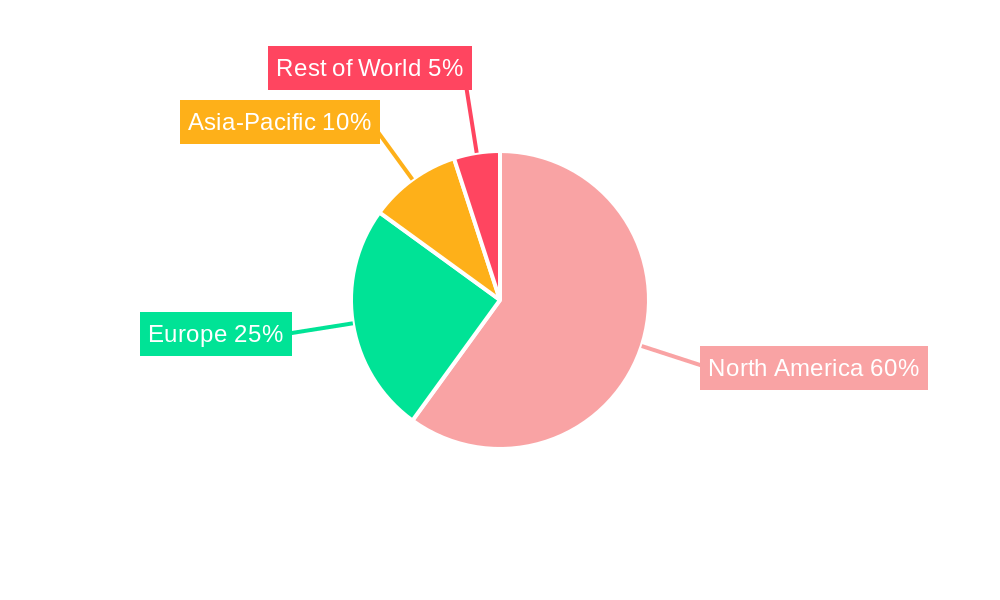
North America Soft Drinks Packaging Market Regional Market Share
Geographic Coverage of North America Soft Drinks Packaging Market
North America Soft Drinks Packaging Market REPORT HIGHLIGHTS
| Aspects | Details |
|---|---|
| Study Period | 2020-2034 |
| Base Year | 2025 |
| Estimated Year | 2026 |
| Forecast Period | 2026-2034 |
| Historical Period | 2020-2025 |
| Growth Rate | CAGR of 6.57% from 2020-2034 |
| Segmentation |
|
Table of Contents
- 1. Introduction
- 1.1. Research Scope
- 1.2. Market Segmentation
- 1.3. Research Objective
- 1.4. Definitions and Assumptions
- 2. Executive Summary
- 2.1. Market Snapshot
- 3. Market Dynamics
- 3.1. Market Drivers
- 3.2. Market Restrains
- 3.3. Market Trends
- 3.4. Market Opportunities
- 4. Market Factor Analysis
- 4.1. Porters Five Forces
- 4.1.1. Bargaining Power of Suppliers
- 4.1.2. Bargaining Power of Buyers
- 4.1.3. Threat of New Entrants
- 4.1.4. Threat of Substitutes
- 4.1.5. Competitive Rivalry
- 4.2. PESTEL analysis
- 4.3. BCG Analysis
- 4.3.1. Stars (High Growth, High Market Share)
- 4.3.2. Cash Cows (Low Growth, High Market Share)
- 4.3.3. Question Mark (High Growth, Low Market Share)
- 4.3.4. Dogs (Low Growth, Low Market Share)
- 4.4. Ansoff Matrix Analysis
- 4.5. Supply Chain Analysis
- 4.6. Regulatory Landscape
- 4.7. Current Market Potential and Opportunity Assessment (TAM–SAM–SOM Framework)
- 4.8. RAX Analyst Note
- 4.1. Porters Five Forces
- 5. Market Analysis, Insights and Forecast 2021-2033
- 5.1. Market Analysis, Insights and Forecast - by Packaging Material Type
- 5.1.1. Plastic
- 5.1.2. Paper and Paperboard
- 5.1.3. Glass
- 5.1.4. Metal
- 5.1.5. Other Materials
- 5.2. Market Analysis, Insights and Forecast - by Product Type
- 5.2.1. Bottled Water
- 5.2.2. Carbonated Drinks
- 5.2.3. Juices
- 5.2.4. RTD Beverages
- 5.2.5. Sports Drinks
- 5.2.6. Other Product Types
- 5.3. Market Analysis, Insights and Forecast - by Geography
- 5.3.1. United States
- 5.3.2. Canada
- 5.4. Market Analysis, Insights and Forecast - by Region
- 5.4.1. United States
- 5.4.2. Canada
- 5.1. Market Analysis, Insights and Forecast - by Packaging Material Type
- 6. North America Soft Drinks Packaging Market Analysis, Insights and Forecast, 2021-2033
- 6.1. Market Analysis, Insights and Forecast - by Packaging Material Type
- 6.1.1. Plastic
- 6.1.2. Paper and Paperboard
- 6.1.3. Glass
- 6.1.4. Metal
- 6.1.5. Other Materials
- 6.2. Market Analysis, Insights and Forecast - by Product Type
- 6.2.1. Bottled Water
- 6.2.2. Carbonated Drinks
- 6.2.3. Juices
- 6.2.4. RTD Beverages
- 6.2.5. Sports Drinks
- 6.2.6. Other Product Types
- 6.3. Market Analysis, Insights and Forecast - by Geography
- 6.3.1. United States
- 6.3.2. Canada
- 6.1. Market Analysis, Insights and Forecast - by Packaging Material Type
- 7. United States North America Soft Drinks Packaging Market Analysis, Insights and Forecast, 2020-2032
- 7.1. Market Analysis, Insights and Forecast - by Packaging Material Type
- 7.1.1. Plastic
- 7.1.2. Paper and Paperboard
- 7.1.3. Glass
- 7.1.4. Metal
- 7.1.5. Other Materials
- 7.2. Market Analysis, Insights and Forecast - by Product Type
- 7.2.1. Bottled Water
- 7.2.2. Carbonated Drinks
- 7.2.3. Juices
- 7.2.4. RTD Beverages
- 7.2.5. Sports Drinks
- 7.2.6. Other Product Types
- 7.3. Market Analysis, Insights and Forecast - by Geography
- 7.3.1. United States
- 7.3.2. Canada
- 7.1. Market Analysis, Insights and Forecast - by Packaging Material Type
- 8. Canada North America Soft Drinks Packaging Market Analysis, Insights and Forecast, 2020-2032
- 8.1. Market Analysis, Insights and Forecast - by Packaging Material Type
- 8.1.1. Plastic
- 8.1.2. Paper and Paperboard
- 8.1.3. Glass
- 8.1.4. Metal
- 8.1.5. Other Materials
- 8.2. Market Analysis, Insights and Forecast - by Product Type
- 8.2.1. Bottled Water
- 8.2.2. Carbonated Drinks
- 8.2.3. Juices
- 8.2.4. RTD Beverages
- 8.2.5. Sports Drinks
- 8.2.6. Other Product Types
- 8.3. Market Analysis, Insights and Forecast - by Geography
- 8.3.1. United States
- 8.3.2. Canada
- 8.1. Market Analysis, Insights and Forecast - by Packaging Material Type
- 9. Competitive Analysis
- 9.1. Company Profiles
- 9.1.1 WestRock Company
- 9.1.1.1. Company Overview
- 9.1.1.2. Products
- 9.1.1.3. Company Financials
- 9.1.1.4. SWOT Analysis
- 9.1.2 CAN-PACK SA
- 9.1.2.1. Company Overview
- 9.1.2.2. Products
- 9.1.2.3. Company Financials
- 9.1.2.4. SWOT Analysis
- 9.1.3 SIG Combibloc Company Ltd
- 9.1.3.1. Company Overview
- 9.1.3.2. Products
- 9.1.3.3. Company Financials
- 9.1.3.4. SWOT Analysis
- 9.1.4 Ball Corporation
- 9.1.4.1. Company Overview
- 9.1.4.2. Products
- 9.1.4.3. Company Financials
- 9.1.4.4. SWOT Analysis
- 9.1.5 Ardagh Group SA
- 9.1.5.1. Company Overview
- 9.1.5.2. Products
- 9.1.5.3. Company Financials
- 9.1.5.4. SWOT Analysis
- 9.1.6 Alcoa Corporation*List Not Exhaustive
- 9.1.6.1. Company Overview
- 9.1.6.2. Products
- 9.1.6.3. Company Financials
- 9.1.6.4. SWOT Analysis
- 9.1.7 Crown Holdings Inc
- 9.1.7.1. Company Overview
- 9.1.7.2. Products
- 9.1.7.3. Company Financials
- 9.1.7.4. SWOT Analysis
- 9.1.8 Graham Packaging Company
- 9.1.8.1. Company Overview
- 9.1.8.2. Products
- 9.1.8.3. Company Financials
- 9.1.8.4. SWOT Analysis
- 9.1.9 Tetra Pak International
- 9.1.9.1. Company Overview
- 9.1.9.2. Products
- 9.1.9.3. Company Financials
- 9.1.9.4. SWOT Analysis
- 9.1.10 The Scoular Company
- 9.1.10.1. Company Overview
- 9.1.10.2. Products
- 9.1.10.3. Company Financials
- 9.1.10.4. SWOT Analysis
- 9.1.11 Toyo Seikan Group Holdings Ltd
- 9.1.11.1. Company Overview
- 9.1.11.2. Products
- 9.1.11.3. Company Financials
- 9.1.11.4. SWOT Analysis
- 9.1.12 Pactive LLC
- 9.1.12.1. Company Overview
- 9.1.12.2. Products
- 9.1.12.3. Company Financials
- 9.1.12.4. SWOT Analysis
- 9.1.13 Placon Corporation
- 9.1.13.1. Company Overview
- 9.1.13.2. Products
- 9.1.13.3. Company Financials
- 9.1.13.4. SWOT Analysis
- 9.1.14 Genpak LLC
- 9.1.14.1. Company Overview
- 9.1.14.2. Products
- 9.1.14.3. Company Financials
- 9.1.14.4. SWOT Analysis
- 9.1.15 Owens-Illinois Inc
- 9.1.15.1. Company Overview
- 9.1.15.2. Products
- 9.1.15.3. Company Financials
- 9.1.15.4. SWOT Analysis
- 9.1.16 Amcor Ltd
- 9.1.16.1. Company Overview
- 9.1.16.2. Products
- 9.1.16.3. Company Financials
- 9.1.16.4. SWOT Analysis
- 9.1.1 WestRock Company
- 9.2. Market Entropy
- 9.2.1 Company's Key Areas Served
- 9.2.2 Recent Developments
- 9.3. Company Market Share Analysis 2025
- 9.3.1 Top 5 Companies Market Share Analysis
- 9.3.2 Top 3 Companies Market Share Analysis
- 9.4. List of Potential Customers
- 10. Research Methodology
List of Figures
- Figure 1: North America Soft Drinks Packaging Market Revenue Breakdown (billion, %) by Product 2025 & 2033
- Figure 2: North America Soft Drinks Packaging Market Share (%) by Company 2025
List of Tables
- Table 1: North America Soft Drinks Packaging Market Revenue billion Forecast, by Packaging Material Type 2020 & 2033
- Table 2: North America Soft Drinks Packaging Market Revenue billion Forecast, by Product Type 2020 & 2033
- Table 3: North America Soft Drinks Packaging Market Revenue billion Forecast, by Geography 2020 & 2033
- Table 4: North America Soft Drinks Packaging Market Revenue billion Forecast, by Region 2020 & 2033
- Table 5: North America Soft Drinks Packaging Market Revenue billion Forecast, by Packaging Material Type 2020 & 2033
- Table 6: North America Soft Drinks Packaging Market Revenue billion Forecast, by Product Type 2020 & 2033
- Table 7: North America Soft Drinks Packaging Market Revenue billion Forecast, by Geography 2020 & 2033
- Table 8: North America Soft Drinks Packaging Market Revenue billion Forecast, by Country 2020 & 2033
- Table 9: North America Soft Drinks Packaging Market Revenue billion Forecast, by Packaging Material Type 2020 & 2033
- Table 10: North America Soft Drinks Packaging Market Revenue billion Forecast, by Product Type 2020 & 2033
- Table 11: North America Soft Drinks Packaging Market Revenue billion Forecast, by Geography 2020 & 2033
- Table 12: North America Soft Drinks Packaging Market Revenue billion Forecast, by Country 2020 & 2033
Frequently Asked Questions
1. What is the projected Compound Annual Growth Rate (CAGR) of the North America Soft Drinks Packaging Market?
The projected CAGR is approximately 6.57%.
2. Which companies are prominent players in the North America Soft Drinks Packaging Market?
Key companies in the market include WestRock Company, CAN-PACK SA, SIG Combibloc Company Ltd, Ball Corporation, Ardagh Group SA, Alcoa Corporation*List Not Exhaustive, Crown Holdings Inc, Graham Packaging Company, Tetra Pak International, The Scoular Company, Toyo Seikan Group Holdings Ltd, Pactive LLC, Placon Corporation, Genpak LLC, Owens-Illinois Inc, Amcor Ltd.
3. What are the main segments of the North America Soft Drinks Packaging Market?
The market segments include Packaging Material Type, Product Type, Geography.
4. Can you provide details about the market size?
The market size is estimated to be USD 42.16 billion as of 2022.
5. What are some drivers contributing to market growth?
Increasing Soft Drink Consumption; Increased Demand for Convenience Packaging from Consumers.
6. What are the notable trends driving market growth?
The RTD Beverages Segment is Expected to Hold a Significant Market Share.
7. Are there any restraints impacting market growth?
Environmental Concerns Regarding Usage of Plastic; Stringent Government Regulations.
8. Can you provide examples of recent developments in the market?
In May 2021, Ball Corporation announced the availability of the first-of-its-kind Ball Aluminum Cup for soft drinks at major retailers in all 50 states across the United States. The product was made available between May and June for the first time to more than 18,000 food, drug, and mass retailers, including Kroger, Target, Albertsons, CVS, and others. The nationwide retail rollout follows the success of a limited pilot that began in 2019. Since then, the cups have been available in select retailers, restaurants, and major sports and entertainment venues such as Ball Arena in Denver, SoFi Stadium in Inglewood, and Allegiant Stadium in Las Vegas.
9. What pricing options are available for accessing the report?
Pricing options include single-user, multi-user, and enterprise licenses priced at USD 4750, USD 5250, and USD 8750 respectively.
10. Is the market size provided in terms of value or volume?
The market size is provided in terms of value, measured in billion.
11. Are there any specific market keywords associated with the report?
Yes, the market keyword associated with the report is "North America Soft Drinks Packaging Market," which aids in identifying and referencing the specific market segment covered.
12. How do I determine which pricing option suits my needs best?
The pricing options vary based on user requirements and access needs. Individual users may opt for single-user licenses, while businesses requiring broader access may choose multi-user or enterprise licenses for cost-effective access to the report.
13. Are there any additional resources or data provided in the North America Soft Drinks Packaging Market report?
While the report offers comprehensive insights, it's advisable to review the specific contents or supplementary materials provided to ascertain if additional resources or data are available.
14. How can I stay updated on further developments or reports in the North America Soft Drinks Packaging Market?
To stay informed about further developments, trends, and reports in the North America Soft Drinks Packaging Market, consider subscribing to industry newsletters, following relevant companies and organizations, or regularly checking reputable industry news sources and publications.
Methodology
Step 1 - Identification of Relevant Samples Size from Population Database


Step 2 - Approaches for Defining Global Market Size (Value, Volume* & Price*)

Note*: In applicable scenarios
Step 3 - Data Sources
Primary Research
- Web Analytics
- Survey Reports
- Research Institute
- Latest Research Reports
- Opinion Leaders
Secondary Research
- Annual Reports
- White Paper
- Latest Press Release
- Industry Association
- Paid Database
- Investor Presentations

Step 4 - Data Triangulation
Involves using different sources of information in order to increase the validity of a study
These sources are likely to be stakeholders in a program - participants, other researchers, program staff, other community members, and so on.
Then we put all data in single framework & apply various statistical tools to find out the dynamic on the market.
During the analysis stage, feedback from the stakeholder groups would be compared to determine areas of agreement as well as areas of divergence