

Key Insights
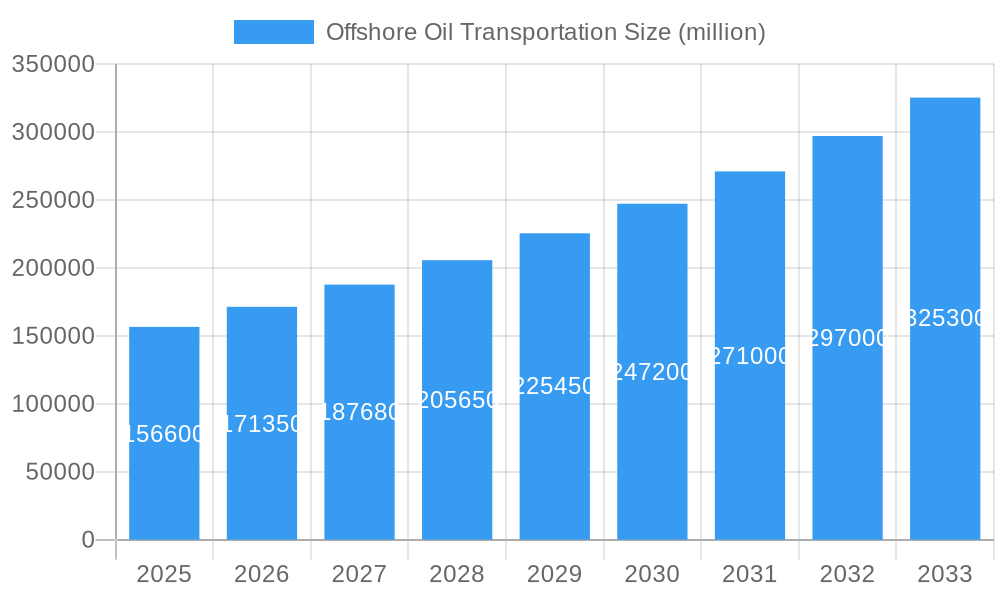
The offshore oil transportation market, valued at $156.6 billion in 2025, is projected to experience robust growth, driven by increasing global energy demand and the continued exploration and production of offshore oil reserves. A compound annual growth rate (CAGR) of 9.3% from 2025 to 2033 indicates a significant expansion, potentially reaching approximately $370 billion by 2033. This growth is fueled by several key factors: rising global oil consumption, particularly in developing economies; the development of new offshore oil fields in challenging environments; and ongoing investments in modernizing the tanker fleet to enhance efficiency and safety. However, challenges remain, including fluctuating oil prices, stringent environmental regulations aimed at reducing greenhouse gas emissions from shipping, and geopolitical instability impacting trade routes. The market is highly fragmented, with numerous players such as Teekay, Euronav, Scorpio Tankers, and Frontline Ltd. competing for market share. These companies are continually striving to improve operational efficiency, optimize vessel utilization, and adopt sustainable practices to maintain competitiveness.
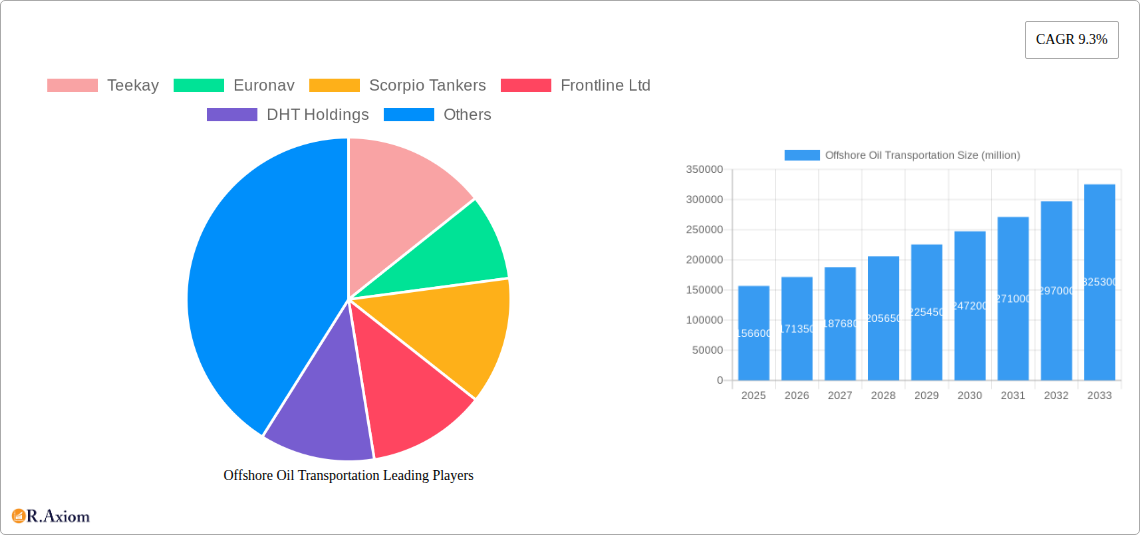
Offshore Oil Transportation Market Size (In Billion)
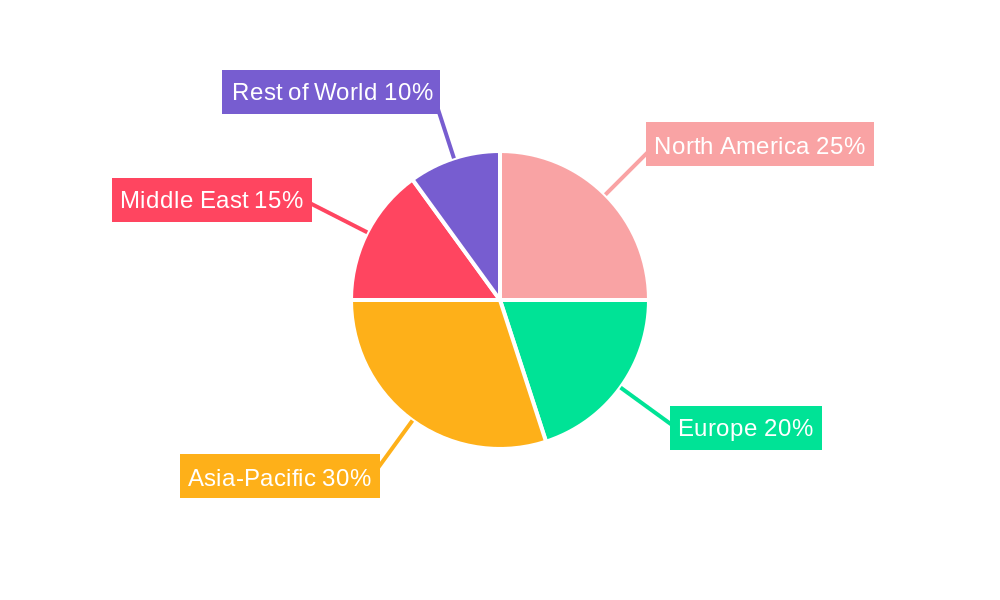
Technological advancements, such as the adoption of advanced vessel tracking systems and fuel-efficient technologies, are further shaping market dynamics. The increasing adoption of LNG as a marine fuel is also expected to significantly influence the market, reducing emissions and potentially improving operational costs. While regional data is currently unavailable, it is anticipated that regions with significant offshore oil production and refining capacities, such as the Middle East, North America, and Asia-Pacific, will dominate the market share. Further segmentation analysis, encompassing vessel types (VLCCs, Suezmaxes, etc.), and contract types, is necessary for a comprehensive understanding of the market’s intricate structure. This analysis highlights both the potential and the challenges inherent in the offshore oil transportation sector, requiring a strategic approach for sustained growth and profitability in the coming years.
Offshore Oil Transportation Company Market Share
Offshore Oil Transportation Market Report: 2019-2033
This comprehensive report provides a detailed analysis of the offshore oil transportation market, offering actionable insights for industry stakeholders. The study period spans from 2019 to 2033, with 2025 serving as both the base and estimated year. The forecast period covers 2025-2033, and the historical period encompasses 2019-2024. Key players analyzed include Teekay, Euronav, Scorpio Tankers, Frontline Ltd, DHT Holdings, Tsakos Energy Navigation, MOL, Bahri, TORM, International Seaways, China Ocean Shipping Group Co., Ltd., Nanjing Tanker Corporation, Shanghai International Port (Group) Co., Ltd., China Changjiang Bunker (Sinopec) Co., Ltd., HMM Co. Ltd., SFL Corp, Overseas Shipholding Group, AsstrA, Chevron, Navios Maritime Holdings, Nordic American Tankers, Angelicoussis, Japan Oil Transportation, Genesis Energy, and Delek. The report utilizes millions (M) for all value representations.
Offshore Oil Transportation Market Concentration & Innovation
This section analyzes the competitive landscape, innovation drivers, regulatory impacts, and market dynamics within the offshore oil transportation sector. The market exhibits moderate concentration, with the top five players holding approximately xx% of the market share in 2025. Significant M&A activity was observed during the historical period, with deal values totaling approximately $xxM. Key drivers of innovation include advancements in vessel design (e.g., LNG-fueled tankers), digitalization efforts (e.g., enhanced vessel tracking and management systems), and stricter environmental regulations. Regulatory frameworks, particularly those related to emissions and safety, significantly influence market dynamics. The increasing demand for cleaner energy sources represents a potential substitute for traditional oil transportation, although this impact is currently limited. End-user trends, driven primarily by global energy demand and geopolitical factors, heavily influence market growth.
- Market Share (2025): Top 5 players: xx%
- M&A Deal Value (2019-2024): Approximately $xxM
- Key Innovation Drivers: LNG-fueled vessels, digitalization, stricter environmental regulations.
- Key Regulatory Factors: Emission standards, safety regulations, port access restrictions.
Offshore Oil Transportation Industry Trends & Insights
The offshore oil transportation market is projected to experience a Compound Annual Growth Rate (CAGR) of xx% during the forecast period (2025-2033). Market growth is primarily driven by increasing global energy demand, particularly in developing economies. Technological disruptions, such as the adoption of autonomous vessels and advanced fuel technologies, are reshaping the industry, improving efficiency and reducing environmental impact. Consumer preferences are increasingly shifting towards sustainable solutions, putting pressure on companies to adopt greener practices. Competitive dynamics are characterized by fierce competition among established players and the emergence of new entrants leveraging technological advancements. Market penetration of LNG-fueled vessels is expected to reach xx% by 2033. Geopolitical instability and fluctuating oil prices create considerable uncertainty and pose significant challenges to long-term market stability.
Dominant Markets & Segments in Offshore Oil Transportation
The Asia-Pacific region dominates the offshore oil transportation market, driven by robust economic growth and expanding energy consumption within the region. China, specifically, presents a significant market opportunity due to its considerable demand for energy imports.
- Key Drivers for Asia-Pacific Dominance:
- Rapid economic growth and industrialization.
- Increased energy demand from developing economies.
- Significant infrastructure investments in ports and shipping lanes.
- Strategic location along major shipping routes.
The tanker segment accounts for the largest share of the market, owing to the high volume of crude oil and refined products transported globally. The VLCC (Very Large Crude Carrier) segment holds significant market share, due to economies of scale in transporting large volumes of oil. Other segments include Suezmax, Aframax, and Panamax tankers, each catering to different cargo volumes and routes. The global nature of the market makes it inherently volatile to geopolitical changes and shifting trade patterns.
Offshore Oil Transportation Product Developments
Recent product innovations focus on enhancing fuel efficiency, reducing emissions, and improving safety. These include the introduction of LNG-fueled tankers, the development of advanced vessel monitoring systems, and the adoption of environmentally friendly hull coatings. These innovations offer significant competitive advantages, allowing operators to reduce operating costs, meet stringent environmental regulations, and improve overall operational efficiency. Market fit for these innovative solutions is strong, driven by increasing regulatory pressures and growing consumer demand for sustainable transportation.
Report Scope & Segmentation Analysis
This report segments the offshore oil transportation market based on vessel type (VLCC, Suezmax, Aframax, Panamax, etc.), cargo type (crude oil, refined products), geographical region (Asia-Pacific, North America, Europe, Middle East & Africa, South America), and transportation mode (conventional, LNG-powered). Each segment is analyzed based on historical performance, current market size, growth projections, and competitive dynamics. For example, the VLCC segment shows a xx% market share in 2025, with projected growth of xx% CAGR through 2033. Competition within each segment varies widely, based on market size and technical requirements.
Key Drivers of Offshore Oil Transportation Growth
The growth of the offshore oil transportation market is primarily driven by increasing global energy demand fueled by industrialization in developing economies and population growth. Furthermore, technological advancements in vessel design, automation, and fuel efficiency enhance operational efficiency, lowering costs and contributing to market expansion. Favorable government policies and supportive regulatory frameworks create a conducive environment for market growth. Finally, expansion of global trade and maritime infrastructure plays a significant role.
Challenges in the Offshore Oil Transportation Sector
The offshore oil transportation sector faces several significant challenges, including fluctuating oil prices impacting demand and profitability. Stringent environmental regulations, including emissions standards, pose substantial compliance costs. Geopolitical instability and disruptions to global supply chains pose threats to shipping routes and overall operational reliability. Furthermore, intense competition among established players and the entry of new competitors intensify the pressure on pricing and margins. This competition is expected to remain fierce, with a predicted xx% increase in competition from new entrants in the next five years.
Emerging Opportunities in Offshore Oil Transportation
Emerging opportunities within the sector include the expansion of LNG-fueled vessels, driven by environmental concerns and regulatory pressures. Growth in emerging markets presents substantial potential for expansion. Technological advancements in autonomous shipping and digitalization offer increased efficiency and cost savings. Investment in sustainable technologies and alternative fuels presents a path to meeting evolving consumer preferences and strengthening market sustainability.
Leading Players in the Offshore Oil Transportation Market
- Teekay
- Euronav
- Scorpio Tankers
- Frontline Ltd
- DHT Holdings
- Tsakos Energy Navigation
- MOL
- Bahri
- TORM
- International Seaways
- China Ocean Shipping Group Co., Ltd.
- Nanjing Tanker Corporation
- Shanghai International Port (Group) Co., Ltd.
- China Changjiang Bunker (Sinopec) Co., Ltd.
- HMM Co. Ltd.
- SFL Corp
- Overseas Shipholding Group
- AsstrA
- Chevron
- Navios Maritime Holdings
- Nordic American Tankers
- Angelicoussis
- Japan Oil Transportation
- Genesis Energy
- Delek
Key Developments in Offshore Oil Transportation Industry
- 2022 Q4: Introduction of a new generation of LNG-fueled VLCCs by Teekay.
- 2023 Q1: Merger between two smaller tanker companies resulting in xx% market share increase.
- 2023 Q3: Implementation of stricter emission regulations in the EU impacting shipping routes and costs.
- 2024 Q2: Significant investment in autonomous vessel technology by a major player.
- 2025 Q1: Launch of new digital platform for cargo management and tracking.
Strategic Outlook for Offshore Oil Transportation Market
The offshore oil transportation market is poised for sustained growth, driven by long-term global energy demand, technological advancements, and strategic investments in infrastructure. While challenges related to regulations and geopolitical instability remain, the adoption of sustainable practices and technological innovations will shape the industry's future trajectory. Focus on efficiency, sustainability, and technological integration will be crucial for success in the coming years. This presents significant opportunities for companies that can effectively adapt to the evolving market landscape.
Offshore Oil Transportation Segmentation
-
1. Application
- 1.1. Military Use
- 1.2. Civil Use
-
2. Type
- 2.1. Crude Oil Transport
- 2.2. Refined Oil Transport
- 2.3. Others
Offshore Oil Transportation Segmentation By Geography
-
1. North America
- 1.1. United States
- 1.2. Canada
- 1.3. Mexico
-
2. South America
- 2.1. Brazil
- 2.2. Argentina
- 2.3. Rest of South America
-
3. Europe
- 3.1. United Kingdom
- 3.2. Germany
- 3.3. France
- 3.4. Italy
- 3.5. Spain
- 3.6. Russia
- 3.7. Benelux
- 3.8. Nordics
- 3.9. Rest of Europe
-
4. Middle East & Africa
- 4.1. Turkey
- 4.2. Israel
- 4.3. GCC
- 4.4. North Africa
- 4.5. South Africa
- 4.6. Rest of Middle East & Africa
-
5. Asia Pacific
- 5.1. China
- 5.2. India
- 5.3. Japan
- 5.4. South Korea
- 5.5. ASEAN
- 5.6. Oceania
- 5.7. Rest of Asia Pacific
Offshore Oil Transportation Regional Market Share
Geographic Coverage of Offshore Oil Transportation
Offshore Oil Transportation REPORT HIGHLIGHTS
| Aspects | Details |
|---|---|
| Study Period | 2020-2034 |
| Base Year | 2025 |
| Estimated Year | 2026 |
| Forecast Period | 2026-2034 |
| Historical Period | 2020-2025 |
| Growth Rate | CAGR of 9.3% from 2020-2034 |
| Segmentation |
|
Table of Contents
- 1. Introduction
- 1.1. Research Scope
- 1.2. Market Segmentation
- 1.3. Research Objective
- 1.4. Definitions and Assumptions
- 2. Executive Summary
- 2.1. Market Snapshot
- 3. Market Dynamics
- 3.1. Market Drivers
- 3.2. Market Restrains
- 3.3. Market Trends
- 3.4. Market Opportunities
- 4. Market Factor Analysis
- 4.1. Porters Five Forces
- 4.1.1. Bargaining Power of Suppliers
- 4.1.2. Bargaining Power of Buyers
- 4.1.3. Threat of New Entrants
- 4.1.4. Threat of Substitutes
- 4.1.5. Competitive Rivalry
- 4.2. PESTEL analysis
- 4.3. BCG Analysis
- 4.3.1. Stars (High Growth, High Market Share)
- 4.3.2. Cash Cows (Low Growth, High Market Share)
- 4.3.3. Question Mark (High Growth, Low Market Share)
- 4.3.4. Dogs (Low Growth, Low Market Share)
- 4.4. Ansoff Matrix Analysis
- 4.5. Supply Chain Analysis
- 4.6. Regulatory Landscape
- 4.7. Current Market Potential and Opportunity Assessment (TAM–SAM–SOM Framework)
- 4.8. RAX Analyst Note
- 4.1. Porters Five Forces
- 5. Market Analysis, Insights and Forecast 2021-2033
- 5.1. Market Analysis, Insights and Forecast - by Application
- 5.1.1. Military Use
- 5.1.2. Civil Use
- 5.2. Market Analysis, Insights and Forecast - by Type
- 5.2.1. Crude Oil Transport
- 5.2.2. Refined Oil Transport
- 5.2.3. Others
- 5.3. Market Analysis, Insights and Forecast - by Region
- 5.3.1. North America
- 5.3.2. South America
- 5.3.3. Europe
- 5.3.4. Middle East & Africa
- 5.3.5. Asia Pacific
- 5.1. Market Analysis, Insights and Forecast - by Application
- 6. Global Offshore Oil Transportation Analysis, Insights and Forecast, 2021-2033
- 6.1. Market Analysis, Insights and Forecast - by Application
- 6.1.1. Military Use
- 6.1.2. Civil Use
- 6.2. Market Analysis, Insights and Forecast - by Type
- 6.2.1. Crude Oil Transport
- 6.2.2. Refined Oil Transport
- 6.2.3. Others
- 6.1. Market Analysis, Insights and Forecast - by Application
- 7. North America Offshore Oil Transportation Analysis, Insights and Forecast, 2020-2032
- 7.1. Market Analysis, Insights and Forecast - by Application
- 7.1.1. Military Use
- 7.1.2. Civil Use
- 7.2. Market Analysis, Insights and Forecast - by Type
- 7.2.1. Crude Oil Transport
- 7.2.2. Refined Oil Transport
- 7.2.3. Others
- 7.1. Market Analysis, Insights and Forecast - by Application
- 8. South America Offshore Oil Transportation Analysis, Insights and Forecast, 2020-2032
- 8.1. Market Analysis, Insights and Forecast - by Application
- 8.1.1. Military Use
- 8.1.2. Civil Use
- 8.2. Market Analysis, Insights and Forecast - by Type
- 8.2.1. Crude Oil Transport
- 8.2.2. Refined Oil Transport
- 8.2.3. Others
- 8.1. Market Analysis, Insights and Forecast - by Application
- 9. Europe Offshore Oil Transportation Analysis, Insights and Forecast, 2020-2032
- 9.1. Market Analysis, Insights and Forecast - by Application
- 9.1.1. Military Use
- 9.1.2. Civil Use
- 9.2. Market Analysis, Insights and Forecast - by Type
- 9.2.1. Crude Oil Transport
- 9.2.2. Refined Oil Transport
- 9.2.3. Others
- 9.1. Market Analysis, Insights and Forecast - by Application
- 10. Middle East & Africa Offshore Oil Transportation Analysis, Insights and Forecast, 2020-2032
- 10.1. Market Analysis, Insights and Forecast - by Application
- 10.1.1. Military Use
- 10.1.2. Civil Use
- 10.2. Market Analysis, Insights and Forecast - by Type
- 10.2.1. Crude Oil Transport
- 10.2.2. Refined Oil Transport
- 10.2.3. Others
- 10.1. Market Analysis, Insights and Forecast - by Application
- 11. Asia Pacific Offshore Oil Transportation Analysis, Insights and Forecast, 2020-2032
- 11.1. Market Analysis, Insights and Forecast - by Application
- 11.1.1. Military Use
- 11.1.2. Civil Use
- 11.2. Market Analysis, Insights and Forecast - by Type
- 11.2.1. Crude Oil Transport
- 11.2.2. Refined Oil Transport
- 11.2.3. Others
- 11.1. Market Analysis, Insights and Forecast - by Application
- 12. Competitive Analysis
- 12.1. Company Profiles
- 12.1.1 Teekay
- 12.1.1.1. Company Overview
- 12.1.1.2. Products
- 12.1.1.3. Company Financials
- 12.1.1.4. SWOT Analysis
- 12.1.2 Euronav
- 12.1.2.1. Company Overview
- 12.1.2.2. Products
- 12.1.2.3. Company Financials
- 12.1.2.4. SWOT Analysis
- 12.1.3 Scorpio Tankers
- 12.1.3.1. Company Overview
- 12.1.3.2. Products
- 12.1.3.3. Company Financials
- 12.1.3.4. SWOT Analysis
- 12.1.4 Frontline Ltd
- 12.1.4.1. Company Overview
- 12.1.4.2. Products
- 12.1.4.3. Company Financials
- 12.1.4.4. SWOT Analysis
- 12.1.5 DHT Holdings
- 12.1.5.1. Company Overview
- 12.1.5.2. Products
- 12.1.5.3. Company Financials
- 12.1.5.4. SWOT Analysis
- 12.1.6 Tsakos Energy Navigation
- 12.1.6.1. Company Overview
- 12.1.6.2. Products
- 12.1.6.3. Company Financials
- 12.1.6.4. SWOT Analysis
- 12.1.7 MOL
- 12.1.7.1. Company Overview
- 12.1.7.2. Products
- 12.1.7.3. Company Financials
- 12.1.7.4. SWOT Analysis
- 12.1.8 Bahri
- 12.1.8.1. Company Overview
- 12.1.8.2. Products
- 12.1.8.3. Company Financials
- 12.1.8.4. SWOT Analysis
- 12.1.9 TORM
- 12.1.9.1. Company Overview
- 12.1.9.2. Products
- 12.1.9.3. Company Financials
- 12.1.9.4. SWOT Analysis
- 12.1.10 International Seaways
- 12.1.10.1. Company Overview
- 12.1.10.2. Products
- 12.1.10.3. Company Financials
- 12.1.10.4. SWOT Analysis
- 12.1.11 China Ocean Shipping Group Co. Ltd.
- 12.1.11.1. Company Overview
- 12.1.11.2. Products
- 12.1.11.3. Company Financials
- 12.1.11.4. SWOT Analysis
- 12.1.12 Nanjing Tanker Corporation
- 12.1.12.1. Company Overview
- 12.1.12.2. Products
- 12.1.12.3. Company Financials
- 12.1.12.4. SWOT Analysis
- 12.1.13 Shanghai International Port (Group) Co. Ltd.
- 12.1.13.1. Company Overview
- 12.1.13.2. Products
- 12.1.13.3. Company Financials
- 12.1.13.4. SWOT Analysis
- 12.1.14 China Changjiang Bunker (Sinopec) Co. Ltd.
- 12.1.14.1. Company Overview
- 12.1.14.2. Products
- 12.1.14.3. Company Financials
- 12.1.14.4. SWOT Analysis
- 12.1.15 HMM Co. Ltd.
- 12.1.15.1. Company Overview
- 12.1.15.2. Products
- 12.1.15.3. Company Financials
- 12.1.15.4. SWOT Analysis
- 12.1.16 SFL Corp
- 12.1.16.1. Company Overview
- 12.1.16.2. Products
- 12.1.16.3. Company Financials
- 12.1.16.4. SWOT Analysis
- 12.1.17 Overseas Shipholding Group
- 12.1.17.1. Company Overview
- 12.1.17.2. Products
- 12.1.17.3. Company Financials
- 12.1.17.4. SWOT Analysis
- 12.1.18 AsstrA
- 12.1.18.1. Company Overview
- 12.1.18.2. Products
- 12.1.18.3. Company Financials
- 12.1.18.4. SWOT Analysis
- 12.1.19 Chevron
- 12.1.19.1. Company Overview
- 12.1.19.2. Products
- 12.1.19.3. Company Financials
- 12.1.19.4. SWOT Analysis
- 12.1.20 Navios Maritime Holdings
- 12.1.20.1. Company Overview
- 12.1.20.2. Products
- 12.1.20.3. Company Financials
- 12.1.20.4. SWOT Analysis
- 12.1.21 Nordic American Tankers
- 12.1.21.1. Company Overview
- 12.1.21.2. Products
- 12.1.21.3. Company Financials
- 12.1.21.4. SWOT Analysis
- 12.1.22 Angelicoussis
- 12.1.22.1. Company Overview
- 12.1.22.2. Products
- 12.1.22.3. Company Financials
- 12.1.22.4. SWOT Analysis
- 12.1.23 Japan Oil Transportation
- 12.1.23.1. Company Overview
- 12.1.23.2. Products
- 12.1.23.3. Company Financials
- 12.1.23.4. SWOT Analysis
- 12.1.24 Genesis Energy
- 12.1.24.1. Company Overview
- 12.1.24.2. Products
- 12.1.24.3. Company Financials
- 12.1.24.4. SWOT Analysis
- 12.1.25 Delek
- 12.1.25.1. Company Overview
- 12.1.25.2. Products
- 12.1.25.3. Company Financials
- 12.1.25.4. SWOT Analysis
- 12.1.1 Teekay
- 12.2. Market Entropy
- 12.2.1 Company's Key Areas Served
- 12.2.2 Recent Developments
- 12.3. Company Market Share Analysis 2025
- 12.3.1 Top 5 Companies Market Share Analysis
- 12.3.2 Top 3 Companies Market Share Analysis
- 12.4. List of Potential Customers
- 13. Research Methodology
List of Figures
- Figure 1: Global Offshore Oil Transportation Revenue Breakdown (million, %) by Region 2025 & 2033
- Figure 2: North America Offshore Oil Transportation Revenue (million), by Application 2025 & 2033
- Figure 3: North America Offshore Oil Transportation Revenue Share (%), by Application 2025 & 2033
- Figure 4: North America Offshore Oil Transportation Revenue (million), by Type 2025 & 2033
- Figure 5: North America Offshore Oil Transportation Revenue Share (%), by Type 2025 & 2033
- Figure 6: North America Offshore Oil Transportation Revenue (million), by Country 2025 & 2033
- Figure 7: North America Offshore Oil Transportation Revenue Share (%), by Country 2025 & 2033
- Figure 8: South America Offshore Oil Transportation Revenue (million), by Application 2025 & 2033
- Figure 9: South America Offshore Oil Transportation Revenue Share (%), by Application 2025 & 2033
- Figure 10: South America Offshore Oil Transportation Revenue (million), by Type 2025 & 2033
- Figure 11: South America Offshore Oil Transportation Revenue Share (%), by Type 2025 & 2033
- Figure 12: South America Offshore Oil Transportation Revenue (million), by Country 2025 & 2033
- Figure 13: South America Offshore Oil Transportation Revenue Share (%), by Country 2025 & 2033
- Figure 14: Europe Offshore Oil Transportation Revenue (million), by Application 2025 & 2033
- Figure 15: Europe Offshore Oil Transportation Revenue Share (%), by Application 2025 & 2033
- Figure 16: Europe Offshore Oil Transportation Revenue (million), by Type 2025 & 2033
- Figure 17: Europe Offshore Oil Transportation Revenue Share (%), by Type 2025 & 2033
- Figure 18: Europe Offshore Oil Transportation Revenue (million), by Country 2025 & 2033
- Figure 19: Europe Offshore Oil Transportation Revenue Share (%), by Country 2025 & 2033
- Figure 20: Middle East & Africa Offshore Oil Transportation Revenue (million), by Application 2025 & 2033
- Figure 21: Middle East & Africa Offshore Oil Transportation Revenue Share (%), by Application 2025 & 2033
- Figure 22: Middle East & Africa Offshore Oil Transportation Revenue (million), by Type 2025 & 2033
- Figure 23: Middle East & Africa Offshore Oil Transportation Revenue Share (%), by Type 2025 & 2033
- Figure 24: Middle East & Africa Offshore Oil Transportation Revenue (million), by Country 2025 & 2033
- Figure 25: Middle East & Africa Offshore Oil Transportation Revenue Share (%), by Country 2025 & 2033
- Figure 26: Asia Pacific Offshore Oil Transportation Revenue (million), by Application 2025 & 2033
- Figure 27: Asia Pacific Offshore Oil Transportation Revenue Share (%), by Application 2025 & 2033
- Figure 28: Asia Pacific Offshore Oil Transportation Revenue (million), by Type 2025 & 2033
- Figure 29: Asia Pacific Offshore Oil Transportation Revenue Share (%), by Type 2025 & 2033
- Figure 30: Asia Pacific Offshore Oil Transportation Revenue (million), by Country 2025 & 2033
- Figure 31: Asia Pacific Offshore Oil Transportation Revenue Share (%), by Country 2025 & 2033
List of Tables
- Table 1: Global Offshore Oil Transportation Revenue million Forecast, by Application 2020 & 2033
- Table 2: Global Offshore Oil Transportation Revenue million Forecast, by Type 2020 & 2033
- Table 3: Global Offshore Oil Transportation Revenue million Forecast, by Region 2020 & 2033
- Table 4: Global Offshore Oil Transportation Revenue million Forecast, by Application 2020 & 2033
- Table 5: Global Offshore Oil Transportation Revenue million Forecast, by Type 2020 & 2033
- Table 6: Global Offshore Oil Transportation Revenue million Forecast, by Country 2020 & 2033
- Table 7: United States Offshore Oil Transportation Revenue (million) Forecast, by Application 2020 & 2033
- Table 8: Canada Offshore Oil Transportation Revenue (million) Forecast, by Application 2020 & 2033
- Table 9: Mexico Offshore Oil Transportation Revenue (million) Forecast, by Application 2020 & 2033
- Table 10: Global Offshore Oil Transportation Revenue million Forecast, by Application 2020 & 2033
- Table 11: Global Offshore Oil Transportation Revenue million Forecast, by Type 2020 & 2033
- Table 12: Global Offshore Oil Transportation Revenue million Forecast, by Country 2020 & 2033
- Table 13: Brazil Offshore Oil Transportation Revenue (million) Forecast, by Application 2020 & 2033
- Table 14: Argentina Offshore Oil Transportation Revenue (million) Forecast, by Application 2020 & 2033
- Table 15: Rest of South America Offshore Oil Transportation Revenue (million) Forecast, by Application 2020 & 2033
- Table 16: Global Offshore Oil Transportation Revenue million Forecast, by Application 2020 & 2033
- Table 17: Global Offshore Oil Transportation Revenue million Forecast, by Type 2020 & 2033
- Table 18: Global Offshore Oil Transportation Revenue million Forecast, by Country 2020 & 2033
- Table 19: United Kingdom Offshore Oil Transportation Revenue (million) Forecast, by Application 2020 & 2033
- Table 20: Germany Offshore Oil Transportation Revenue (million) Forecast, by Application 2020 & 2033
- Table 21: France Offshore Oil Transportation Revenue (million) Forecast, by Application 2020 & 2033
- Table 22: Italy Offshore Oil Transportation Revenue (million) Forecast, by Application 2020 & 2033
- Table 23: Spain Offshore Oil Transportation Revenue (million) Forecast, by Application 2020 & 2033
- Table 24: Russia Offshore Oil Transportation Revenue (million) Forecast, by Application 2020 & 2033
- Table 25: Benelux Offshore Oil Transportation Revenue (million) Forecast, by Application 2020 & 2033
- Table 26: Nordics Offshore Oil Transportation Revenue (million) Forecast, by Application 2020 & 2033
- Table 27: Rest of Europe Offshore Oil Transportation Revenue (million) Forecast, by Application 2020 & 2033
- Table 28: Global Offshore Oil Transportation Revenue million Forecast, by Application 2020 & 2033
- Table 29: Global Offshore Oil Transportation Revenue million Forecast, by Type 2020 & 2033
- Table 30: Global Offshore Oil Transportation Revenue million Forecast, by Country 2020 & 2033
- Table 31: Turkey Offshore Oil Transportation Revenue (million) Forecast, by Application 2020 & 2033
- Table 32: Israel Offshore Oil Transportation Revenue (million) Forecast, by Application 2020 & 2033
- Table 33: GCC Offshore Oil Transportation Revenue (million) Forecast, by Application 2020 & 2033
- Table 34: North Africa Offshore Oil Transportation Revenue (million) Forecast, by Application 2020 & 2033
- Table 35: South Africa Offshore Oil Transportation Revenue (million) Forecast, by Application 2020 & 2033
- Table 36: Rest of Middle East & Africa Offshore Oil Transportation Revenue (million) Forecast, by Application 2020 & 2033
- Table 37: Global Offshore Oil Transportation Revenue million Forecast, by Application 2020 & 2033
- Table 38: Global Offshore Oil Transportation Revenue million Forecast, by Type 2020 & 2033
- Table 39: Global Offshore Oil Transportation Revenue million Forecast, by Country 2020 & 2033
- Table 40: China Offshore Oil Transportation Revenue (million) Forecast, by Application 2020 & 2033
- Table 41: India Offshore Oil Transportation Revenue (million) Forecast, by Application 2020 & 2033
- Table 42: Japan Offshore Oil Transportation Revenue (million) Forecast, by Application 2020 & 2033
- Table 43: South Korea Offshore Oil Transportation Revenue (million) Forecast, by Application 2020 & 2033
- Table 44: ASEAN Offshore Oil Transportation Revenue (million) Forecast, by Application 2020 & 2033
- Table 45: Oceania Offshore Oil Transportation Revenue (million) Forecast, by Application 2020 & 2033
- Table 46: Rest of Asia Pacific Offshore Oil Transportation Revenue (million) Forecast, by Application 2020 & 2033
Frequently Asked Questions
1. What is the projected Compound Annual Growth Rate (CAGR) of the Offshore Oil Transportation?
The projected CAGR is approximately 9.3%.
2. Which companies are prominent players in the Offshore Oil Transportation?
Key companies in the market include Teekay, Euronav, Scorpio Tankers, Frontline Ltd, DHT Holdings, Tsakos Energy Navigation, MOL, Bahri, TORM, International Seaways, China Ocean Shipping Group Co., Ltd., Nanjing Tanker Corporation, Shanghai International Port (Group) Co., Ltd., China Changjiang Bunker (Sinopec) Co., Ltd., HMM Co. Ltd., SFL Corp, Overseas Shipholding Group, AsstrA, Chevron, Navios Maritime Holdings, Nordic American Tankers, Angelicoussis, Japan Oil Transportation, Genesis Energy, Delek.
3. What are the main segments of the Offshore Oil Transportation?
The market segments include Application, Type.
4. Can you provide details about the market size?
The market size is estimated to be USD 156600 million as of 2022.
5. What are some drivers contributing to market growth?
N/A
6. What are the notable trends driving market growth?
N/A
7. Are there any restraints impacting market growth?
N/A
8. Can you provide examples of recent developments in the market?
N/A
9. What pricing options are available for accessing the report?
Pricing options include single-user, multi-user, and enterprise licenses priced at USD 2900.00, USD 4350.00, and USD 5800.00 respectively.
10. Is the market size provided in terms of value or volume?
The market size is provided in terms of value, measured in million.
11. Are there any specific market keywords associated with the report?
Yes, the market keyword associated with the report is "Offshore Oil Transportation," which aids in identifying and referencing the specific market segment covered.
12. How do I determine which pricing option suits my needs best?
The pricing options vary based on user requirements and access needs. Individual users may opt for single-user licenses, while businesses requiring broader access may choose multi-user or enterprise licenses for cost-effective access to the report.
13. Are there any additional resources or data provided in the Offshore Oil Transportation report?
While the report offers comprehensive insights, it's advisable to review the specific contents or supplementary materials provided to ascertain if additional resources or data are available.
14. How can I stay updated on further developments or reports in the Offshore Oil Transportation?
To stay informed about further developments, trends, and reports in the Offshore Oil Transportation, consider subscribing to industry newsletters, following relevant companies and organizations, or regularly checking reputable industry news sources and publications.
Methodology
Step 1 - Identification of Relevant Samples Size from Population Database


Step 2 - Approaches for Defining Global Market Size (Value, Volume* & Price*)

Note*: In applicable scenarios
Step 3 - Data Sources
Primary Research
- Web Analytics
- Survey Reports
- Research Institute
- Latest Research Reports
- Opinion Leaders
Secondary Research
- Annual Reports
- White Paper
- Latest Press Release
- Industry Association
- Paid Database
- Investor Presentations

Step 4 - Data Triangulation
Involves using different sources of information in order to increase the validity of a study
These sources are likely to be stakeholders in a program - participants, other researchers, program staff, other community members, and so on.
Then we put all data in single framework & apply various statistical tools to find out the dynamic on the market.
During the analysis stage, feedback from the stakeholder groups would be compared to determine areas of agreement as well as areas of divergence