
Key Insights
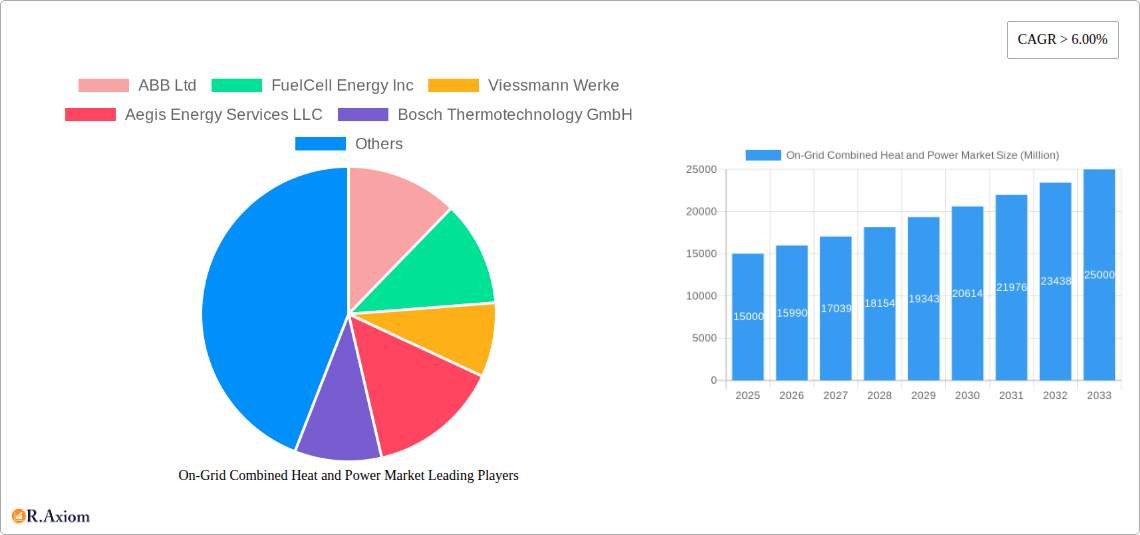
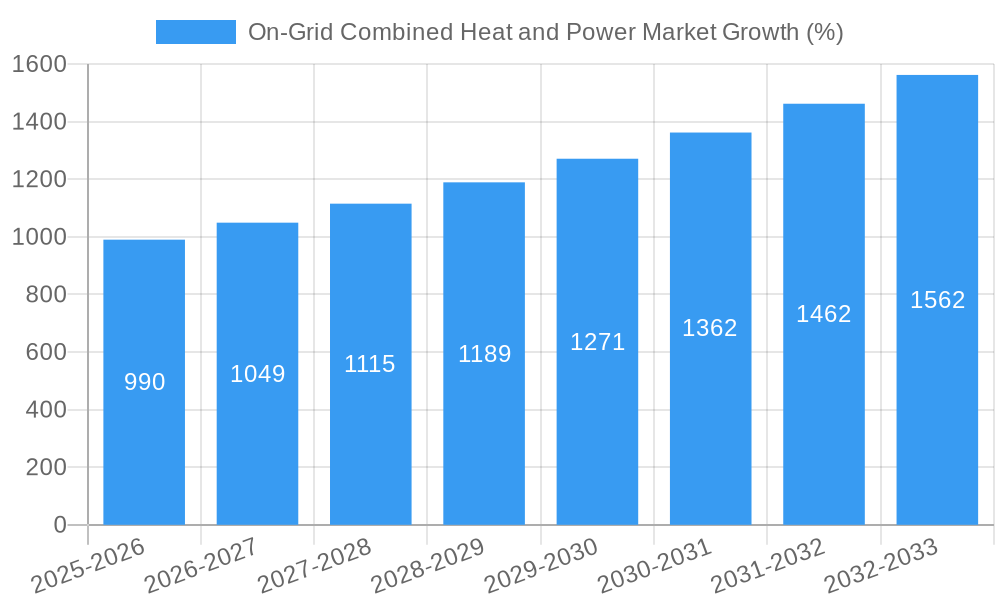
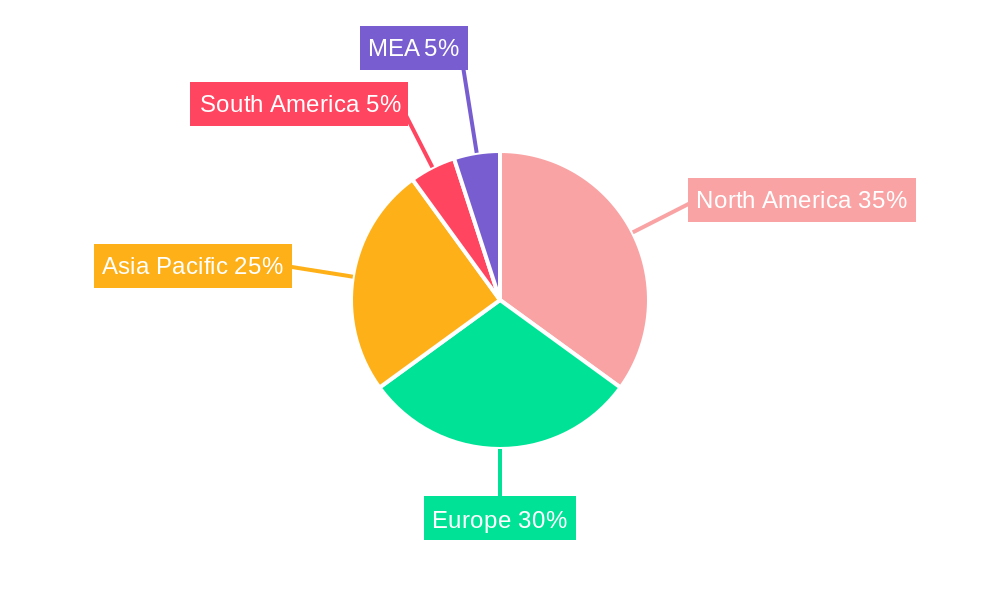
The On-Grid Combined Heat and Power (CHP) market is experiencing robust growth, projected to maintain a Compound Annual Growth Rate (CAGR) exceeding 6% from 2025 to 2033. This expansion is driven by increasing energy demands, stringent environmental regulations promoting energy efficiency, and the rising adoption of decentralized energy generation solutions. Key application segments, including utilities, commercial and industrial sectors, and residential applications, are all contributing to market growth. Natural gas currently dominates the fuel type segment, although the increasing focus on sustainability is fostering growth in biomass and other renewable energy sources. The market is geographically diverse, with North America and Europe holding significant market shares, driven by advanced technological adoption and established infrastructure. However, rapid industrialization and urbanization in Asia-Pacific are expected to fuel significant market expansion in this region over the forecast period. Leading players, such as ABB Ltd, FuelCell Energy Inc, and Siemens AG, are actively investing in research and development to enhance CHP system efficiency and introduce innovative technologies. This competitive landscape is further characterized by mergers and acquisitions, strategic partnerships, and technological advancements.
The restraints to market growth include high initial investment costs for CHP systems, the need for skilled labor for installation and maintenance, and potential regulatory hurdles associated with grid integration. Nevertheless, government incentives, subsidies, and supportive policies aimed at promoting renewable energy and energy efficiency are mitigating these challenges. The long-term outlook for the On-Grid CHP market remains positive, propelled by the increasing need for reliable, efficient, and sustainable energy solutions across various sectors globally. Further market segmentation reveals nuances within each regional and application-based category, with specific growth trajectories dictated by local energy policies, economic conditions, and technological penetration. The market is poised for significant expansion as governments and businesses worldwide prioritize environmentally friendly and cost-effective energy solutions.
On-Grid Combined Heat and Power Market: A Comprehensive Report (2019-2033)
This comprehensive report provides an in-depth analysis of the On-Grid Combined Heat and Power (CHP) market, offering crucial insights for stakeholders, investors, and industry professionals. The report covers the period from 2019 to 2033, with a focus on the forecast period from 2025 to 2033, and utilizes 2025 as the base and estimated year. It meticulously examines market segmentation, competitive landscape, growth drivers, challenges, and emerging opportunities across various regions and applications. The report features detailed analysis of key players including ABB Ltd, FuelCell Energy Inc, Viessmann Werke, Aegis Energy Services LLC, Bosch Thermotechnology GmbH, Mitsubishi Electric Corporation, Caterpillar Inc, Siemens AG, Centrica PLC, Wärtsilä Oyj Abp, MAN Diesel & Turbo SE, General Electric Company, and Kawasaki Heavy Industries Ltd.
On-Grid Combined Heat and Power Market Market Concentration & Innovation
This section analyzes the competitive landscape of the on-grid CHP market, focusing on market concentration, innovation drivers, regulatory influences, and market dynamics. The report delves into the market share held by key players, evaluating their strategic maneuvers, including mergers and acquisitions (M&A). Analysis includes the total value of M&A deals within the study period (2019-2024) estimated at $XX Million.
Market Concentration: The market exhibits a moderately concentrated structure, with the top five players accounting for approximately XX% of the global market share in 2024. This is expected to slightly shift by 2033 due to ongoing innovation and market entry by new players.
Innovation Drivers: Key innovation drivers include advancements in fuel cell technology, improved energy efficiency, and the integration of smart grid technologies. The development of more efficient and cost-effective CHP systems is driving market growth.
Regulatory Frameworks: Government policies promoting renewable energy and energy efficiency are significant drivers. Stringent emission regulations are pushing the adoption of cleaner CHP technologies.
Product Substitutes: Competition comes from other decentralized energy generation technologies like solar PV and wind turbines. However, the CHP's ability to provide both heat and electricity gives it a significant advantage in certain applications.
End-User Trends: A rising preference for sustainable and reliable energy sources is driving demand for on-grid CHP systems, particularly in commercial and industrial sectors.
M&A Activities: The report analyzes key M&A activities within the industry during the historical period (2019-2024), identifying major trends and their impact on market consolidation.
On-Grid Combined Heat and Power Market Industry Trends & Insights
This section provides a detailed overview of the on-grid CHP market's growth trajectory, technological advancements, and competitive dynamics. The analysis encompasses factors driving market expansion, technological disruptions, evolving consumer preferences, and competitive strategies employed by leading players. The Compound Annual Growth Rate (CAGR) for the forecast period (2025-2033) is estimated to be XX%. Market penetration is projected to reach XX% by 2033. The analysis will encompass various factors influencing market dynamics including government incentives, technological advancements and consumer preference for green energy sources.
Dominant Markets & Segments in On-Grid Combined Heat and Power Market
This section identifies the leading regions, countries, and market segments within the on-grid CHP market. It examines the key drivers of dominance in each segment, providing a detailed analysis of market share and growth potential.
Dominant Segments:
- Application: The commercial and industrial segment is expected to dominate the market due to the high energy demands of these sectors and the cost-effectiveness of CHP systems.
- Fuel Type: Natural gas remains the dominant fuel type due to its relatively low cost and widespread availability. However, the market is witnessing a gradual shift towards cleaner fuel options like biomass as environmental concerns grow.
Key Drivers:
- Utilities Segment: Strong government support for renewable energy sources, coupled with the increasing need for reliable baseload power, is driving growth in this segment.
- Commercial and Industrial Segment: The focus on reducing operational costs and improving energy efficiency is a major driver in this segment.
- Residential Segment: Government incentives and falling CHP system costs are increasing adoption in residential applications.
- Natural Gas: Abundant supply and relatively low cost compared to other fuel options make it the leading fuel type.
- Coal: Stricter environmental regulations are limiting the growth of coal-fired CHP systems.
- Oil: Similar to coal, high prices and environmental concerns limit the growth of oil-fired systems.
- Biomass: Growing awareness of sustainability and government support for renewable energy are driving adoption.
- Other Fuel Types: This segment is expected to show modest growth driven by innovations in fuel cell technologies and other emerging energy sources.
On-Grid Combined Heat and Power Market Product Developments
Recent product innovations focus on improving efficiency, reducing emissions, and enhancing system reliability. Integration with smart grid technologies and the development of modular CHP systems are key trends. These innovations cater to growing demand for efficient, sustainable, and cost-effective energy solutions. Competition is mainly driven by efficiency improvements, reduced emissions, and ease of installation.
Report Scope & Segmentation Analysis
This report provides a comprehensive segmentation analysis covering the following aspects:
Application: Utilities, Commercial and Industrial, Residential. Each segment's growth projection, market size, and competitive dynamics are thoroughly analyzed.
Fuel Type: Natural Gas, Coal, Oil, Biomass, Other Fuel Types. Each fuel type's market share, growth trajectory, and future outlook are assessed, considering environmental regulations and fuel availability.
Key Drivers of On-Grid Combined Heat and Power Market Growth
Several factors contribute to the growth of the on-grid CHP market, including:
Increasing energy demand: Global energy needs are steadily rising, boosting the demand for efficient and reliable energy solutions.
Government regulations: Policies promoting renewable energy and energy efficiency stimulate CHP adoption.
Technological advancements: Innovations in CHP technology lead to higher efficiency and reduced emissions.
Economic benefits: CHP systems offer significant cost savings for businesses and industries.
Challenges in the On-Grid Combined Heat and Power Market Sector
The market faces several challenges, including:
High initial investment costs: The upfront investment for CHP systems can be substantial, limiting adoption among smaller businesses.
Technical complexities: Installing and maintaining CHP systems requires specialized knowledge and expertise.
Regulatory uncertainties: Changes in environmental regulations can impact the market dynamics.
Grid integration challenges: Connecting CHP systems to the grid can be complex and require significant infrastructure investment.
Emerging Opportunities in On-Grid Combined Heat and Power Market
The market presents several promising opportunities, such as:
Growing demand for microgrids: CHP systems are crucial components in microgrids, enabling greater energy independence.
Expansion into emerging markets: Developing countries with increasing energy needs provide significant growth potential.
Integration with renewable energy sources: Combining CHP with renewable energy sources like solar and wind enhances sustainability.
Advancements in fuel cell technology: Improvements in fuel cell efficiency and cost-effectiveness will expand the market.
Leading Players in the On-Grid Combined Heat and Power Market Market
- ABB Ltd
- FuelCell Energy Inc
- Viessmann Werke
- Aegis Energy Services LLC
- Bosch Thermotechnology GmbH
- Mitsubishi Electric Corporation
- Caterpillar Inc
- Siemens AG
- Centrica PLC
- Wärtsilä Oyj Abp
- MAN Diesel & Turbo SE
- General Electric Company
- Kawasaki Heavy Industries Ltd
Key Developments in On-Grid Combined Heat and Power Market Industry
- [Month, Year]: ABB Ltd launched a new line of high-efficiency CHP systems. This launch significantly boosted the company's market share and stimulated competition within the industry.
- [Month, Year]: Siemens AG and Wärtsilä Oyj Abp announced a strategic partnership to develop advanced CHP technologies. This collaboration focused on integrating renewable energy sources with CHP systems.
- [Month, Year]: FuelCell Energy Inc. secured a major contract to supply CHP systems for a large-scale commercial project, highlighting the increasing demand for these systems.
Strategic Outlook for On-Grid Combined Heat and Power Market Market
The on-grid CHP market is poised for substantial growth in the coming years, driven by increasing energy demand, government regulations, and technological advancements. The market will witness a growing focus on sustainability, with increased adoption of cleaner fuel types and integration with renewable energy sources. Companies that can effectively adapt to these trends and offer innovative and cost-effective solutions will hold a competitive advantage in this expanding market. The market size is expected to reach $XX Million by 2033, presenting lucrative opportunities for market participants.
On-Grid Combined Heat and Power Market Segmentation
-
1. Application
- 1.1. Utilities
- 1.2. Commercial and Industrial
- 1.3. Residential
-
2. Fuel Type
- 2.1. Natural Gas
- 2.2. Coal
- 2.3. Oil
- 2.4. Biomass
- 2.5. Other Fuel Types
On-Grid Combined Heat and Power Market Segmentation By Geography
- 1. North America
- 2. Europe
- 3. Asia Pacific
- 4. South America
- 5. Middle East
On-Grid Combined Heat and Power Market REPORT HIGHLIGHTS
| Aspects | Details |
|---|---|
| Study Period | 2019-2033 |
| Base Year | 2024 |
| Estimated Year | 2025 |
| Forecast Period | 2025-2033 |
| Historical Period | 2019-2024 |
| Growth Rate | CAGR of > 6.00% from 2019-2033 |
| Segmentation |
|
Table of Contents
- 1. Introduction
- 1.1. Research Scope
- 1.2. Market Segmentation
- 1.3. Research Methodology
- 1.4. Definitions and Assumptions
- 2. Executive Summary
- 2.1. Introduction
- 3. Market Dynamics
- 3.1. Introduction
- 3.2. Market Drivers
- 3.2.1. Supportive Government Policies and Incentives4.; Environmental Concerns
- 3.3. Market Restrains
- 3.3.1. Fossil Fuel Subsidies
- 3.4. Market Trends
- 3.4.1. Biomass Based Combined Heat and Power to Witness a Significant Growth
- 4. Market Factor Analysis
- 4.1. Porters Five Forces
- 4.2. Supply/Value Chain
- 4.3. PESTEL analysis
- 4.4. Market Entropy
- 4.5. Patent/Trademark Analysis
- 5. Global On-Grid Combined Heat and Power Market Analysis, Insights and Forecast, 2019-2031
- 5.1. Market Analysis, Insights and Forecast - by Application
- 5.1.1. Utilities
- 5.1.2. Commercial and Industrial
- 5.1.3. Residential
- 5.2. Market Analysis, Insights and Forecast - by Fuel Type
- 5.2.1. Natural Gas
- 5.2.2. Coal
- 5.2.3. Oil
- 5.2.4. Biomass
- 5.2.5. Other Fuel Types
- 5.3. Market Analysis, Insights and Forecast - by Region
- 5.3.1. North America
- 5.3.2. Europe
- 5.3.3. Asia Pacific
- 5.3.4. South America
- 5.3.5. Middle East
- 5.1. Market Analysis, Insights and Forecast - by Application
- 6. North America On-Grid Combined Heat and Power Market Analysis, Insights and Forecast, 2019-2031
- 6.1. Market Analysis, Insights and Forecast - by Application
- 6.1.1. Utilities
- 6.1.2. Commercial and Industrial
- 6.1.3. Residential
- 6.2. Market Analysis, Insights and Forecast - by Fuel Type
- 6.2.1. Natural Gas
- 6.2.2. Coal
- 6.2.3. Oil
- 6.2.4. Biomass
- 6.2.5. Other Fuel Types
- 6.1. Market Analysis, Insights and Forecast - by Application
- 7. Europe On-Grid Combined Heat and Power Market Analysis, Insights and Forecast, 2019-2031
- 7.1. Market Analysis, Insights and Forecast - by Application
- 7.1.1. Utilities
- 7.1.2. Commercial and Industrial
- 7.1.3. Residential
- 7.2. Market Analysis, Insights and Forecast - by Fuel Type
- 7.2.1. Natural Gas
- 7.2.2. Coal
- 7.2.3. Oil
- 7.2.4. Biomass
- 7.2.5. Other Fuel Types
- 7.1. Market Analysis, Insights and Forecast - by Application
- 8. Asia Pacific On-Grid Combined Heat and Power Market Analysis, Insights and Forecast, 2019-2031
- 8.1. Market Analysis, Insights and Forecast - by Application
- 8.1.1. Utilities
- 8.1.2. Commercial and Industrial
- 8.1.3. Residential
- 8.2. Market Analysis, Insights and Forecast - by Fuel Type
- 8.2.1. Natural Gas
- 8.2.2. Coal
- 8.2.3. Oil
- 8.2.4. Biomass
- 8.2.5. Other Fuel Types
- 8.1. Market Analysis, Insights and Forecast - by Application
- 9. South America On-Grid Combined Heat and Power Market Analysis, Insights and Forecast, 2019-2031
- 9.1. Market Analysis, Insights and Forecast - by Application
- 9.1.1. Utilities
- 9.1.2. Commercial and Industrial
- 9.1.3. Residential
- 9.2. Market Analysis, Insights and Forecast - by Fuel Type
- 9.2.1. Natural Gas
- 9.2.2. Coal
- 9.2.3. Oil
- 9.2.4. Biomass
- 9.2.5. Other Fuel Types
- 9.1. Market Analysis, Insights and Forecast - by Application
- 10. Middle East On-Grid Combined Heat and Power Market Analysis, Insights and Forecast, 2019-2031
- 10.1. Market Analysis, Insights and Forecast - by Application
- 10.1.1. Utilities
- 10.1.2. Commercial and Industrial
- 10.1.3. Residential
- 10.2. Market Analysis, Insights and Forecast - by Fuel Type
- 10.2.1. Natural Gas
- 10.2.2. Coal
- 10.2.3. Oil
- 10.2.4. Biomass
- 10.2.5. Other Fuel Types
- 10.1. Market Analysis, Insights and Forecast - by Application
- 11. North America On-Grid Combined Heat and Power Market Analysis, Insights and Forecast, 2019-2031
- 11.1. Market Analysis, Insights and Forecast - By Country/Sub-region
- 11.1.1 United States
- 11.1.2 Canada
- 11.1.3 Mexico
- 12. Europe On-Grid Combined Heat and Power Market Analysis, Insights and Forecast, 2019-2031
- 12.1. Market Analysis, Insights and Forecast - By Country/Sub-region
- 12.1.1 Germany
- 12.1.2 United Kingdom
- 12.1.3 France
- 12.1.4 Spain
- 12.1.5 Italy
- 12.1.6 Spain
- 12.1.7 Belgium
- 12.1.8 Netherland
- 12.1.9 Nordics
- 12.1.10 Rest of Europe
- 13. Asia Pacific On-Grid Combined Heat and Power Market Analysis, Insights and Forecast, 2019-2031
- 13.1. Market Analysis, Insights and Forecast - By Country/Sub-region
- 13.1.1 China
- 13.1.2 Japan
- 13.1.3 India
- 13.1.4 South Korea
- 13.1.5 Southeast Asia
- 13.1.6 Australia
- 13.1.7 Indonesia
- 13.1.8 Phillipes
- 13.1.9 Singapore
- 13.1.10 Thailandc
- 13.1.11 Rest of Asia Pacific
- 14. South America On-Grid Combined Heat and Power Market Analysis, Insights and Forecast, 2019-2031
- 14.1. Market Analysis, Insights and Forecast - By Country/Sub-region
- 14.1.1 Brazil
- 14.1.2 Argentina
- 14.1.3 Peru
- 14.1.4 Chile
- 14.1.5 Colombia
- 14.1.6 Ecuador
- 14.1.7 Venezuela
- 14.1.8 Rest of South America
- 15. MEA On-Grid Combined Heat and Power Market Analysis, Insights and Forecast, 2019-2031
- 15.1. Market Analysis, Insights and Forecast - By Country/Sub-region
- 15.1.1 United Arab Emirates
- 15.1.2 Saudi Arabia
- 15.1.3 South Africa
- 15.1.4 Rest of Middle East and Africa
- 16. Competitive Analysis
- 16.1. Global Market Share Analysis 2024
- 16.2. Company Profiles
- 16.2.1 ABB Ltd
- 16.2.1.1. Overview
- 16.2.1.2. Products
- 16.2.1.3. SWOT Analysis
- 16.2.1.4. Recent Developments
- 16.2.1.5. Financials (Based on Availability)
- 16.2.2 FuelCell Energy Inc
- 16.2.2.1. Overview
- 16.2.2.2. Products
- 16.2.2.3. SWOT Analysis
- 16.2.2.4. Recent Developments
- 16.2.2.5. Financials (Based on Availability)
- 16.2.3 Viessmann Werke
- 16.2.3.1. Overview
- 16.2.3.2. Products
- 16.2.3.3. SWOT Analysis
- 16.2.3.4. Recent Developments
- 16.2.3.5. Financials (Based on Availability)
- 16.2.4 Aegis Energy Services LLC
- 16.2.4.1. Overview
- 16.2.4.2. Products
- 16.2.4.3. SWOT Analysis
- 16.2.4.4. Recent Developments
- 16.2.4.5. Financials (Based on Availability)
- 16.2.5 Bosch Thermotechnology GmbH
- 16.2.5.1. Overview
- 16.2.5.2. Products
- 16.2.5.3. SWOT Analysis
- 16.2.5.4. Recent Developments
- 16.2.5.5. Financials (Based on Availability)
- 16.2.6 Mitsubishi Electric Corporation
- 16.2.6.1. Overview
- 16.2.6.2. Products
- 16.2.6.3. SWOT Analysis
- 16.2.6.4. Recent Developments
- 16.2.6.5. Financials (Based on Availability)
- 16.2.7 Caterpillar Inc
- 16.2.7.1. Overview
- 16.2.7.2. Products
- 16.2.7.3. SWOT Analysis
- 16.2.7.4. Recent Developments
- 16.2.7.5. Financials (Based on Availability)
- 16.2.8 Seimens AG
- 16.2.8.1. Overview
- 16.2.8.2. Products
- 16.2.8.3. SWOT Analysis
- 16.2.8.4. Recent Developments
- 16.2.8.5. Financials (Based on Availability)
- 16.2.9 Centrica PLC
- 16.2.9.1. Overview
- 16.2.9.2. Products
- 16.2.9.3. SWOT Analysis
- 16.2.9.4. Recent Developments
- 16.2.9.5. Financials (Based on Availability)
- 16.2.10 Wartsila Oyj Abp
- 16.2.10.1. Overview
- 16.2.10.2. Products
- 16.2.10.3. SWOT Analysis
- 16.2.10.4. Recent Developments
- 16.2.10.5. Financials (Based on Availability)
- 16.2.11 MAN Diesel & Turbo SE
- 16.2.11.1. Overview
- 16.2.11.2. Products
- 16.2.11.3. SWOT Analysis
- 16.2.11.4. Recent Developments
- 16.2.11.5. Financials (Based on Availability)
- 16.2.12 General Electric Company
- 16.2.12.1. Overview
- 16.2.12.2. Products
- 16.2.12.3. SWOT Analysis
- 16.2.12.4. Recent Developments
- 16.2.12.5. Financials (Based on Availability)
- 16.2.13 Kawasaki Heavy Industries Ltd
- 16.2.13.1. Overview
- 16.2.13.2. Products
- 16.2.13.3. SWOT Analysis
- 16.2.13.4. Recent Developments
- 16.2.13.5. Financials (Based on Availability)
- 16.2.1 ABB Ltd
List of Figures
- Figure 1: Global On-Grid Combined Heat and Power Market Revenue Breakdown (Million, %) by Region 2024 & 2032
- Figure 2: Global On-Grid Combined Heat and Power Market Volume Breakdown (Gigawatt, %) by Region 2024 & 2032
- Figure 3: North America On-Grid Combined Heat and Power Market Revenue (Million), by Country 2024 & 2032
- Figure 4: North America On-Grid Combined Heat and Power Market Volume (Gigawatt), by Country 2024 & 2032
- Figure 5: North America On-Grid Combined Heat and Power Market Revenue Share (%), by Country 2024 & 2032
- Figure 6: North America On-Grid Combined Heat and Power Market Volume Share (%), by Country 2024 & 2032
- Figure 7: Europe On-Grid Combined Heat and Power Market Revenue (Million), by Country 2024 & 2032
- Figure 8: Europe On-Grid Combined Heat and Power Market Volume (Gigawatt), by Country 2024 & 2032
- Figure 9: Europe On-Grid Combined Heat and Power Market Revenue Share (%), by Country 2024 & 2032
- Figure 10: Europe On-Grid Combined Heat and Power Market Volume Share (%), by Country 2024 & 2032
- Figure 11: Asia Pacific On-Grid Combined Heat and Power Market Revenue (Million), by Country 2024 & 2032
- Figure 12: Asia Pacific On-Grid Combined Heat and Power Market Volume (Gigawatt), by Country 2024 & 2032
- Figure 13: Asia Pacific On-Grid Combined Heat and Power Market Revenue Share (%), by Country 2024 & 2032
- Figure 14: Asia Pacific On-Grid Combined Heat and Power Market Volume Share (%), by Country 2024 & 2032
- Figure 15: South America On-Grid Combined Heat and Power Market Revenue (Million), by Country 2024 & 2032
- Figure 16: South America On-Grid Combined Heat and Power Market Volume (Gigawatt), by Country 2024 & 2032
- Figure 17: South America On-Grid Combined Heat and Power Market Revenue Share (%), by Country 2024 & 2032
- Figure 18: South America On-Grid Combined Heat and Power Market Volume Share (%), by Country 2024 & 2032
- Figure 19: MEA On-Grid Combined Heat and Power Market Revenue (Million), by Country 2024 & 2032
- Figure 20: MEA On-Grid Combined Heat and Power Market Volume (Gigawatt), by Country 2024 & 2032
- Figure 21: MEA On-Grid Combined Heat and Power Market Revenue Share (%), by Country 2024 & 2032
- Figure 22: MEA On-Grid Combined Heat and Power Market Volume Share (%), by Country 2024 & 2032
- Figure 23: North America On-Grid Combined Heat and Power Market Revenue (Million), by Application 2024 & 2032
- Figure 24: North America On-Grid Combined Heat and Power Market Volume (Gigawatt), by Application 2024 & 2032
- Figure 25: North America On-Grid Combined Heat and Power Market Revenue Share (%), by Application 2024 & 2032
- Figure 26: North America On-Grid Combined Heat and Power Market Volume Share (%), by Application 2024 & 2032
- Figure 27: North America On-Grid Combined Heat and Power Market Revenue (Million), by Fuel Type 2024 & 2032
- Figure 28: North America On-Grid Combined Heat and Power Market Volume (Gigawatt), by Fuel Type 2024 & 2032
- Figure 29: North America On-Grid Combined Heat and Power Market Revenue Share (%), by Fuel Type 2024 & 2032
- Figure 30: North America On-Grid Combined Heat and Power Market Volume Share (%), by Fuel Type 2024 & 2032
- Figure 31: North America On-Grid Combined Heat and Power Market Revenue (Million), by Country 2024 & 2032
- Figure 32: North America On-Grid Combined Heat and Power Market Volume (Gigawatt), by Country 2024 & 2032
- Figure 33: North America On-Grid Combined Heat and Power Market Revenue Share (%), by Country 2024 & 2032
- Figure 34: North America On-Grid Combined Heat and Power Market Volume Share (%), by Country 2024 & 2032
- Figure 35: Europe On-Grid Combined Heat and Power Market Revenue (Million), by Application 2024 & 2032
- Figure 36: Europe On-Grid Combined Heat and Power Market Volume (Gigawatt), by Application 2024 & 2032
- Figure 37: Europe On-Grid Combined Heat and Power Market Revenue Share (%), by Application 2024 & 2032
- Figure 38: Europe On-Grid Combined Heat and Power Market Volume Share (%), by Application 2024 & 2032
- Figure 39: Europe On-Grid Combined Heat and Power Market Revenue (Million), by Fuel Type 2024 & 2032
- Figure 40: Europe On-Grid Combined Heat and Power Market Volume (Gigawatt), by Fuel Type 2024 & 2032
- Figure 41: Europe On-Grid Combined Heat and Power Market Revenue Share (%), by Fuel Type 2024 & 2032
- Figure 42: Europe On-Grid Combined Heat and Power Market Volume Share (%), by Fuel Type 2024 & 2032
- Figure 43: Europe On-Grid Combined Heat and Power Market Revenue (Million), by Country 2024 & 2032
- Figure 44: Europe On-Grid Combined Heat and Power Market Volume (Gigawatt), by Country 2024 & 2032
- Figure 45: Europe On-Grid Combined Heat and Power Market Revenue Share (%), by Country 2024 & 2032
- Figure 46: Europe On-Grid Combined Heat and Power Market Volume Share (%), by Country 2024 & 2032
- Figure 47: Asia Pacific On-Grid Combined Heat and Power Market Revenue (Million), by Application 2024 & 2032
- Figure 48: Asia Pacific On-Grid Combined Heat and Power Market Volume (Gigawatt), by Application 2024 & 2032
- Figure 49: Asia Pacific On-Grid Combined Heat and Power Market Revenue Share (%), by Application 2024 & 2032
- Figure 50: Asia Pacific On-Grid Combined Heat and Power Market Volume Share (%), by Application 2024 & 2032
- Figure 51: Asia Pacific On-Grid Combined Heat and Power Market Revenue (Million), by Fuel Type 2024 & 2032
- Figure 52: Asia Pacific On-Grid Combined Heat and Power Market Volume (Gigawatt), by Fuel Type 2024 & 2032
- Figure 53: Asia Pacific On-Grid Combined Heat and Power Market Revenue Share (%), by Fuel Type 2024 & 2032
- Figure 54: Asia Pacific On-Grid Combined Heat and Power Market Volume Share (%), by Fuel Type 2024 & 2032
- Figure 55: Asia Pacific On-Grid Combined Heat and Power Market Revenue (Million), by Country 2024 & 2032
- Figure 56: Asia Pacific On-Grid Combined Heat and Power Market Volume (Gigawatt), by Country 2024 & 2032
- Figure 57: Asia Pacific On-Grid Combined Heat and Power Market Revenue Share (%), by Country 2024 & 2032
- Figure 58: Asia Pacific On-Grid Combined Heat and Power Market Volume Share (%), by Country 2024 & 2032
- Figure 59: South America On-Grid Combined Heat and Power Market Revenue (Million), by Application 2024 & 2032
- Figure 60: South America On-Grid Combined Heat and Power Market Volume (Gigawatt), by Application 2024 & 2032
- Figure 61: South America On-Grid Combined Heat and Power Market Revenue Share (%), by Application 2024 & 2032
- Figure 62: South America On-Grid Combined Heat and Power Market Volume Share (%), by Application 2024 & 2032
- Figure 63: South America On-Grid Combined Heat and Power Market Revenue (Million), by Fuel Type 2024 & 2032
- Figure 64: South America On-Grid Combined Heat and Power Market Volume (Gigawatt), by Fuel Type 2024 & 2032
- Figure 65: South America On-Grid Combined Heat and Power Market Revenue Share (%), by Fuel Type 2024 & 2032
- Figure 66: South America On-Grid Combined Heat and Power Market Volume Share (%), by Fuel Type 2024 & 2032
- Figure 67: South America On-Grid Combined Heat and Power Market Revenue (Million), by Country 2024 & 2032
- Figure 68: South America On-Grid Combined Heat and Power Market Volume (Gigawatt), by Country 2024 & 2032
- Figure 69: South America On-Grid Combined Heat and Power Market Revenue Share (%), by Country 2024 & 2032
- Figure 70: South America On-Grid Combined Heat and Power Market Volume Share (%), by Country 2024 & 2032
- Figure 71: Middle East On-Grid Combined Heat and Power Market Revenue (Million), by Application 2024 & 2032
- Figure 72: Middle East On-Grid Combined Heat and Power Market Volume (Gigawatt), by Application 2024 & 2032
- Figure 73: Middle East On-Grid Combined Heat and Power Market Revenue Share (%), by Application 2024 & 2032
- Figure 74: Middle East On-Grid Combined Heat and Power Market Volume Share (%), by Application 2024 & 2032
- Figure 75: Middle East On-Grid Combined Heat and Power Market Revenue (Million), by Fuel Type 2024 & 2032
- Figure 76: Middle East On-Grid Combined Heat and Power Market Volume (Gigawatt), by Fuel Type 2024 & 2032
- Figure 77: Middle East On-Grid Combined Heat and Power Market Revenue Share (%), by Fuel Type 2024 & 2032
- Figure 78: Middle East On-Grid Combined Heat and Power Market Volume Share (%), by Fuel Type 2024 & 2032
- Figure 79: Middle East On-Grid Combined Heat and Power Market Revenue (Million), by Country 2024 & 2032
- Figure 80: Middle East On-Grid Combined Heat and Power Market Volume (Gigawatt), by Country 2024 & 2032
- Figure 81: Middle East On-Grid Combined Heat and Power Market Revenue Share (%), by Country 2024 & 2032
- Figure 82: Middle East On-Grid Combined Heat and Power Market Volume Share (%), by Country 2024 & 2032
List of Tables
- Table 1: Global On-Grid Combined Heat and Power Market Revenue Million Forecast, by Region 2019 & 2032
- Table 2: Global On-Grid Combined Heat and Power Market Volume Gigawatt Forecast, by Region 2019 & 2032
- Table 3: Global On-Grid Combined Heat and Power Market Revenue Million Forecast, by Application 2019 & 2032
- Table 4: Global On-Grid Combined Heat and Power Market Volume Gigawatt Forecast, by Application 2019 & 2032
- Table 5: Global On-Grid Combined Heat and Power Market Revenue Million Forecast, by Fuel Type 2019 & 2032
- Table 6: Global On-Grid Combined Heat and Power Market Volume Gigawatt Forecast, by Fuel Type 2019 & 2032
- Table 7: Global On-Grid Combined Heat and Power Market Revenue Million Forecast, by Region 2019 & 2032
- Table 8: Global On-Grid Combined Heat and Power Market Volume Gigawatt Forecast, by Region 2019 & 2032
- Table 9: Global On-Grid Combined Heat and Power Market Revenue Million Forecast, by Country 2019 & 2032
- Table 10: Global On-Grid Combined Heat and Power Market Volume Gigawatt Forecast, by Country 2019 & 2032
- Table 11: United States On-Grid Combined Heat and Power Market Revenue (Million) Forecast, by Application 2019 & 2032
- Table 12: United States On-Grid Combined Heat and Power Market Volume (Gigawatt) Forecast, by Application 2019 & 2032
- Table 13: Canada On-Grid Combined Heat and Power Market Revenue (Million) Forecast, by Application 2019 & 2032
- Table 14: Canada On-Grid Combined Heat and Power Market Volume (Gigawatt) Forecast, by Application 2019 & 2032
- Table 15: Mexico On-Grid Combined Heat and Power Market Revenue (Million) Forecast, by Application 2019 & 2032
- Table 16: Mexico On-Grid Combined Heat and Power Market Volume (Gigawatt) Forecast, by Application 2019 & 2032
- Table 17: Global On-Grid Combined Heat and Power Market Revenue Million Forecast, by Country 2019 & 2032
- Table 18: Global On-Grid Combined Heat and Power Market Volume Gigawatt Forecast, by Country 2019 & 2032
- Table 19: Germany On-Grid Combined Heat and Power Market Revenue (Million) Forecast, by Application 2019 & 2032
- Table 20: Germany On-Grid Combined Heat and Power Market Volume (Gigawatt) Forecast, by Application 2019 & 2032
- Table 21: United Kingdom On-Grid Combined Heat and Power Market Revenue (Million) Forecast, by Application 2019 & 2032
- Table 22: United Kingdom On-Grid Combined Heat and Power Market Volume (Gigawatt) Forecast, by Application 2019 & 2032
- Table 23: France On-Grid Combined Heat and Power Market Revenue (Million) Forecast, by Application 2019 & 2032
- Table 24: France On-Grid Combined Heat and Power Market Volume (Gigawatt) Forecast, by Application 2019 & 2032
- Table 25: Spain On-Grid Combined Heat and Power Market Revenue (Million) Forecast, by Application 2019 & 2032
- Table 26: Spain On-Grid Combined Heat and Power Market Volume (Gigawatt) Forecast, by Application 2019 & 2032
- Table 27: Italy On-Grid Combined Heat and Power Market Revenue (Million) Forecast, by Application 2019 & 2032
- Table 28: Italy On-Grid Combined Heat and Power Market Volume (Gigawatt) Forecast, by Application 2019 & 2032
- Table 29: Spain On-Grid Combined Heat and Power Market Revenue (Million) Forecast, by Application 2019 & 2032
- Table 30: Spain On-Grid Combined Heat and Power Market Volume (Gigawatt) Forecast, by Application 2019 & 2032
- Table 31: Belgium On-Grid Combined Heat and Power Market Revenue (Million) Forecast, by Application 2019 & 2032
- Table 32: Belgium On-Grid Combined Heat and Power Market Volume (Gigawatt) Forecast, by Application 2019 & 2032
- Table 33: Netherland On-Grid Combined Heat and Power Market Revenue (Million) Forecast, by Application 2019 & 2032
- Table 34: Netherland On-Grid Combined Heat and Power Market Volume (Gigawatt) Forecast, by Application 2019 & 2032
- Table 35: Nordics On-Grid Combined Heat and Power Market Revenue (Million) Forecast, by Application 2019 & 2032
- Table 36: Nordics On-Grid Combined Heat and Power Market Volume (Gigawatt) Forecast, by Application 2019 & 2032
- Table 37: Rest of Europe On-Grid Combined Heat and Power Market Revenue (Million) Forecast, by Application 2019 & 2032
- Table 38: Rest of Europe On-Grid Combined Heat and Power Market Volume (Gigawatt) Forecast, by Application 2019 & 2032
- Table 39: Global On-Grid Combined Heat and Power Market Revenue Million Forecast, by Country 2019 & 2032
- Table 40: Global On-Grid Combined Heat and Power Market Volume Gigawatt Forecast, by Country 2019 & 2032
- Table 41: China On-Grid Combined Heat and Power Market Revenue (Million) Forecast, by Application 2019 & 2032
- Table 42: China On-Grid Combined Heat and Power Market Volume (Gigawatt) Forecast, by Application 2019 & 2032
- Table 43: Japan On-Grid Combined Heat and Power Market Revenue (Million) Forecast, by Application 2019 & 2032
- Table 44: Japan On-Grid Combined Heat and Power Market Volume (Gigawatt) Forecast, by Application 2019 & 2032
- Table 45: India On-Grid Combined Heat and Power Market Revenue (Million) Forecast, by Application 2019 & 2032
- Table 46: India On-Grid Combined Heat and Power Market Volume (Gigawatt) Forecast, by Application 2019 & 2032
- Table 47: South Korea On-Grid Combined Heat and Power Market Revenue (Million) Forecast, by Application 2019 & 2032
- Table 48: South Korea On-Grid Combined Heat and Power Market Volume (Gigawatt) Forecast, by Application 2019 & 2032
- Table 49: Southeast Asia On-Grid Combined Heat and Power Market Revenue (Million) Forecast, by Application 2019 & 2032
- Table 50: Southeast Asia On-Grid Combined Heat and Power Market Volume (Gigawatt) Forecast, by Application 2019 & 2032
- Table 51: Australia On-Grid Combined Heat and Power Market Revenue (Million) Forecast, by Application 2019 & 2032
- Table 52: Australia On-Grid Combined Heat and Power Market Volume (Gigawatt) Forecast, by Application 2019 & 2032
- Table 53: Indonesia On-Grid Combined Heat and Power Market Revenue (Million) Forecast, by Application 2019 & 2032
- Table 54: Indonesia On-Grid Combined Heat and Power Market Volume (Gigawatt) Forecast, by Application 2019 & 2032
- Table 55: Phillipes On-Grid Combined Heat and Power Market Revenue (Million) Forecast, by Application 2019 & 2032
- Table 56: Phillipes On-Grid Combined Heat and Power Market Volume (Gigawatt) Forecast, by Application 2019 & 2032
- Table 57: Singapore On-Grid Combined Heat and Power Market Revenue (Million) Forecast, by Application 2019 & 2032
- Table 58: Singapore On-Grid Combined Heat and Power Market Volume (Gigawatt) Forecast, by Application 2019 & 2032
- Table 59: Thailandc On-Grid Combined Heat and Power Market Revenue (Million) Forecast, by Application 2019 & 2032
- Table 60: Thailandc On-Grid Combined Heat and Power Market Volume (Gigawatt) Forecast, by Application 2019 & 2032
- Table 61: Rest of Asia Pacific On-Grid Combined Heat and Power Market Revenue (Million) Forecast, by Application 2019 & 2032
- Table 62: Rest of Asia Pacific On-Grid Combined Heat and Power Market Volume (Gigawatt) Forecast, by Application 2019 & 2032
- Table 63: Global On-Grid Combined Heat and Power Market Revenue Million Forecast, by Country 2019 & 2032
- Table 64: Global On-Grid Combined Heat and Power Market Volume Gigawatt Forecast, by Country 2019 & 2032
- Table 65: Brazil On-Grid Combined Heat and Power Market Revenue (Million) Forecast, by Application 2019 & 2032
- Table 66: Brazil On-Grid Combined Heat and Power Market Volume (Gigawatt) Forecast, by Application 2019 & 2032
- Table 67: Argentina On-Grid Combined Heat and Power Market Revenue (Million) Forecast, by Application 2019 & 2032
- Table 68: Argentina On-Grid Combined Heat and Power Market Volume (Gigawatt) Forecast, by Application 2019 & 2032
- Table 69: Peru On-Grid Combined Heat and Power Market Revenue (Million) Forecast, by Application 2019 & 2032
- Table 70: Peru On-Grid Combined Heat and Power Market Volume (Gigawatt) Forecast, by Application 2019 & 2032
- Table 71: Chile On-Grid Combined Heat and Power Market Revenue (Million) Forecast, by Application 2019 & 2032
- Table 72: Chile On-Grid Combined Heat and Power Market Volume (Gigawatt) Forecast, by Application 2019 & 2032
- Table 73: Colombia On-Grid Combined Heat and Power Market Revenue (Million) Forecast, by Application 2019 & 2032
- Table 74: Colombia On-Grid Combined Heat and Power Market Volume (Gigawatt) Forecast, by Application 2019 & 2032
- Table 75: Ecuador On-Grid Combined Heat and Power Market Revenue (Million) Forecast, by Application 2019 & 2032
- Table 76: Ecuador On-Grid Combined Heat and Power Market Volume (Gigawatt) Forecast, by Application 2019 & 2032
- Table 77: Venezuela On-Grid Combined Heat and Power Market Revenue (Million) Forecast, by Application 2019 & 2032
- Table 78: Venezuela On-Grid Combined Heat and Power Market Volume (Gigawatt) Forecast, by Application 2019 & 2032
- Table 79: Rest of South America On-Grid Combined Heat and Power Market Revenue (Million) Forecast, by Application 2019 & 2032
- Table 80: Rest of South America On-Grid Combined Heat and Power Market Volume (Gigawatt) Forecast, by Application 2019 & 2032
- Table 81: Global On-Grid Combined Heat and Power Market Revenue Million Forecast, by Country 2019 & 2032
- Table 82: Global On-Grid Combined Heat and Power Market Volume Gigawatt Forecast, by Country 2019 & 2032
- Table 83: United Arab Emirates On-Grid Combined Heat and Power Market Revenue (Million) Forecast, by Application 2019 & 2032
- Table 84: United Arab Emirates On-Grid Combined Heat and Power Market Volume (Gigawatt) Forecast, by Application 2019 & 2032
- Table 85: Saudi Arabia On-Grid Combined Heat and Power Market Revenue (Million) Forecast, by Application 2019 & 2032
- Table 86: Saudi Arabia On-Grid Combined Heat and Power Market Volume (Gigawatt) Forecast, by Application 2019 & 2032
- Table 87: South Africa On-Grid Combined Heat and Power Market Revenue (Million) Forecast, by Application 2019 & 2032
- Table 88: South Africa On-Grid Combined Heat and Power Market Volume (Gigawatt) Forecast, by Application 2019 & 2032
- Table 89: Rest of Middle East and Africa On-Grid Combined Heat and Power Market Revenue (Million) Forecast, by Application 2019 & 2032
- Table 90: Rest of Middle East and Africa On-Grid Combined Heat and Power Market Volume (Gigawatt) Forecast, by Application 2019 & 2032
- Table 91: Global On-Grid Combined Heat and Power Market Revenue Million Forecast, by Application 2019 & 2032
- Table 92: Global On-Grid Combined Heat and Power Market Volume Gigawatt Forecast, by Application 2019 & 2032
- Table 93: Global On-Grid Combined Heat and Power Market Revenue Million Forecast, by Fuel Type 2019 & 2032
- Table 94: Global On-Grid Combined Heat and Power Market Volume Gigawatt Forecast, by Fuel Type 2019 & 2032
- Table 95: Global On-Grid Combined Heat and Power Market Revenue Million Forecast, by Country 2019 & 2032
- Table 96: Global On-Grid Combined Heat and Power Market Volume Gigawatt Forecast, by Country 2019 & 2032
- Table 97: Global On-Grid Combined Heat and Power Market Revenue Million Forecast, by Application 2019 & 2032
- Table 98: Global On-Grid Combined Heat and Power Market Volume Gigawatt Forecast, by Application 2019 & 2032
- Table 99: Global On-Grid Combined Heat and Power Market Revenue Million Forecast, by Fuel Type 2019 & 2032
- Table 100: Global On-Grid Combined Heat and Power Market Volume Gigawatt Forecast, by Fuel Type 2019 & 2032
- Table 101: Global On-Grid Combined Heat and Power Market Revenue Million Forecast, by Country 2019 & 2032
- Table 102: Global On-Grid Combined Heat and Power Market Volume Gigawatt Forecast, by Country 2019 & 2032
- Table 103: Global On-Grid Combined Heat and Power Market Revenue Million Forecast, by Application 2019 & 2032
- Table 104: Global On-Grid Combined Heat and Power Market Volume Gigawatt Forecast, by Application 2019 & 2032
- Table 105: Global On-Grid Combined Heat and Power Market Revenue Million Forecast, by Fuel Type 2019 & 2032
- Table 106: Global On-Grid Combined Heat and Power Market Volume Gigawatt Forecast, by Fuel Type 2019 & 2032
- Table 107: Global On-Grid Combined Heat and Power Market Revenue Million Forecast, by Country 2019 & 2032
- Table 108: Global On-Grid Combined Heat and Power Market Volume Gigawatt Forecast, by Country 2019 & 2032
- Table 109: Global On-Grid Combined Heat and Power Market Revenue Million Forecast, by Application 2019 & 2032
- Table 110: Global On-Grid Combined Heat and Power Market Volume Gigawatt Forecast, by Application 2019 & 2032
- Table 111: Global On-Grid Combined Heat and Power Market Revenue Million Forecast, by Fuel Type 2019 & 2032
- Table 112: Global On-Grid Combined Heat and Power Market Volume Gigawatt Forecast, by Fuel Type 2019 & 2032
- Table 113: Global On-Grid Combined Heat and Power Market Revenue Million Forecast, by Country 2019 & 2032
- Table 114: Global On-Grid Combined Heat and Power Market Volume Gigawatt Forecast, by Country 2019 & 2032
- Table 115: Global On-Grid Combined Heat and Power Market Revenue Million Forecast, by Application 2019 & 2032
- Table 116: Global On-Grid Combined Heat and Power Market Volume Gigawatt Forecast, by Application 2019 & 2032
- Table 117: Global On-Grid Combined Heat and Power Market Revenue Million Forecast, by Fuel Type 2019 & 2032
- Table 118: Global On-Grid Combined Heat and Power Market Volume Gigawatt Forecast, by Fuel Type 2019 & 2032
- Table 119: Global On-Grid Combined Heat and Power Market Revenue Million Forecast, by Country 2019 & 2032
- Table 120: Global On-Grid Combined Heat and Power Market Volume Gigawatt Forecast, by Country 2019 & 2032
Frequently Asked Questions
1. What is the projected Compound Annual Growth Rate (CAGR) of the On-Grid Combined Heat and Power Market?
The projected CAGR is approximately > 6.00%.
2. Which companies are prominent players in the On-Grid Combined Heat and Power Market?
Key companies in the market include ABB Ltd, FuelCell Energy Inc, Viessmann Werke, Aegis Energy Services LLC, Bosch Thermotechnology GmbH, Mitsubishi Electric Corporation, Caterpillar Inc, Seimens AG, Centrica PLC, Wartsila Oyj Abp, MAN Diesel & Turbo SE, General Electric Company, Kawasaki Heavy Industries Ltd.
3. What are the main segments of the On-Grid Combined Heat and Power Market?
The market segments include Application, Fuel Type.
4. Can you provide details about the market size?
The market size is estimated to be USD XX Million as of 2022.
5. What are some drivers contributing to market growth?
Supportive Government Policies and Incentives4.; Environmental Concerns.
6. What are the notable trends driving market growth?
Biomass Based Combined Heat and Power to Witness a Significant Growth.
7. Are there any restraints impacting market growth?
Fossil Fuel Subsidies.
8. Can you provide examples of recent developments in the market?
N/A
9. What pricing options are available for accessing the report?
Pricing options include single-user, multi-user, and enterprise licenses priced at USD 4750, USD 5250, and USD 8750 respectively.
10. Is the market size provided in terms of value or volume?
The market size is provided in terms of value, measured in Million and volume, measured in Gigawatt.
11. Are there any specific market keywords associated with the report?
Yes, the market keyword associated with the report is "On-Grid Combined Heat and Power Market," which aids in identifying and referencing the specific market segment covered.
12. How do I determine which pricing option suits my needs best?
The pricing options vary based on user requirements and access needs. Individual users may opt for single-user licenses, while businesses requiring broader access may choose multi-user or enterprise licenses for cost-effective access to the report.
13. Are there any additional resources or data provided in the On-Grid Combined Heat and Power Market report?
While the report offers comprehensive insights, it's advisable to review the specific contents or supplementary materials provided to ascertain if additional resources or data are available.
14. How can I stay updated on further developments or reports in the On-Grid Combined Heat and Power Market?
To stay informed about further developments, trends, and reports in the On-Grid Combined Heat and Power Market, consider subscribing to industry newsletters, following relevant companies and organizations, or regularly checking reputable industry news sources and publications.
Methodology
Step 1 - Identification of Relevant Samples Size from Population Database


Step 2 - Approaches for Defining Global Market Size (Value, Volume* & Price*)

Note*: In applicable scenarios
Step 3 - Data Sources
Primary Research
- Web Analytics
- Survey Reports
- Research Institute
- Latest Research Reports
- Opinion Leaders
Secondary Research
- Annual Reports
- White Paper
- Latest Press Release
- Industry Association
- Paid Database
- Investor Presentations

Step 4 - Data Triangulation
Involves using different sources of information in order to increase the validity of a study
These sources are likely to be stakeholders in a program - participants, other researchers, program staff, other community members, and so on.
Then we put all data in single framework & apply various statistical tools to find out the dynamic on the market.
During the analysis stage, feedback from the stakeholder groups would be compared to determine areas of agreement as well as areas of divergence


