
Key Insights
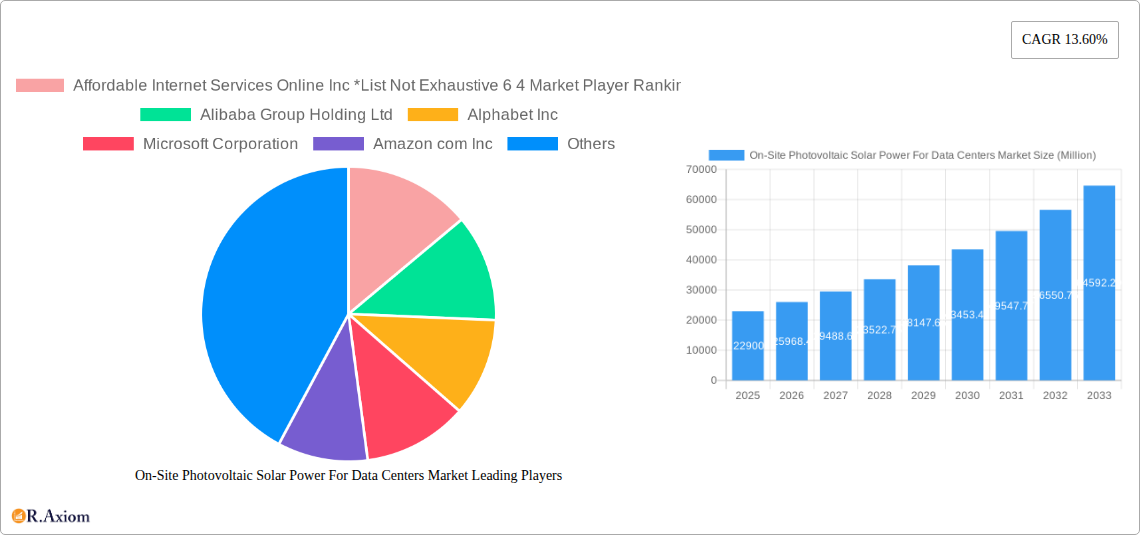
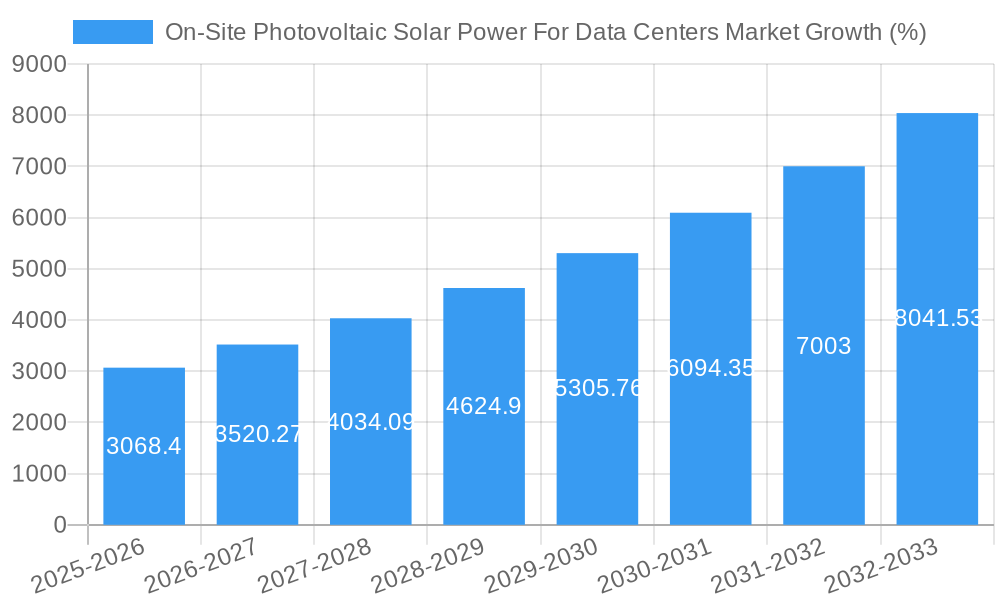
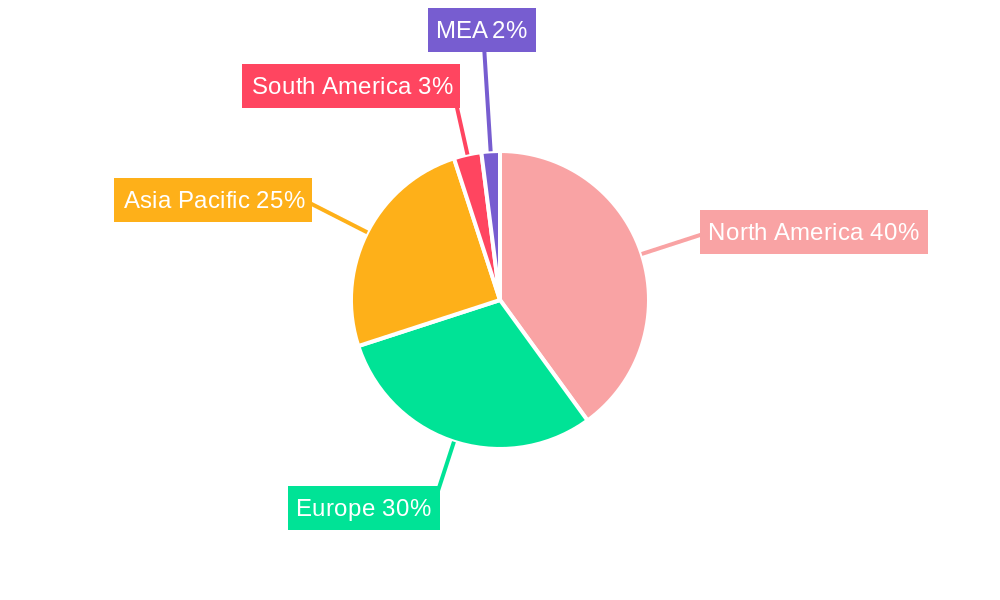
The On-Site Photovoltaic Solar Power for Data Centers market is experiencing robust growth, projected to reach $22.90 billion in 2025 and exhibiting a Compound Annual Growth Rate (CAGR) of 13.60%. This expansion is fueled by several key drivers. The increasing demand for renewable energy sources to mitigate carbon footprints and reduce operational costs for data centers is a primary factor. Furthermore, declining solar panel prices and technological advancements leading to higher efficiency and longer lifespans of thin-film and crystalline solar cells are making on-site solar power increasingly cost-effective. Government incentives and regulations promoting renewable energy adoption in various regions, particularly in North America and Europe, further stimulate market growth. The market segmentation reveals strong demand across various applications, with data centers, telecom towers, and other commercial applications leading the way. Key players like Alibaba, Alphabet, Microsoft, Amazon, and Facebook are actively integrating solar power solutions, driving innovation and wider adoption. The geographically diverse market shows significant potential across North America (driven by strong government support and a large data center concentration), Europe (with increasing environmental regulations), and the Asia-Pacific region (fueled by rapid data center expansion in China and India).
However, market restraints include the high initial investment costs associated with installing solar power systems, land availability limitations near data center locations, and potential intermittency issues related to solar power generation. Despite these challenges, the long-term cost savings and environmental benefits associated with on-site solar power are expected to outweigh these limitations, ensuring continued market expansion. The forecast period (2025-2033) promises significant growth driven by technological progress, supportive policies, and growing environmental consciousness within the data center industry. The focus will likely shift toward optimizing energy storage solutions to address solar power intermittency and maximizing energy efficiency within data center operations to fully leverage on-site solar power generation.
On-Site Photovoltaic Solar Power For Data Centers Market: A Comprehensive Report (2019-2033)
This comprehensive report provides an in-depth analysis of the On-Site Photovoltaic Solar Power for Data Centers market, offering valuable insights for stakeholders across the value chain. With a study period spanning 2019-2033, a base year of 2025, and a forecast period of 2025-2033, this report leverages historical data (2019-2024) to predict future market trends and opportunities. The report covers market sizing, segmentation, key players, technological advancements, and emerging trends, enabling informed decision-making and strategic planning. The total market size in 2025 is estimated at xx Million.
On-Site Photovoltaic Solar Power For Data Centers Market Concentration & Innovation
This section analyzes the competitive landscape of the on-site photovoltaic solar power market for data centers, examining market concentration, innovation drivers, regulatory frameworks, product substitutes, end-user trends, and mergers & acquisitions (M&A) activities.
The market exhibits a moderately concentrated structure, with a few major players holding significant market share. While precise market share figures for individual companies are proprietary, key players like Alibaba Group Holding Ltd, Alphabet Inc, Microsoft Corporation, Amazon com Inc, Facebook Inc, and Dell Technologies Inc are prominent. Affordable Internet Services Online Inc is also listed among the top 6 market players. Innovation is driven by advancements in solar cell technology (thin-film and crystalline), energy storage solutions, and smart grid integration. Regulatory frameworks focused on renewable energy targets and carbon emission reduction significantly influence market growth. While traditional grid power remains a substitute, increasing electricity costs and environmental concerns drive adoption of on-site solar. End-user trends reflect a growing preference for sustainable and cost-effective power solutions. M&A activity is expected to increase, with deal values ranging from xx Million to xx Million, driven by strategic acquisitions to expand market share and technological capabilities.
On-Site Photovoltaic Solar Power For Data Centers Market Industry Trends & Insights
This section delves into the dynamic trends shaping the on-site photovoltaic solar power market for data centers. The market is experiencing robust growth, driven by several factors. The increasing demand for renewable energy sources, stringent environmental regulations, and escalating electricity costs are pushing data center operators to adopt on-site solar solutions. Technological advancements, such as higher efficiency solar cells and improved energy storage systems, are further accelerating market expansion. The global market is expected to exhibit a CAGR of xx% during the forecast period (2025-2033). Market penetration is increasing steadily, with a significant portion of new data center constructions incorporating on-site solar power systems. Competitive dynamics are marked by both established players and emerging entrants vying for market share, leading to price competitiveness and innovation. Consumer preferences are increasingly leaning toward environmentally friendly solutions, further fueling market growth.
Dominant Markets & Segments in On-Site Photovoltaic Solar Power For Data Centers Market
This section identifies the dominant regions, countries, and market segments within the on-site photovoltaic solar power market for data centers.
Type:
- Crystalline Solar Cells: This segment currently holds the largest market share due to their higher efficiency and established technology. Growth is expected to continue, driven by ongoing improvements in efficiency and cost reductions.
- Thin-film Solar Cells: This segment is experiencing significant growth, particularly in applications requiring flexible and lightweight solar panels. Technological advancements are improving efficiency, making them more competitive.
Application:
- Data Centers: This is the primary application segment, driven by the high energy consumption of data centers and the increasing need for sustainable power solutions. Government incentives and corporate sustainability goals are key growth drivers.
- Telecom Towers: This segment is experiencing notable growth due to the increasing number of telecom towers and the need for reliable power sources in remote locations.
- Other Commercial Applications: This segment includes various commercial and industrial facilities adopting on-site solar power systems. Government policies promoting renewable energy and increasing energy costs are driving growth.
The North American and European regions are currently the most dominant markets, driven by robust government support for renewable energy, a strong focus on environmental sustainability, and the high concentration of data centers and other commercial facilities. However, Asia-Pacific is expected to witness significant growth in the coming years due to rapid economic development, increasing energy demand, and government initiatives promoting renewable energy adoption.
On-Site Photovoltaic Solar Power For Data Centers Market Product Developments
Recent product innovations focus on enhancing solar cell efficiency, developing integrated energy storage systems, and improving the overall system's reliability and lifespan. Manufacturers are incorporating advanced technologies like AI-powered optimization and smart grid integration to maximize energy output and efficiency. These advancements are resulting in cost-effective and more efficient on-site solar power solutions tailored to the specific energy needs of data centers and other commercial applications.
Report Scope & Segmentation Analysis
This report segments the on-site photovoltaic solar power market for data centers by type (thin-film solar cells and crystalline solar cells) and application (data centers, telecom towers, and other commercial applications). Each segment's growth projection is based on detailed analysis of historical data, market trends, and future forecasts. The report also examines the competitive dynamics within each segment, including market share, key players, and potential opportunities. Market sizes are provided for each segment for the historical period (2019-2024) and forecasted period (2025-2033), along with growth rates and CAGR.
Key Drivers of On-Site Photovoltaic Solar Power For Data Centers Market Growth
Several key factors drive the growth of the on-site photovoltaic solar power market for data centers. Firstly, the increasing demand for renewable energy, coupled with government incentives and regulations promoting its adoption, is a significant driver. Secondly, the rising cost of electricity and the need for energy independence are compelling data center operators to invest in on-site solar power solutions. Thirdly, technological advancements, resulting in higher efficiency solar cells and improved energy storage systems, are making solar power more economically viable.
Challenges in the On-Site Photovoltaic Solar Power For Data Centers Market Sector
Several challenges hinder the growth of the on-site photovoltaic solar power market for data centers. High initial investment costs remain a barrier for some organizations. Intermittency of solar power and the need for effective energy storage solutions pose challenges. Regulatory hurdles and permitting processes can also delay project implementation. Finally, competition from traditional grid power and other renewable energy sources presents challenges to market penetration. These challenges are estimated to impact the market growth by approximately xx% during the forecast period.
Emerging Opportunities in On-Site Photovoltaic Solar Power For Data Centers Market
Emerging opportunities exist in integrating advanced energy storage solutions with on-site solar power systems to improve reliability and reduce grid dependency. The development of more efficient and cost-effective solar cells, coupled with advancements in artificial intelligence for optimized energy management, presents substantial growth potential. Expansion into new markets, particularly in developing economies with high energy demands, offers significant opportunities. Furthermore, partnerships between data center operators and renewable energy providers can facilitate quicker adoption and drive market growth.
Leading Players in the On-Site Photovoltaic Solar Power For Data Centers Market Market
- Affordable Internet Services Online Inc
- Alibaba Group Holding Ltd
- Alphabet Inc
- Microsoft Corporation
- Amazon com Inc
- Facebook Inc
- Dell Technologies Inc
Key Developments in On-Site Photovoltaic Solar Power For Data Centers Market Industry
- September 2023: Power Capital Renewable Energy (PCRE) signed a 58 MW PPA with Google to power its Irish data center and offices.
- August 2023: SCC installed a 737kWp solar PV system at its Birmingham data center, covering over 5% of its energy needs.
Strategic Outlook for On-Site Photovoltaic Solar Power For Data Centers Market Market
The future of the on-site photovoltaic solar power market for data centers is promising. Continued technological advancements, coupled with supportive government policies and increasing awareness of environmental sustainability, will drive significant growth. The market is poised for expansion, particularly in emerging economies, where the demand for reliable and sustainable power sources is rapidly increasing. Strategic partnerships and collaborations within the industry will further accelerate market development and innovation.
On-Site Photovoltaic Solar Power For Data Centers Market Segmentation
- 1. Production Analysis
- 2. Consumption Analysis
- 3. Import Market Analysis (Value & Volume)
- 4. Export Market Analysis (Value & Volume)
- 5. Price Trend Analysis
On-Site Photovoltaic Solar Power For Data Centers Market Segmentation By Geography
-
1. North America
- 1.1. United States
- 1.2. Canada
- 1.3. Rest of North America
-
2. Europe
- 2.1. Germany
- 2.2. France
- 2.3. United Kingdom
- 2.4. Italy
- 2.5. Spain
- 2.6. NORDIC
- 2.7. Turkey
- 2.8. Russia
- 2.9. Rest of Europe
-
3. Asia Pacific
- 3.1. China
- 3.2. India
- 3.3. Japan
- 3.4. Australia
- 3.5. Malaysia
- 3.6. Thailand
- 3.7. Indonesia
- 3.8. Vietnam
- 3.9. Rest of Asia Pacific
-
4. South America
- 4.1. Brazil
- 4.2. Argentina
- 4.3. Chile
- 4.4. Colombia
- 4.5. Rest of South America
-
5. Middle East and Africa
- 5.1. United Arab Emirates
- 5.2. Qatar
- 5.3. Saudi Arabia
- 5.4. South Africa
- 5.5. Nigeria
- 5.6. Egypt
On-Site Photovoltaic Solar Power For Data Centers Market REPORT HIGHLIGHTS
| Aspects | Details |
|---|---|
| Study Period | 2019-2033 |
| Base Year | 2024 |
| Estimated Year | 2025 |
| Forecast Period | 2025-2033 |
| Historical Period | 2019-2024 |
| Growth Rate | CAGR of 13.60% from 2019-2033 |
| Segmentation |
|
Table of Contents
- 1. Introduction
- 1.1. Research Scope
- 1.2. Market Segmentation
- 1.3. Research Methodology
- 1.4. Definitions and Assumptions
- 2. Executive Summary
- 2.1. Introduction
- 3. Market Dynamics
- 3.1. Introduction
- 3.2. Market Drivers
- 3.2.1. 4.; Decreasing Solar Power Installation Costs 4.; Growing focus on Implementing Sustainable Business Practices
- 3.3. Market Restrains
- 3.3.1. 4.; Lack of Space for Small Data Centers to Install Solar Panels
- 3.4. Market Trends
- 3.4.1. Decrease in Solar Power Installation Cost is Likely to Drive the Market
- 4. Market Factor Analysis
- 4.1. Porters Five Forces
- 4.2. Supply/Value Chain
- 4.3. PESTEL analysis
- 4.4. Market Entropy
- 4.5. Patent/Trademark Analysis
- 5. Global On-Site Photovoltaic Solar Power For Data Centers Market Analysis, Insights and Forecast, 2019-2031
- 5.1. Market Analysis, Insights and Forecast - by Production Analysis
- 5.2. Market Analysis, Insights and Forecast - by Consumption Analysis
- 5.3. Market Analysis, Insights and Forecast - by Import Market Analysis (Value & Volume)
- 5.4. Market Analysis, Insights and Forecast - by Export Market Analysis (Value & Volume)
- 5.5. Market Analysis, Insights and Forecast - by Price Trend Analysis
- 5.6. Market Analysis, Insights and Forecast - by Region
- 5.6.1. North America
- 5.6.2. Europe
- 5.6.3. Asia Pacific
- 5.6.4. South America
- 5.6.5. Middle East and Africa
- 5.1. Market Analysis, Insights and Forecast - by Production Analysis
- 6. North America On-Site Photovoltaic Solar Power For Data Centers Market Analysis, Insights and Forecast, 2019-2031
- 6.1. Market Analysis, Insights and Forecast - by Production Analysis
- 6.2. Market Analysis, Insights and Forecast - by Consumption Analysis
- 6.3. Market Analysis, Insights and Forecast - by Import Market Analysis (Value & Volume)
- 6.4. Market Analysis, Insights and Forecast - by Export Market Analysis (Value & Volume)
- 6.5. Market Analysis, Insights and Forecast - by Price Trend Analysis
- 6.1. Market Analysis, Insights and Forecast - by Production Analysis
- 7. Europe On-Site Photovoltaic Solar Power For Data Centers Market Analysis, Insights and Forecast, 2019-2031
- 7.1. Market Analysis, Insights and Forecast - by Production Analysis
- 7.2. Market Analysis, Insights and Forecast - by Consumption Analysis
- 7.3. Market Analysis, Insights and Forecast - by Import Market Analysis (Value & Volume)
- 7.4. Market Analysis, Insights and Forecast - by Export Market Analysis (Value & Volume)
- 7.5. Market Analysis, Insights and Forecast - by Price Trend Analysis
- 7.1. Market Analysis, Insights and Forecast - by Production Analysis
- 8. Asia Pacific On-Site Photovoltaic Solar Power For Data Centers Market Analysis, Insights and Forecast, 2019-2031
- 8.1. Market Analysis, Insights and Forecast - by Production Analysis
- 8.2. Market Analysis, Insights and Forecast - by Consumption Analysis
- 8.3. Market Analysis, Insights and Forecast - by Import Market Analysis (Value & Volume)
- 8.4. Market Analysis, Insights and Forecast - by Export Market Analysis (Value & Volume)
- 8.5. Market Analysis, Insights and Forecast - by Price Trend Analysis
- 8.1. Market Analysis, Insights and Forecast - by Production Analysis
- 9. South America On-Site Photovoltaic Solar Power For Data Centers Market Analysis, Insights and Forecast, 2019-2031
- 9.1. Market Analysis, Insights and Forecast - by Production Analysis
- 9.2. Market Analysis, Insights and Forecast - by Consumption Analysis
- 9.3. Market Analysis, Insights and Forecast - by Import Market Analysis (Value & Volume)
- 9.4. Market Analysis, Insights and Forecast - by Export Market Analysis (Value & Volume)
- 9.5. Market Analysis, Insights and Forecast - by Price Trend Analysis
- 9.1. Market Analysis, Insights and Forecast - by Production Analysis
- 10. Middle East and Africa On-Site Photovoltaic Solar Power For Data Centers Market Analysis, Insights and Forecast, 2019-2031
- 10.1. Market Analysis, Insights and Forecast - by Production Analysis
- 10.2. Market Analysis, Insights and Forecast - by Consumption Analysis
- 10.3. Market Analysis, Insights and Forecast - by Import Market Analysis (Value & Volume)
- 10.4. Market Analysis, Insights and Forecast - by Export Market Analysis (Value & Volume)
- 10.5. Market Analysis, Insights and Forecast - by Price Trend Analysis
- 10.1. Market Analysis, Insights and Forecast - by Production Analysis
- 11. North America On-Site Photovoltaic Solar Power For Data Centers Market Analysis, Insights and Forecast, 2019-2031
- 11.1. Market Analysis, Insights and Forecast - By Country/Sub-region
- 11.1.1 United States
- 11.1.2 Canada
- 11.1.3 Mexico
- 12. Europe On-Site Photovoltaic Solar Power For Data Centers Market Analysis, Insights and Forecast, 2019-2031
- 12.1. Market Analysis, Insights and Forecast - By Country/Sub-region
- 12.1.1 Germany
- 12.1.2 United Kingdom
- 12.1.3 France
- 12.1.4 Spain
- 12.1.5 Italy
- 12.1.6 Spain
- 12.1.7 Belgium
- 12.1.8 Netherland
- 12.1.9 Nordics
- 12.1.10 Rest of Europe
- 13. Asia Pacific On-Site Photovoltaic Solar Power For Data Centers Market Analysis, Insights and Forecast, 2019-2031
- 13.1. Market Analysis, Insights and Forecast - By Country/Sub-region
- 13.1.1 China
- 13.1.2 Japan
- 13.1.3 India
- 13.1.4 South Korea
- 13.1.5 Southeast Asia
- 13.1.6 Australia
- 13.1.7 Indonesia
- 13.1.8 Phillipes
- 13.1.9 Singapore
- 13.1.10 Thailandc
- 13.1.11 Rest of Asia Pacific
- 14. South America On-Site Photovoltaic Solar Power For Data Centers Market Analysis, Insights and Forecast, 2019-2031
- 14.1. Market Analysis, Insights and Forecast - By Country/Sub-region
- 14.1.1 Brazil
- 14.1.2 Argentina
- 14.1.3 Peru
- 14.1.4 Chile
- 14.1.5 Colombia
- 14.1.6 Ecuador
- 14.1.7 Venezuela
- 14.1.8 Rest of South America
- 15. MEA On-Site Photovoltaic Solar Power For Data Centers Market Analysis, Insights and Forecast, 2019-2031
- 15.1. Market Analysis, Insights and Forecast - By Country/Sub-region
- 15.1.1 United Arab Emirates
- 15.1.2 Saudi Arabia
- 15.1.3 South Africa
- 15.1.4 Rest of Middle East and Africa
- 16. Competitive Analysis
- 16.1. Global Market Share Analysis 2024
- 16.2. Company Profiles
- 16.2.1 Affordable Internet Services Online Inc *List Not Exhaustive 6 4 Market Player Rankin
- 16.2.1.1. Overview
- 16.2.1.2. Products
- 16.2.1.3. SWOT Analysis
- 16.2.1.4. Recent Developments
- 16.2.1.5. Financials (Based on Availability)
- 16.2.2 Alibaba Group Holding Ltd
- 16.2.2.1. Overview
- 16.2.2.2. Products
- 16.2.2.3. SWOT Analysis
- 16.2.2.4. Recent Developments
- 16.2.2.5. Financials (Based on Availability)
- 16.2.3 Alphabet Inc
- 16.2.3.1. Overview
- 16.2.3.2. Products
- 16.2.3.3. SWOT Analysis
- 16.2.3.4. Recent Developments
- 16.2.3.5. Financials (Based on Availability)
- 16.2.4 Microsoft Corporation
- 16.2.4.1. Overview
- 16.2.4.2. Products
- 16.2.4.3. SWOT Analysis
- 16.2.4.4. Recent Developments
- 16.2.4.5. Financials (Based on Availability)
- 16.2.5 Amazon com Inc
- 16.2.5.1. Overview
- 16.2.5.2. Products
- 16.2.5.3. SWOT Analysis
- 16.2.5.4. Recent Developments
- 16.2.5.5. Financials (Based on Availability)
- 16.2.6 Facebook Inc
- 16.2.6.1. Overview
- 16.2.6.2. Products
- 16.2.6.3. SWOT Analysis
- 16.2.6.4. Recent Developments
- 16.2.6.5. Financials (Based on Availability)
- 16.2.7 Dell Technologies Inc
- 16.2.7.1. Overview
- 16.2.7.2. Products
- 16.2.7.3. SWOT Analysis
- 16.2.7.4. Recent Developments
- 16.2.7.5. Financials (Based on Availability)
- 16.2.1 Affordable Internet Services Online Inc *List Not Exhaustive 6 4 Market Player Rankin
List of Figures
- Figure 1: Global On-Site Photovoltaic Solar Power For Data Centers Market Revenue Breakdown (Million, %) by Region 2024 & 2032
- Figure 2: North America On-Site Photovoltaic Solar Power For Data Centers Market Revenue (Million), by Country 2024 & 2032
- Figure 3: North America On-Site Photovoltaic Solar Power For Data Centers Market Revenue Share (%), by Country 2024 & 2032
- Figure 4: Europe On-Site Photovoltaic Solar Power For Data Centers Market Revenue (Million), by Country 2024 & 2032
- Figure 5: Europe On-Site Photovoltaic Solar Power For Data Centers Market Revenue Share (%), by Country 2024 & 2032
- Figure 6: Asia Pacific On-Site Photovoltaic Solar Power For Data Centers Market Revenue (Million), by Country 2024 & 2032
- Figure 7: Asia Pacific On-Site Photovoltaic Solar Power For Data Centers Market Revenue Share (%), by Country 2024 & 2032
- Figure 8: South America On-Site Photovoltaic Solar Power For Data Centers Market Revenue (Million), by Country 2024 & 2032
- Figure 9: South America On-Site Photovoltaic Solar Power For Data Centers Market Revenue Share (%), by Country 2024 & 2032
- Figure 10: MEA On-Site Photovoltaic Solar Power For Data Centers Market Revenue (Million), by Country 2024 & 2032
- Figure 11: MEA On-Site Photovoltaic Solar Power For Data Centers Market Revenue Share (%), by Country 2024 & 2032
- Figure 12: North America On-Site Photovoltaic Solar Power For Data Centers Market Revenue (Million), by Production Analysis 2024 & 2032
- Figure 13: North America On-Site Photovoltaic Solar Power For Data Centers Market Revenue Share (%), by Production Analysis 2024 & 2032
- Figure 14: North America On-Site Photovoltaic Solar Power For Data Centers Market Revenue (Million), by Consumption Analysis 2024 & 2032
- Figure 15: North America On-Site Photovoltaic Solar Power For Data Centers Market Revenue Share (%), by Consumption Analysis 2024 & 2032
- Figure 16: North America On-Site Photovoltaic Solar Power For Data Centers Market Revenue (Million), by Import Market Analysis (Value & Volume) 2024 & 2032
- Figure 17: North America On-Site Photovoltaic Solar Power For Data Centers Market Revenue Share (%), by Import Market Analysis (Value & Volume) 2024 & 2032
- Figure 18: North America On-Site Photovoltaic Solar Power For Data Centers Market Revenue (Million), by Export Market Analysis (Value & Volume) 2024 & 2032
- Figure 19: North America On-Site Photovoltaic Solar Power For Data Centers Market Revenue Share (%), by Export Market Analysis (Value & Volume) 2024 & 2032
- Figure 20: North America On-Site Photovoltaic Solar Power For Data Centers Market Revenue (Million), by Price Trend Analysis 2024 & 2032
- Figure 21: North America On-Site Photovoltaic Solar Power For Data Centers Market Revenue Share (%), by Price Trend Analysis 2024 & 2032
- Figure 22: North America On-Site Photovoltaic Solar Power For Data Centers Market Revenue (Million), by Country 2024 & 2032
- Figure 23: North America On-Site Photovoltaic Solar Power For Data Centers Market Revenue Share (%), by Country 2024 & 2032
- Figure 24: Europe On-Site Photovoltaic Solar Power For Data Centers Market Revenue (Million), by Production Analysis 2024 & 2032
- Figure 25: Europe On-Site Photovoltaic Solar Power For Data Centers Market Revenue Share (%), by Production Analysis 2024 & 2032
- Figure 26: Europe On-Site Photovoltaic Solar Power For Data Centers Market Revenue (Million), by Consumption Analysis 2024 & 2032
- Figure 27: Europe On-Site Photovoltaic Solar Power For Data Centers Market Revenue Share (%), by Consumption Analysis 2024 & 2032
- Figure 28: Europe On-Site Photovoltaic Solar Power For Data Centers Market Revenue (Million), by Import Market Analysis (Value & Volume) 2024 & 2032
- Figure 29: Europe On-Site Photovoltaic Solar Power For Data Centers Market Revenue Share (%), by Import Market Analysis (Value & Volume) 2024 & 2032
- Figure 30: Europe On-Site Photovoltaic Solar Power For Data Centers Market Revenue (Million), by Export Market Analysis (Value & Volume) 2024 & 2032
- Figure 31: Europe On-Site Photovoltaic Solar Power For Data Centers Market Revenue Share (%), by Export Market Analysis (Value & Volume) 2024 & 2032
- Figure 32: Europe On-Site Photovoltaic Solar Power For Data Centers Market Revenue (Million), by Price Trend Analysis 2024 & 2032
- Figure 33: Europe On-Site Photovoltaic Solar Power For Data Centers Market Revenue Share (%), by Price Trend Analysis 2024 & 2032
- Figure 34: Europe On-Site Photovoltaic Solar Power For Data Centers Market Revenue (Million), by Country 2024 & 2032
- Figure 35: Europe On-Site Photovoltaic Solar Power For Data Centers Market Revenue Share (%), by Country 2024 & 2032
- Figure 36: Asia Pacific On-Site Photovoltaic Solar Power For Data Centers Market Revenue (Million), by Production Analysis 2024 & 2032
- Figure 37: Asia Pacific On-Site Photovoltaic Solar Power For Data Centers Market Revenue Share (%), by Production Analysis 2024 & 2032
- Figure 38: Asia Pacific On-Site Photovoltaic Solar Power For Data Centers Market Revenue (Million), by Consumption Analysis 2024 & 2032
- Figure 39: Asia Pacific On-Site Photovoltaic Solar Power For Data Centers Market Revenue Share (%), by Consumption Analysis 2024 & 2032
- Figure 40: Asia Pacific On-Site Photovoltaic Solar Power For Data Centers Market Revenue (Million), by Import Market Analysis (Value & Volume) 2024 & 2032
- Figure 41: Asia Pacific On-Site Photovoltaic Solar Power For Data Centers Market Revenue Share (%), by Import Market Analysis (Value & Volume) 2024 & 2032
- Figure 42: Asia Pacific On-Site Photovoltaic Solar Power For Data Centers Market Revenue (Million), by Export Market Analysis (Value & Volume) 2024 & 2032
- Figure 43: Asia Pacific On-Site Photovoltaic Solar Power For Data Centers Market Revenue Share (%), by Export Market Analysis (Value & Volume) 2024 & 2032
- Figure 44: Asia Pacific On-Site Photovoltaic Solar Power For Data Centers Market Revenue (Million), by Price Trend Analysis 2024 & 2032
- Figure 45: Asia Pacific On-Site Photovoltaic Solar Power For Data Centers Market Revenue Share (%), by Price Trend Analysis 2024 & 2032
- Figure 46: Asia Pacific On-Site Photovoltaic Solar Power For Data Centers Market Revenue (Million), by Country 2024 & 2032
- Figure 47: Asia Pacific On-Site Photovoltaic Solar Power For Data Centers Market Revenue Share (%), by Country 2024 & 2032
- Figure 48: South America On-Site Photovoltaic Solar Power For Data Centers Market Revenue (Million), by Production Analysis 2024 & 2032
- Figure 49: South America On-Site Photovoltaic Solar Power For Data Centers Market Revenue Share (%), by Production Analysis 2024 & 2032
- Figure 50: South America On-Site Photovoltaic Solar Power For Data Centers Market Revenue (Million), by Consumption Analysis 2024 & 2032
- Figure 51: South America On-Site Photovoltaic Solar Power For Data Centers Market Revenue Share (%), by Consumption Analysis 2024 & 2032
- Figure 52: South America On-Site Photovoltaic Solar Power For Data Centers Market Revenue (Million), by Import Market Analysis (Value & Volume) 2024 & 2032
- Figure 53: South America On-Site Photovoltaic Solar Power For Data Centers Market Revenue Share (%), by Import Market Analysis (Value & Volume) 2024 & 2032
- Figure 54: South America On-Site Photovoltaic Solar Power For Data Centers Market Revenue (Million), by Export Market Analysis (Value & Volume) 2024 & 2032
- Figure 55: South America On-Site Photovoltaic Solar Power For Data Centers Market Revenue Share (%), by Export Market Analysis (Value & Volume) 2024 & 2032
- Figure 56: South America On-Site Photovoltaic Solar Power For Data Centers Market Revenue (Million), by Price Trend Analysis 2024 & 2032
- Figure 57: South America On-Site Photovoltaic Solar Power For Data Centers Market Revenue Share (%), by Price Trend Analysis 2024 & 2032
- Figure 58: South America On-Site Photovoltaic Solar Power For Data Centers Market Revenue (Million), by Country 2024 & 2032
- Figure 59: South America On-Site Photovoltaic Solar Power For Data Centers Market Revenue Share (%), by Country 2024 & 2032
- Figure 60: Middle East and Africa On-Site Photovoltaic Solar Power For Data Centers Market Revenue (Million), by Production Analysis 2024 & 2032
- Figure 61: Middle East and Africa On-Site Photovoltaic Solar Power For Data Centers Market Revenue Share (%), by Production Analysis 2024 & 2032
- Figure 62: Middle East and Africa On-Site Photovoltaic Solar Power For Data Centers Market Revenue (Million), by Consumption Analysis 2024 & 2032
- Figure 63: Middle East and Africa On-Site Photovoltaic Solar Power For Data Centers Market Revenue Share (%), by Consumption Analysis 2024 & 2032
- Figure 64: Middle East and Africa On-Site Photovoltaic Solar Power For Data Centers Market Revenue (Million), by Import Market Analysis (Value & Volume) 2024 & 2032
- Figure 65: Middle East and Africa On-Site Photovoltaic Solar Power For Data Centers Market Revenue Share (%), by Import Market Analysis (Value & Volume) 2024 & 2032
- Figure 66: Middle East and Africa On-Site Photovoltaic Solar Power For Data Centers Market Revenue (Million), by Export Market Analysis (Value & Volume) 2024 & 2032
- Figure 67: Middle East and Africa On-Site Photovoltaic Solar Power For Data Centers Market Revenue Share (%), by Export Market Analysis (Value & Volume) 2024 & 2032
- Figure 68: Middle East and Africa On-Site Photovoltaic Solar Power For Data Centers Market Revenue (Million), by Price Trend Analysis 2024 & 2032
- Figure 69: Middle East and Africa On-Site Photovoltaic Solar Power For Data Centers Market Revenue Share (%), by Price Trend Analysis 2024 & 2032
- Figure 70: Middle East and Africa On-Site Photovoltaic Solar Power For Data Centers Market Revenue (Million), by Country 2024 & 2032
- Figure 71: Middle East and Africa On-Site Photovoltaic Solar Power For Data Centers Market Revenue Share (%), by Country 2024 & 2032
List of Tables
- Table 1: Global On-Site Photovoltaic Solar Power For Data Centers Market Revenue Million Forecast, by Region 2019 & 2032
- Table 2: Global On-Site Photovoltaic Solar Power For Data Centers Market Revenue Million Forecast, by Production Analysis 2019 & 2032
- Table 3: Global On-Site Photovoltaic Solar Power For Data Centers Market Revenue Million Forecast, by Consumption Analysis 2019 & 2032
- Table 4: Global On-Site Photovoltaic Solar Power For Data Centers Market Revenue Million Forecast, by Import Market Analysis (Value & Volume) 2019 & 2032
- Table 5: Global On-Site Photovoltaic Solar Power For Data Centers Market Revenue Million Forecast, by Export Market Analysis (Value & Volume) 2019 & 2032
- Table 6: Global On-Site Photovoltaic Solar Power For Data Centers Market Revenue Million Forecast, by Price Trend Analysis 2019 & 2032
- Table 7: Global On-Site Photovoltaic Solar Power For Data Centers Market Revenue Million Forecast, by Region 2019 & 2032
- Table 8: Global On-Site Photovoltaic Solar Power For Data Centers Market Revenue Million Forecast, by Country 2019 & 2032
- Table 9: United States On-Site Photovoltaic Solar Power For Data Centers Market Revenue (Million) Forecast, by Application 2019 & 2032
- Table 10: Canada On-Site Photovoltaic Solar Power For Data Centers Market Revenue (Million) Forecast, by Application 2019 & 2032
- Table 11: Mexico On-Site Photovoltaic Solar Power For Data Centers Market Revenue (Million) Forecast, by Application 2019 & 2032
- Table 12: Global On-Site Photovoltaic Solar Power For Data Centers Market Revenue Million Forecast, by Country 2019 & 2032
- Table 13: Germany On-Site Photovoltaic Solar Power For Data Centers Market Revenue (Million) Forecast, by Application 2019 & 2032
- Table 14: United Kingdom On-Site Photovoltaic Solar Power For Data Centers Market Revenue (Million) Forecast, by Application 2019 & 2032
- Table 15: France On-Site Photovoltaic Solar Power For Data Centers Market Revenue (Million) Forecast, by Application 2019 & 2032
- Table 16: Spain On-Site Photovoltaic Solar Power For Data Centers Market Revenue (Million) Forecast, by Application 2019 & 2032
- Table 17: Italy On-Site Photovoltaic Solar Power For Data Centers Market Revenue (Million) Forecast, by Application 2019 & 2032
- Table 18: Spain On-Site Photovoltaic Solar Power For Data Centers Market Revenue (Million) Forecast, by Application 2019 & 2032
- Table 19: Belgium On-Site Photovoltaic Solar Power For Data Centers Market Revenue (Million) Forecast, by Application 2019 & 2032
- Table 20: Netherland On-Site Photovoltaic Solar Power For Data Centers Market Revenue (Million) Forecast, by Application 2019 & 2032
- Table 21: Nordics On-Site Photovoltaic Solar Power For Data Centers Market Revenue (Million) Forecast, by Application 2019 & 2032
- Table 22: Rest of Europe On-Site Photovoltaic Solar Power For Data Centers Market Revenue (Million) Forecast, by Application 2019 & 2032
- Table 23: Global On-Site Photovoltaic Solar Power For Data Centers Market Revenue Million Forecast, by Country 2019 & 2032
- Table 24: China On-Site Photovoltaic Solar Power For Data Centers Market Revenue (Million) Forecast, by Application 2019 & 2032
- Table 25: Japan On-Site Photovoltaic Solar Power For Data Centers Market Revenue (Million) Forecast, by Application 2019 & 2032
- Table 26: India On-Site Photovoltaic Solar Power For Data Centers Market Revenue (Million) Forecast, by Application 2019 & 2032
- Table 27: South Korea On-Site Photovoltaic Solar Power For Data Centers Market Revenue (Million) Forecast, by Application 2019 & 2032
- Table 28: Southeast Asia On-Site Photovoltaic Solar Power For Data Centers Market Revenue (Million) Forecast, by Application 2019 & 2032
- Table 29: Australia On-Site Photovoltaic Solar Power For Data Centers Market Revenue (Million) Forecast, by Application 2019 & 2032
- Table 30: Indonesia On-Site Photovoltaic Solar Power For Data Centers Market Revenue (Million) Forecast, by Application 2019 & 2032
- Table 31: Phillipes On-Site Photovoltaic Solar Power For Data Centers Market Revenue (Million) Forecast, by Application 2019 & 2032
- Table 32: Singapore On-Site Photovoltaic Solar Power For Data Centers Market Revenue (Million) Forecast, by Application 2019 & 2032
- Table 33: Thailandc On-Site Photovoltaic Solar Power For Data Centers Market Revenue (Million) Forecast, by Application 2019 & 2032
- Table 34: Rest of Asia Pacific On-Site Photovoltaic Solar Power For Data Centers Market Revenue (Million) Forecast, by Application 2019 & 2032
- Table 35: Global On-Site Photovoltaic Solar Power For Data Centers Market Revenue Million Forecast, by Country 2019 & 2032
- Table 36: Brazil On-Site Photovoltaic Solar Power For Data Centers Market Revenue (Million) Forecast, by Application 2019 & 2032
- Table 37: Argentina On-Site Photovoltaic Solar Power For Data Centers Market Revenue (Million) Forecast, by Application 2019 & 2032
- Table 38: Peru On-Site Photovoltaic Solar Power For Data Centers Market Revenue (Million) Forecast, by Application 2019 & 2032
- Table 39: Chile On-Site Photovoltaic Solar Power For Data Centers Market Revenue (Million) Forecast, by Application 2019 & 2032
- Table 40: Colombia On-Site Photovoltaic Solar Power For Data Centers Market Revenue (Million) Forecast, by Application 2019 & 2032
- Table 41: Ecuador On-Site Photovoltaic Solar Power For Data Centers Market Revenue (Million) Forecast, by Application 2019 & 2032
- Table 42: Venezuela On-Site Photovoltaic Solar Power For Data Centers Market Revenue (Million) Forecast, by Application 2019 & 2032
- Table 43: Rest of South America On-Site Photovoltaic Solar Power For Data Centers Market Revenue (Million) Forecast, by Application 2019 & 2032
- Table 44: Global On-Site Photovoltaic Solar Power For Data Centers Market Revenue Million Forecast, by Country 2019 & 2032
- Table 45: United Arab Emirates On-Site Photovoltaic Solar Power For Data Centers Market Revenue (Million) Forecast, by Application 2019 & 2032
- Table 46: Saudi Arabia On-Site Photovoltaic Solar Power For Data Centers Market Revenue (Million) Forecast, by Application 2019 & 2032
- Table 47: South Africa On-Site Photovoltaic Solar Power For Data Centers Market Revenue (Million) Forecast, by Application 2019 & 2032
- Table 48: Rest of Middle East and Africa On-Site Photovoltaic Solar Power For Data Centers Market Revenue (Million) Forecast, by Application 2019 & 2032
- Table 49: Global On-Site Photovoltaic Solar Power For Data Centers Market Revenue Million Forecast, by Production Analysis 2019 & 2032
- Table 50: Global On-Site Photovoltaic Solar Power For Data Centers Market Revenue Million Forecast, by Consumption Analysis 2019 & 2032
- Table 51: Global On-Site Photovoltaic Solar Power For Data Centers Market Revenue Million Forecast, by Import Market Analysis (Value & Volume) 2019 & 2032
- Table 52: Global On-Site Photovoltaic Solar Power For Data Centers Market Revenue Million Forecast, by Export Market Analysis (Value & Volume) 2019 & 2032
- Table 53: Global On-Site Photovoltaic Solar Power For Data Centers Market Revenue Million Forecast, by Price Trend Analysis 2019 & 2032
- Table 54: Global On-Site Photovoltaic Solar Power For Data Centers Market Revenue Million Forecast, by Country 2019 & 2032
- Table 55: United States On-Site Photovoltaic Solar Power For Data Centers Market Revenue (Million) Forecast, by Application 2019 & 2032
- Table 56: Canada On-Site Photovoltaic Solar Power For Data Centers Market Revenue (Million) Forecast, by Application 2019 & 2032
- Table 57: Rest of North America On-Site Photovoltaic Solar Power For Data Centers Market Revenue (Million) Forecast, by Application 2019 & 2032
- Table 58: Global On-Site Photovoltaic Solar Power For Data Centers Market Revenue Million Forecast, by Production Analysis 2019 & 2032
- Table 59: Global On-Site Photovoltaic Solar Power For Data Centers Market Revenue Million Forecast, by Consumption Analysis 2019 & 2032
- Table 60: Global On-Site Photovoltaic Solar Power For Data Centers Market Revenue Million Forecast, by Import Market Analysis (Value & Volume) 2019 & 2032
- Table 61: Global On-Site Photovoltaic Solar Power For Data Centers Market Revenue Million Forecast, by Export Market Analysis (Value & Volume) 2019 & 2032
- Table 62: Global On-Site Photovoltaic Solar Power For Data Centers Market Revenue Million Forecast, by Price Trend Analysis 2019 & 2032
- Table 63: Global On-Site Photovoltaic Solar Power For Data Centers Market Revenue Million Forecast, by Country 2019 & 2032
- Table 64: Germany On-Site Photovoltaic Solar Power For Data Centers Market Revenue (Million) Forecast, by Application 2019 & 2032
- Table 65: France On-Site Photovoltaic Solar Power For Data Centers Market Revenue (Million) Forecast, by Application 2019 & 2032
- Table 66: United Kingdom On-Site Photovoltaic Solar Power For Data Centers Market Revenue (Million) Forecast, by Application 2019 & 2032
- Table 67: Italy On-Site Photovoltaic Solar Power For Data Centers Market Revenue (Million) Forecast, by Application 2019 & 2032
- Table 68: Spain On-Site Photovoltaic Solar Power For Data Centers Market Revenue (Million) Forecast, by Application 2019 & 2032
- Table 69: NORDIC On-Site Photovoltaic Solar Power For Data Centers Market Revenue (Million) Forecast, by Application 2019 & 2032
- Table 70: Turkey On-Site Photovoltaic Solar Power For Data Centers Market Revenue (Million) Forecast, by Application 2019 & 2032
- Table 71: Russia On-Site Photovoltaic Solar Power For Data Centers Market Revenue (Million) Forecast, by Application 2019 & 2032
- Table 72: Rest of Europe On-Site Photovoltaic Solar Power For Data Centers Market Revenue (Million) Forecast, by Application 2019 & 2032
- Table 73: Global On-Site Photovoltaic Solar Power For Data Centers Market Revenue Million Forecast, by Production Analysis 2019 & 2032
- Table 74: Global On-Site Photovoltaic Solar Power For Data Centers Market Revenue Million Forecast, by Consumption Analysis 2019 & 2032
- Table 75: Global On-Site Photovoltaic Solar Power For Data Centers Market Revenue Million Forecast, by Import Market Analysis (Value & Volume) 2019 & 2032
- Table 76: Global On-Site Photovoltaic Solar Power For Data Centers Market Revenue Million Forecast, by Export Market Analysis (Value & Volume) 2019 & 2032
- Table 77: Global On-Site Photovoltaic Solar Power For Data Centers Market Revenue Million Forecast, by Price Trend Analysis 2019 & 2032
- Table 78: Global On-Site Photovoltaic Solar Power For Data Centers Market Revenue Million Forecast, by Country 2019 & 2032
- Table 79: China On-Site Photovoltaic Solar Power For Data Centers Market Revenue (Million) Forecast, by Application 2019 & 2032
- Table 80: India On-Site Photovoltaic Solar Power For Data Centers Market Revenue (Million) Forecast, by Application 2019 & 2032
- Table 81: Japan On-Site Photovoltaic Solar Power For Data Centers Market Revenue (Million) Forecast, by Application 2019 & 2032
- Table 82: Australia On-Site Photovoltaic Solar Power For Data Centers Market Revenue (Million) Forecast, by Application 2019 & 2032
- Table 83: Malaysia On-Site Photovoltaic Solar Power For Data Centers Market Revenue (Million) Forecast, by Application 2019 & 2032
- Table 84: Thailand On-Site Photovoltaic Solar Power For Data Centers Market Revenue (Million) Forecast, by Application 2019 & 2032
- Table 85: Indonesia On-Site Photovoltaic Solar Power For Data Centers Market Revenue (Million) Forecast, by Application 2019 & 2032
- Table 86: Vietnam On-Site Photovoltaic Solar Power For Data Centers Market Revenue (Million) Forecast, by Application 2019 & 2032
- Table 87: Rest of Asia Pacific On-Site Photovoltaic Solar Power For Data Centers Market Revenue (Million) Forecast, by Application 2019 & 2032
- Table 88: Global On-Site Photovoltaic Solar Power For Data Centers Market Revenue Million Forecast, by Production Analysis 2019 & 2032
- Table 89: Global On-Site Photovoltaic Solar Power For Data Centers Market Revenue Million Forecast, by Consumption Analysis 2019 & 2032
- Table 90: Global On-Site Photovoltaic Solar Power For Data Centers Market Revenue Million Forecast, by Import Market Analysis (Value & Volume) 2019 & 2032
- Table 91: Global On-Site Photovoltaic Solar Power For Data Centers Market Revenue Million Forecast, by Export Market Analysis (Value & Volume) 2019 & 2032
- Table 92: Global On-Site Photovoltaic Solar Power For Data Centers Market Revenue Million Forecast, by Price Trend Analysis 2019 & 2032
- Table 93: Global On-Site Photovoltaic Solar Power For Data Centers Market Revenue Million Forecast, by Country 2019 & 2032
- Table 94: Brazil On-Site Photovoltaic Solar Power For Data Centers Market Revenue (Million) Forecast, by Application 2019 & 2032
- Table 95: Argentina On-Site Photovoltaic Solar Power For Data Centers Market Revenue (Million) Forecast, by Application 2019 & 2032
- Table 96: Chile On-Site Photovoltaic Solar Power For Data Centers Market Revenue (Million) Forecast, by Application 2019 & 2032
- Table 97: Colombia On-Site Photovoltaic Solar Power For Data Centers Market Revenue (Million) Forecast, by Application 2019 & 2032
- Table 98: Rest of South America On-Site Photovoltaic Solar Power For Data Centers Market Revenue (Million) Forecast, by Application 2019 & 2032
- Table 99: Global On-Site Photovoltaic Solar Power For Data Centers Market Revenue Million Forecast, by Production Analysis 2019 & 2032
- Table 100: Global On-Site Photovoltaic Solar Power For Data Centers Market Revenue Million Forecast, by Consumption Analysis 2019 & 2032
- Table 101: Global On-Site Photovoltaic Solar Power For Data Centers Market Revenue Million Forecast, by Import Market Analysis (Value & Volume) 2019 & 2032
- Table 102: Global On-Site Photovoltaic Solar Power For Data Centers Market Revenue Million Forecast, by Export Market Analysis (Value & Volume) 2019 & 2032
- Table 103: Global On-Site Photovoltaic Solar Power For Data Centers Market Revenue Million Forecast, by Price Trend Analysis 2019 & 2032
- Table 104: Global On-Site Photovoltaic Solar Power For Data Centers Market Revenue Million Forecast, by Country 2019 & 2032
- Table 105: United Arab Emirates On-Site Photovoltaic Solar Power For Data Centers Market Revenue (Million) Forecast, by Application 2019 & 2032
- Table 106: Qatar On-Site Photovoltaic Solar Power For Data Centers Market Revenue (Million) Forecast, by Application 2019 & 2032
- Table 107: Saudi Arabia On-Site Photovoltaic Solar Power For Data Centers Market Revenue (Million) Forecast, by Application 2019 & 2032
- Table 108: South Africa On-Site Photovoltaic Solar Power For Data Centers Market Revenue (Million) Forecast, by Application 2019 & 2032
- Table 109: Nigeria On-Site Photovoltaic Solar Power For Data Centers Market Revenue (Million) Forecast, by Application 2019 & 2032
- Table 110: Egypt On-Site Photovoltaic Solar Power For Data Centers Market Revenue (Million) Forecast, by Application 2019 & 2032
Frequently Asked Questions
1. What is the projected Compound Annual Growth Rate (CAGR) of the On-Site Photovoltaic Solar Power For Data Centers Market?
The projected CAGR is approximately 13.60%.
2. Which companies are prominent players in the On-Site Photovoltaic Solar Power For Data Centers Market?
Key companies in the market include Affordable Internet Services Online Inc *List Not Exhaustive 6 4 Market Player Rankin, Alibaba Group Holding Ltd, Alphabet Inc, Microsoft Corporation, Amazon com Inc, Facebook Inc, Dell Technologies Inc.
3. What are the main segments of the On-Site Photovoltaic Solar Power For Data Centers Market?
The market segments include Production Analysis, Consumption Analysis, Import Market Analysis (Value & Volume), Export Market Analysis (Value & Volume), Price Trend Analysis.
4. Can you provide details about the market size?
The market size is estimated to be USD 22.90 Million as of 2022.
5. What are some drivers contributing to market growth?
4.; Decreasing Solar Power Installation Costs 4.; Growing focus on Implementing Sustainable Business Practices.
6. What are the notable trends driving market growth?
Decrease in Solar Power Installation Cost is Likely to Drive the Market.
7. Are there any restraints impacting market growth?
4.; Lack of Space for Small Data Centers to Install Solar Panels.
8. Can you provide examples of recent developments in the market?
In September 2023, Ireland-based Power Capital Renewable Energy (PCRE) signed a power purchase agreement (PPA) with American multinational technology firm Google. The agreement will help power up the data centre and offices of Google in Ireland with solar energy worth 58 MW capacity.
9. What pricing options are available for accessing the report?
Pricing options include single-user, multi-user, and enterprise licenses priced at USD 4750, USD 5250, and USD 8750 respectively.
10. Is the market size provided in terms of value or volume?
The market size is provided in terms of value, measured in Million.
11. Are there any specific market keywords associated with the report?
Yes, the market keyword associated with the report is "On-Site Photovoltaic Solar Power For Data Centers Market," which aids in identifying and referencing the specific market segment covered.
12. How do I determine which pricing option suits my needs best?
The pricing options vary based on user requirements and access needs. Individual users may opt for single-user licenses, while businesses requiring broader access may choose multi-user or enterprise licenses for cost-effective access to the report.
13. Are there any additional resources or data provided in the On-Site Photovoltaic Solar Power For Data Centers Market report?
While the report offers comprehensive insights, it's advisable to review the specific contents or supplementary materials provided to ascertain if additional resources or data are available.
14. How can I stay updated on further developments or reports in the On-Site Photovoltaic Solar Power For Data Centers Market?
To stay informed about further developments, trends, and reports in the On-Site Photovoltaic Solar Power For Data Centers Market, consider subscribing to industry newsletters, following relevant companies and organizations, or regularly checking reputable industry news sources and publications.
Methodology
Step 1 - Identification of Relevant Samples Size from Population Database


Step 2 - Approaches for Defining Global Market Size (Value, Volume* & Price*)

Note*: In applicable scenarios
Step 3 - Data Sources
Primary Research
- Web Analytics
- Survey Reports
- Research Institute
- Latest Research Reports
- Opinion Leaders
Secondary Research
- Annual Reports
- White Paper
- Latest Press Release
- Industry Association
- Paid Database
- Investor Presentations

Step 4 - Data Triangulation
Involves using different sources of information in order to increase the validity of a study
These sources are likely to be stakeholders in a program - participants, other researchers, program staff, other community members, and so on.
Then we put all data in single framework & apply various statistical tools to find out the dynamic on the market.
During the analysis stage, feedback from the stakeholder groups would be compared to determine areas of agreement as well as areas of divergence


