


Key Insights
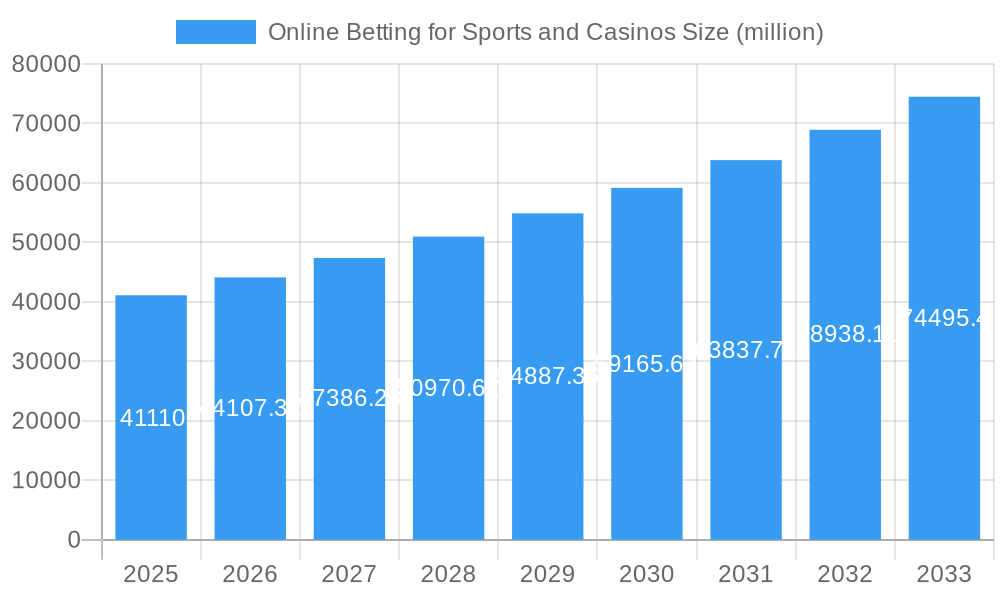
The global online sports and casino betting market, currently valued at $41.11 billion (2025), is projected to experience robust growth, exhibiting a Compound Annual Growth Rate (CAGR) of 7.2% from 2025 to 2033. This expansion is fueled by several key factors. Increasing smartphone penetration and readily available high-speed internet access are making online betting increasingly convenient and accessible to a wider demographic. Furthermore, the strategic marketing initiatives and innovative offerings employed by major players like Bet365, Flutter Entertainment, and DraftKings, including enhanced user interfaces, diverse betting options (e.g., in-play betting, esports betting), and lucrative bonuses, are driving user engagement and market expansion. The rise in popularity of esports and the growing acceptance of online gambling in previously restrictive regions also contribute significantly to market growth. However, regulatory hurdles and concerns about problem gambling remain significant restraints, potentially impacting the market's trajectory in certain regions. The market is segmented by various factors including betting type (sports vs. casino), device (desktop vs. mobile), and geographical region, with significant variations in market penetration and regulatory landscapes across these segments.

Online Betting for Sports and Casinos Market Size (In Billion)

The competitive landscape is characterized by a blend of established international giants like Bet365 and Flutter Entertainment, alongside emerging regional players and specialized operators. The intense competition is driving innovation and price wars, benefiting consumers but putting pressure on profitability. Future growth will likely be influenced by technological advancements such as the integration of artificial intelligence and virtual reality, potentially leading to more immersive and personalized betting experiences. Furthermore, the evolving regulatory framework across different jurisdictions will play a crucial role in shaping the market's trajectory, with some regions potentially witnessing significant growth while others face stricter limitations. Understanding these dynamic factors is crucial for players seeking to succeed in this dynamic and rapidly evolving market.
Online Betting for Sports and Casinos Company Market Share
Online Betting for Sports and Casinos Market Report: 2019-2033
This comprehensive report provides a detailed analysis of the global online betting market for sports and casinos, covering the period 2019-2033. The report utilizes a robust methodology combining extensive primary and secondary research to deliver actionable insights for industry stakeholders, investors, and businesses seeking to navigate this dynamic sector. We project the market to reach $xx million by 2033.
Online Betting for Sports and Casinos Market Concentration & Innovation
This section analyzes the competitive landscape of the online betting market, focusing on market concentration, innovation drivers, regulatory frameworks, and mergers & acquisitions (M&A) activities. The study period of 2019-2024 reveals a highly competitive market with significant consolidation. Key players like Flutter Entertainment, Entain plc, and Bet365 hold substantial market shares, exceeding xx% collectively in 2024. However, the market also features numerous smaller, niche players.
- Market Concentration: The Herfindahl-Hirschman Index (HHI) for the market was estimated at xx in 2024, indicating a moderately concentrated market.
- Innovation Drivers: Technological advancements like mobile gaming, virtual reality (VR), and artificial intelligence (AI) are driving innovation. Personalized betting experiences and enhanced security features are also key factors.
- Regulatory Frameworks: Varying regulatory landscapes across different jurisdictions significantly impact market growth and competitiveness. Stringent regulations in some regions are creating challenges for expansion, while more liberal environments foster growth.
- Product Substitutes: The market faces competition from alternative forms of entertainment, including traditional casinos, lotteries, and social gaming platforms.
- End-User Trends: The increasing popularity of online betting is driven by convenience, accessibility, and the availability of a wider range of betting options.
- M&A Activities: The period witnessed significant M&A activity, with total deal values exceeding $xx million. These mergers have led to increased market concentration and the emergence of larger, more diversified players. Examples include Flutter Entertainment's acquisitions of The Stars Group and FanDuel.
Online Betting for Sports and Casinos Industry Trends & Insights
This section dives deep into the key trends shaping the online betting market. The Compound Annual Growth Rate (CAGR) for the period 2019-2024 was approximately xx%, driven by several factors, including increased internet penetration, the legalization of online gambling in various jurisdictions, and the growing popularity of esports betting. Market penetration, particularly in mature markets, has reached xx% in 2024, indicating significant market saturation but with room for growth in newer markets.
The global market is witnessing a technological disruption with the rise of mobile betting applications, which are now the dominant way many people access online betting services. The preference is towards user-friendly platforms with live streaming, in-play betting options and robust mobile-first design and UX. Furthermore, the rise of data analytics is improving risk management for operators, leading to more precise and profitable market strategies. This competitive landscape is characterized by intense competition among established operators and the constant emergence of new entrants. Customer acquisition costs remain high, driving increased marketing spend and the need for differentiated offerings.
Dominant Markets & Segments in Online Betting for Sports and Casinos
This section identifies the leading regions, countries, and segments within the online betting market. Based on our analysis, Europe and North America remain dominant markets, fueled by mature economies, high internet penetration rates, and relatively favorable regulatory environments. Within these regions, specific countries like the UK, Germany, and the United States exhibit particularly strong growth.
- Key Drivers in Europe:
- Favorable regulatory frameworks in several countries.
- High internet and smartphone penetration.
- Established sports betting culture.
- Key Drivers in North America:
- Increasing legalization of online gambling in various states.
- Growing popularity of sports betting, particularly in the US.
- Technological advancements and innovation.
- Dominant Segments: Sports betting remains the largest segment, followed by casino games and esports betting. The increasing popularity of esports is driving growth in this niche segment.
The dominance of these regions and segments is further strengthened by robust infrastructure, technological advancements, and a supportive regulatory environment that encourages innovation and investment.
Online Betting for Sports and Casinos Product Developments
The online betting market is characterized by continuous product innovation to maintain user engagement and attract new customers. Key trends include the introduction of enhanced virtual reality (VR) and augmented reality (AR) experiences, the integration of blockchain technology for secure and transparent transactions, and the development of personalized betting experiences using AI. The market is also seeing the rise of unique game offerings beyond traditional sports betting and casino games. These innovations provide competitive advantages to operators offering better user experience, enhanced security, and improved market differentiation.
Report Scope & Segmentation Analysis
This report segments the online betting market based on several key factors:
- By Product Type: Sports betting, casino games (slots, table games, live casino), poker, bingo, lottery. Each segment exhibits different growth trajectories and competitive dynamics.
- By Platform: Desktop, mobile (iOS, Android), others. Mobile betting is witnessing faster growth due to the high rate of smartphone adoption.
- By Region: North America, Europe, Asia-Pacific, Latin America, Middle East & Africa. Each region's regulatory landscape has a significant impact on market growth. The growth projections for each segment vary, reflecting diverse market dynamics and potential.
Key Drivers of Online Betting for Sports and Casinos Growth
Several factors drive the growth of the online betting market. These include the increasing legalization and regulation of online gambling in various jurisdictions, fostering a regulated and secure environment. The expansion of internet and mobile penetration, particularly in emerging markets, is another significant factor. The rising popularity of esports and fantasy sports is also contributing to market expansion and diversification, alongside the ongoing technological innovation, creating engaging and immersive betting experiences.
Challenges in the Online Betting for Sports and Casinos Sector
The online betting industry faces several challenges, including stringent regulatory frameworks in certain jurisdictions, leading to compliance costs and operational restrictions. The risk of fraud and money laundering remains a major concern, requiring robust security measures and compliance with anti-money laundering regulations. Intense competition among established and new players also increases customer acquisition costs and puts pressure on margins.
Emerging Opportunities in Online Betting for Sports and Casinos
The market presents various opportunities. The expansion into new and emerging markets with less stringent regulatory environments offers significant growth potential. The integration of advanced technologies like artificial intelligence (AI) and big data analytics can enhance personalization, risk management, and customer service. Exploring new betting verticals, such as esports and virtual sports, further diversifies offerings and attracts new customers.
Leading Players in the Online Betting for Sports and Casinos Market
- Bet365
- Kindred Group
- Entain plc (formerly GVC Holdings)
- Flutter Entertainment
- William Hill
- Pinnacle
- The Stars Group
- Betvictor
- Betsson AB
- Gamesys
- 888 Holdings
- Bet-at-home.com
- Intertops
- Betway
- Betfred
- Interwetten
- SBOBET
- Sportech
- EGB
- BetOnline
- DraftKings
- BetWinner
- Sports Interaction
Key Developments in Online Betting for Sports and Casinos Industry
- 2022-Q4: Flutter Entertainment completed the acquisition of Sisal, expanding its presence in the Italian market.
- 2023-Q1: DraftKings launched a new mobile app with enhanced features.
- 2023-Q2: Increased regulatory scrutiny in several European countries led to stricter compliance measures for operators.
- 2024-Q3: Bet365 introduced a new virtual reality casino experience. (Further updates to be added based on actual developments.)
Strategic Outlook for Online Betting for Sports and Casinos Market
The online betting market is poised for continued growth, driven by technological advancements, expansion into new markets, and the increasing acceptance of online gambling. Strategic opportunities include focusing on personalized user experiences, leveraging data analytics for enhanced risk management, and developing innovative products to attract new customer segments. The industry’s focus on responsible gambling and compliance with regulatory standards will be crucial for long-term success.
Online Betting for Sports and Casinos Segmentation
-
1. Application
- 1.1. Desktop
- 1.2. Mobile Devices
-
2. Types
- 2.1. Casinos
- 2.2. Soccer
- 2.3. American Football
- 2.4. Basketball
- 2.5. Hockey
- 2.6. Mixed Martial Arts and Boxing
- 2.7. Others
Online Betting for Sports and Casinos Segmentation By Geography
-
1. North America
- 1.1. United States
- 1.2. Canada
- 1.3. Mexico
-
2. South America
- 2.1. Brazil
- 2.2. Argentina
- 2.3. Rest of South America
-
3. Europe
- 3.1. United Kingdom
- 3.2. Germany
- 3.3. France
- 3.4. Italy
- 3.5. Spain
- 3.6. Russia
- 3.7. Benelux
- 3.8. Nordics
- 3.9. Rest of Europe
-
4. Middle East & Africa
- 4.1. Turkey
- 4.2. Israel
- 4.3. GCC
- 4.4. North Africa
- 4.5. South Africa
- 4.6. Rest of Middle East & Africa
-
5. Asia Pacific
- 5.1. China
- 5.2. India
- 5.3. Japan
- 5.4. South Korea
- 5.5. ASEAN
- 5.6. Oceania
- 5.7. Rest of Asia Pacific

Online Betting for Sports and Casinos Regional Market Share
Geographic Coverage of Online Betting for Sports and Casinos
Online Betting for Sports and Casinos REPORT HIGHLIGHTS
| Aspects | Details |
|---|---|
| Study Period | 2020-2034 |
| Base Year | 2025 |
| Estimated Year | 2026 |
| Forecast Period | 2026-2034 |
| Historical Period | 2020-2025 |
| Growth Rate | CAGR of 7.2% from 2020-2034 |
| Segmentation |
|
Table of Contents
- 1. Introduction
- 1.1. Research Scope
- 1.2. Market Segmentation
- 1.3. Research Methodology
- 1.4. Definitions and Assumptions
- 2. Executive Summary
- 2.1. Introduction
- 3. Market Dynamics
- 3.1. Introduction
- 3.2. Market Drivers
- 3.3. Market Restrains
- 3.4. Market Trends
- 4. Market Factor Analysis
- 4.1. Porters Five Forces
- 4.2. Supply/Value Chain
- 4.3. PESTEL analysis
- 4.4. Market Entropy
- 4.5. Patent/Trademark Analysis
- 5. Global Online Betting for Sports and Casinos Analysis, Insights and Forecast, 2020-2032
- 5.1. Market Analysis, Insights and Forecast - by Application
- 5.1.1. Desktop
- 5.1.2. Mobile Devices
- 5.2. Market Analysis, Insights and Forecast - by Types
- 5.2.1. Casinos
- 5.2.2. Soccer
- 5.2.3. American Football
- 5.2.4. Basketball
- 5.2.5. Hockey
- 5.2.6. Mixed Martial Arts and Boxing
- 5.2.7. Others
- 5.3. Market Analysis, Insights and Forecast - by Region
- 5.3.1. North America
- 5.3.2. South America
- 5.3.3. Europe
- 5.3.4. Middle East & Africa
- 5.3.5. Asia Pacific
- 5.1. Market Analysis, Insights and Forecast - by Application
- 6. North America Online Betting for Sports and Casinos Analysis, Insights and Forecast, 2020-2032
- 6.1. Market Analysis, Insights and Forecast - by Application
- 6.1.1. Desktop
- 6.1.2. Mobile Devices
- 6.2. Market Analysis, Insights and Forecast - by Types
- 6.2.1. Casinos
- 6.2.2. Soccer
- 6.2.3. American Football
- 6.2.4. Basketball
- 6.2.5. Hockey
- 6.2.6. Mixed Martial Arts and Boxing
- 6.2.7. Others
- 6.1. Market Analysis, Insights and Forecast - by Application
- 7. South America Online Betting for Sports and Casinos Analysis, Insights and Forecast, 2020-2032
- 7.1. Market Analysis, Insights and Forecast - by Application
- 7.1.1. Desktop
- 7.1.2. Mobile Devices
- 7.2. Market Analysis, Insights and Forecast - by Types
- 7.2.1. Casinos
- 7.2.2. Soccer
- 7.2.3. American Football
- 7.2.4. Basketball
- 7.2.5. Hockey
- 7.2.6. Mixed Martial Arts and Boxing
- 7.2.7. Others
- 7.1. Market Analysis, Insights and Forecast - by Application
- 8. Europe Online Betting for Sports and Casinos Analysis, Insights and Forecast, 2020-2032
- 8.1. Market Analysis, Insights and Forecast - by Application
- 8.1.1. Desktop
- 8.1.2. Mobile Devices
- 8.2. Market Analysis, Insights and Forecast - by Types
- 8.2.1. Casinos
- 8.2.2. Soccer
- 8.2.3. American Football
- 8.2.4. Basketball
- 8.2.5. Hockey
- 8.2.6. Mixed Martial Arts and Boxing
- 8.2.7. Others
- 8.1. Market Analysis, Insights and Forecast - by Application
- 9. Middle East & Africa Online Betting for Sports and Casinos Analysis, Insights and Forecast, 2020-2032
- 9.1. Market Analysis, Insights and Forecast - by Application
- 9.1.1. Desktop
- 9.1.2. Mobile Devices
- 9.2. Market Analysis, Insights and Forecast - by Types
- 9.2.1. Casinos
- 9.2.2. Soccer
- 9.2.3. American Football
- 9.2.4. Basketball
- 9.2.5. Hockey
- 9.2.6. Mixed Martial Arts and Boxing
- 9.2.7. Others
- 9.1. Market Analysis, Insights and Forecast - by Application
- 10. Asia Pacific Online Betting for Sports and Casinos Analysis, Insights and Forecast, 2020-2032
- 10.1. Market Analysis, Insights and Forecast - by Application
- 10.1.1. Desktop
- 10.1.2. Mobile Devices
- 10.2. Market Analysis, Insights and Forecast - by Types
- 10.2.1. Casinos
- 10.2.2. Soccer
- 10.2.3. American Football
- 10.2.4. Basketball
- 10.2.5. Hockey
- 10.2.6. Mixed Martial Arts and Boxing
- 10.2.7. Others
- 10.1. Market Analysis, Insights and Forecast - by Application
- 11. Competitive Analysis
- 11.1. Global Market Share Analysis 2025
- 11.2. Company Profiles
- 11.2.1 Bet365
- 11.2.1.1. Overview
- 11.2.1.2. Products
- 11.2.1.3. SWOT Analysis
- 11.2.1.4. Recent Developments
- 11.2.1.5. Financials (Based on Availability)
- 11.2.2 Kindred Group
- 11.2.2.1. Overview
- 11.2.2.2. Products
- 11.2.2.3. SWOT Analysis
- 11.2.2.4. Recent Developments
- 11.2.2.5. Financials (Based on Availability)
- 11.2.3 Entain plc (formerly GVC Holdings)
- 11.2.3.1. Overview
- 11.2.3.2. Products
- 11.2.3.3. SWOT Analysis
- 11.2.3.4. Recent Developments
- 11.2.3.5. Financials (Based on Availability)
- 11.2.4 Flutter Entertainment
- 11.2.4.1. Overview
- 11.2.4.2. Products
- 11.2.4.3. SWOT Analysis
- 11.2.4.4. Recent Developments
- 11.2.4.5. Financials (Based on Availability)
- 11.2.5 William Hill
- 11.2.5.1. Overview
- 11.2.5.2. Products
- 11.2.5.3. SWOT Analysis
- 11.2.5.4. Recent Developments
- 11.2.5.5. Financials (Based on Availability)
- 11.2.6 Pinnacle
- 11.2.6.1. Overview
- 11.2.6.2. Products
- 11.2.6.3. SWOT Analysis
- 11.2.6.4. Recent Developments
- 11.2.6.5. Financials (Based on Availability)
- 11.2.7 The Stars Group
- 11.2.7.1. Overview
- 11.2.7.2. Products
- 11.2.7.3. SWOT Analysis
- 11.2.7.4. Recent Developments
- 11.2.7.5. Financials (Based on Availability)
- 11.2.8 Betvictor
- 11.2.8.1. Overview
- 11.2.8.2. Products
- 11.2.8.3. SWOT Analysis
- 11.2.8.4. Recent Developments
- 11.2.8.5. Financials (Based on Availability)
- 11.2.9 Betsson AB
- 11.2.9.1. Overview
- 11.2.9.2. Products
- 11.2.9.3. SWOT Analysis
- 11.2.9.4. Recent Developments
- 11.2.9.5. Financials (Based on Availability)
- 11.2.10 Gamesys
- 11.2.10.1. Overview
- 11.2.10.2. Products
- 11.2.10.3. SWOT Analysis
- 11.2.10.4. Recent Developments
- 11.2.10.5. Financials (Based on Availability)
- 11.2.11 888 Holdings
- 11.2.11.1. Overview
- 11.2.11.2. Products
- 11.2.11.3. SWOT Analysis
- 11.2.11.4. Recent Developments
- 11.2.11.5. Financials (Based on Availability)
- 11.2.12 Bet-at-home.com
- 11.2.12.1. Overview
- 11.2.12.2. Products
- 11.2.12.3. SWOT Analysis
- 11.2.12.4. Recent Developments
- 11.2.12.5. Financials (Based on Availability)
- 11.2.13 Intertops
- 11.2.13.1. Overview
- 11.2.13.2. Products
- 11.2.13.3. SWOT Analysis
- 11.2.13.4. Recent Developments
- 11.2.13.5. Financials (Based on Availability)
- 11.2.14 Betway
- 11.2.14.1. Overview
- 11.2.14.2. Products
- 11.2.14.3. SWOT Analysis
- 11.2.14.4. Recent Developments
- 11.2.14.5. Financials (Based on Availability)
- 11.2.15 Betfred
- 11.2.15.1. Overview
- 11.2.15.2. Products
- 11.2.15.3. SWOT Analysis
- 11.2.15.4. Recent Developments
- 11.2.15.5. Financials (Based on Availability)
- 11.2.16 Interwetten
- 11.2.16.1. Overview
- 11.2.16.2. Products
- 11.2.16.3. SWOT Analysis
- 11.2.16.4. Recent Developments
- 11.2.16.5. Financials (Based on Availability)
- 11.2.17 SBOBET
- 11.2.17.1. Overview
- 11.2.17.2. Products
- 11.2.17.3. SWOT Analysis
- 11.2.17.4. Recent Developments
- 11.2.17.5. Financials (Based on Availability)
- 11.2.18 Sportech
- 11.2.18.1. Overview
- 11.2.18.2. Products
- 11.2.18.3. SWOT Analysis
- 11.2.18.4. Recent Developments
- 11.2.18.5. Financials (Based on Availability)
- 11.2.19 EGB
- 11.2.19.1. Overview
- 11.2.19.2. Products
- 11.2.19.3. SWOT Analysis
- 11.2.19.4. Recent Developments
- 11.2.19.5. Financials (Based on Availability)
- 11.2.20 BetOnline
- 11.2.20.1. Overview
- 11.2.20.2. Products
- 11.2.20.3. SWOT Analysis
- 11.2.20.4. Recent Developments
- 11.2.20.5. Financials (Based on Availability)
- 11.2.21 DraftKings
- 11.2.21.1. Overview
- 11.2.21.2. Products
- 11.2.21.3. SWOT Analysis
- 11.2.21.4. Recent Developments
- 11.2.21.5. Financials (Based on Availability)
- 11.2.22 BetWinner
- 11.2.22.1. Overview
- 11.2.22.2. Products
- 11.2.22.3. SWOT Analysis
- 11.2.22.4. Recent Developments
- 11.2.22.5. Financials (Based on Availability)
- 11.2.23 Sports Interaction
- 11.2.23.1. Overview
- 11.2.23.2. Products
- 11.2.23.3. SWOT Analysis
- 11.2.23.4. Recent Developments
- 11.2.23.5. Financials (Based on Availability)
- 11.2.1 Bet365
List of Figures
- Figure 1: Global Online Betting for Sports and Casinos Revenue Breakdown (million, %) by Region 2025 & 2033
- Figure 2: North America Online Betting for Sports and Casinos Revenue (million), by Application 2025 & 2033
- Figure 3: North America Online Betting for Sports and Casinos Revenue Share (%), by Application 2025 & 2033
- Figure 4: North America Online Betting for Sports and Casinos Revenue (million), by Types 2025 & 2033
- Figure 5: North America Online Betting for Sports and Casinos Revenue Share (%), by Types 2025 & 2033
- Figure 6: North America Online Betting for Sports and Casinos Revenue (million), by Country 2025 & 2033
- Figure 7: North America Online Betting for Sports and Casinos Revenue Share (%), by Country 2025 & 2033
- Figure 8: South America Online Betting for Sports and Casinos Revenue (million), by Application 2025 & 2033
- Figure 9: South America Online Betting for Sports and Casinos Revenue Share (%), by Application 2025 & 2033
- Figure 10: South America Online Betting for Sports and Casinos Revenue (million), by Types 2025 & 2033
- Figure 11: South America Online Betting for Sports and Casinos Revenue Share (%), by Types 2025 & 2033
- Figure 12: South America Online Betting for Sports and Casinos Revenue (million), by Country 2025 & 2033
- Figure 13: South America Online Betting for Sports and Casinos Revenue Share (%), by Country 2025 & 2033
- Figure 14: Europe Online Betting for Sports and Casinos Revenue (million), by Application 2025 & 2033
- Figure 15: Europe Online Betting for Sports and Casinos Revenue Share (%), by Application 2025 & 2033
- Figure 16: Europe Online Betting for Sports and Casinos Revenue (million), by Types 2025 & 2033
- Figure 17: Europe Online Betting for Sports and Casinos Revenue Share (%), by Types 2025 & 2033
- Figure 18: Europe Online Betting for Sports and Casinos Revenue (million), by Country 2025 & 2033
- Figure 19: Europe Online Betting for Sports and Casinos Revenue Share (%), by Country 2025 & 2033
- Figure 20: Middle East & Africa Online Betting for Sports and Casinos Revenue (million), by Application 2025 & 2033
- Figure 21: Middle East & Africa Online Betting for Sports and Casinos Revenue Share (%), by Application 2025 & 2033
- Figure 22: Middle East & Africa Online Betting for Sports and Casinos Revenue (million), by Types 2025 & 2033
- Figure 23: Middle East & Africa Online Betting for Sports and Casinos Revenue Share (%), by Types 2025 & 2033
- Figure 24: Middle East & Africa Online Betting for Sports and Casinos Revenue (million), by Country 2025 & 2033
- Figure 25: Middle East & Africa Online Betting for Sports and Casinos Revenue Share (%), by Country 2025 & 2033
- Figure 26: Asia Pacific Online Betting for Sports and Casinos Revenue (million), by Application 2025 & 2033
- Figure 27: Asia Pacific Online Betting for Sports and Casinos Revenue Share (%), by Application 2025 & 2033
- Figure 28: Asia Pacific Online Betting for Sports and Casinos Revenue (million), by Types 2025 & 2033
- Figure 29: Asia Pacific Online Betting for Sports and Casinos Revenue Share (%), by Types 2025 & 2033
- Figure 30: Asia Pacific Online Betting for Sports and Casinos Revenue (million), by Country 2025 & 2033
- Figure 31: Asia Pacific Online Betting for Sports and Casinos Revenue Share (%), by Country 2025 & 2033
List of Tables
- Table 1: Global Online Betting for Sports and Casinos Revenue million Forecast, by Application 2020 & 2033
- Table 2: Global Online Betting for Sports and Casinos Revenue million Forecast, by Types 2020 & 2033
- Table 3: Global Online Betting for Sports and Casinos Revenue million Forecast, by Region 2020 & 2033
- Table 4: Global Online Betting for Sports and Casinos Revenue million Forecast, by Application 2020 & 2033
- Table 5: Global Online Betting for Sports and Casinos Revenue million Forecast, by Types 2020 & 2033
- Table 6: Global Online Betting for Sports and Casinos Revenue million Forecast, by Country 2020 & 2033
- Table 7: United States Online Betting for Sports and Casinos Revenue (million) Forecast, by Application 2020 & 2033
- Table 8: Canada Online Betting for Sports and Casinos Revenue (million) Forecast, by Application 2020 & 2033
- Table 9: Mexico Online Betting for Sports and Casinos Revenue (million) Forecast, by Application 2020 & 2033
- Table 10: Global Online Betting for Sports and Casinos Revenue million Forecast, by Application 2020 & 2033
- Table 11: Global Online Betting for Sports and Casinos Revenue million Forecast, by Types 2020 & 2033
- Table 12: Global Online Betting for Sports and Casinos Revenue million Forecast, by Country 2020 & 2033
- Table 13: Brazil Online Betting for Sports and Casinos Revenue (million) Forecast, by Application 2020 & 2033
- Table 14: Argentina Online Betting for Sports and Casinos Revenue (million) Forecast, by Application 2020 & 2033
- Table 15: Rest of South America Online Betting for Sports and Casinos Revenue (million) Forecast, by Application 2020 & 2033
- Table 16: Global Online Betting for Sports and Casinos Revenue million Forecast, by Application 2020 & 2033
- Table 17: Global Online Betting for Sports and Casinos Revenue million Forecast, by Types 2020 & 2033
- Table 18: Global Online Betting for Sports and Casinos Revenue million Forecast, by Country 2020 & 2033
- Table 19: United Kingdom Online Betting for Sports and Casinos Revenue (million) Forecast, by Application 2020 & 2033
- Table 20: Germany Online Betting for Sports and Casinos Revenue (million) Forecast, by Application 2020 & 2033
- Table 21: France Online Betting for Sports and Casinos Revenue (million) Forecast, by Application 2020 & 2033
- Table 22: Italy Online Betting for Sports and Casinos Revenue (million) Forecast, by Application 2020 & 2033
- Table 23: Spain Online Betting for Sports and Casinos Revenue (million) Forecast, by Application 2020 & 2033
- Table 24: Russia Online Betting for Sports and Casinos Revenue (million) Forecast, by Application 2020 & 2033
- Table 25: Benelux Online Betting for Sports and Casinos Revenue (million) Forecast, by Application 2020 & 2033
- Table 26: Nordics Online Betting for Sports and Casinos Revenue (million) Forecast, by Application 2020 & 2033
- Table 27: Rest of Europe Online Betting for Sports and Casinos Revenue (million) Forecast, by Application 2020 & 2033
- Table 28: Global Online Betting for Sports and Casinos Revenue million Forecast, by Application 2020 & 2033
- Table 29: Global Online Betting for Sports and Casinos Revenue million Forecast, by Types 2020 & 2033
- Table 30: Global Online Betting for Sports and Casinos Revenue million Forecast, by Country 2020 & 2033
- Table 31: Turkey Online Betting for Sports and Casinos Revenue (million) Forecast, by Application 2020 & 2033
- Table 32: Israel Online Betting for Sports and Casinos Revenue (million) Forecast, by Application 2020 & 2033
- Table 33: GCC Online Betting for Sports and Casinos Revenue (million) Forecast, by Application 2020 & 2033
- Table 34: North Africa Online Betting for Sports and Casinos Revenue (million) Forecast, by Application 2020 & 2033
- Table 35: South Africa Online Betting for Sports and Casinos Revenue (million) Forecast, by Application 2020 & 2033
- Table 36: Rest of Middle East & Africa Online Betting for Sports and Casinos Revenue (million) Forecast, by Application 2020 & 2033
- Table 37: Global Online Betting for Sports and Casinos Revenue million Forecast, by Application 2020 & 2033
- Table 38: Global Online Betting for Sports and Casinos Revenue million Forecast, by Types 2020 & 2033
- Table 39: Global Online Betting for Sports and Casinos Revenue million Forecast, by Country 2020 & 2033
- Table 40: China Online Betting for Sports and Casinos Revenue (million) Forecast, by Application 2020 & 2033
- Table 41: India Online Betting for Sports and Casinos Revenue (million) Forecast, by Application 2020 & 2033
- Table 42: Japan Online Betting for Sports and Casinos Revenue (million) Forecast, by Application 2020 & 2033
- Table 43: South Korea Online Betting for Sports and Casinos Revenue (million) Forecast, by Application 2020 & 2033
- Table 44: ASEAN Online Betting for Sports and Casinos Revenue (million) Forecast, by Application 2020 & 2033
- Table 45: Oceania Online Betting for Sports and Casinos Revenue (million) Forecast, by Application 2020 & 2033
- Table 46: Rest of Asia Pacific Online Betting for Sports and Casinos Revenue (million) Forecast, by Application 2020 & 2033
Frequently Asked Questions
1. What is the projected Compound Annual Growth Rate (CAGR) of the Online Betting for Sports and Casinos?
The projected CAGR is approximately 7.2%.
2. Which companies are prominent players in the Online Betting for Sports and Casinos?
Key companies in the market include Bet365, Kindred Group, Entain plc (formerly GVC Holdings), Flutter Entertainment, William Hill, Pinnacle, The Stars Group, Betvictor, Betsson AB, Gamesys, 888 Holdings, Bet-at-home.com, Intertops, Betway, Betfred, Interwetten, SBOBET, Sportech, EGB, BetOnline, DraftKings, BetWinner, Sports Interaction.
3. What are the main segments of the Online Betting for Sports and Casinos?
The market segments include Application, Types.
4. Can you provide details about the market size?
The market size is estimated to be USD 41110 million as of 2022.
5. What are some drivers contributing to market growth?
N/A
6. What are the notable trends driving market growth?
N/A
7. Are there any restraints impacting market growth?
N/A
8. Can you provide examples of recent developments in the market?
N/A
9. What pricing options are available for accessing the report?
Pricing options include single-user, multi-user, and enterprise licenses priced at USD 2900.00, USD 4350.00, and USD 5800.00 respectively.
10. Is the market size provided in terms of value or volume?
The market size is provided in terms of value, measured in million.
11. Are there any specific market keywords associated with the report?
Yes, the market keyword associated with the report is "Online Betting for Sports and Casinos," which aids in identifying and referencing the specific market segment covered.
12. How do I determine which pricing option suits my needs best?
The pricing options vary based on user requirements and access needs. Individual users may opt for single-user licenses, while businesses requiring broader access may choose multi-user or enterprise licenses for cost-effective access to the report.
13. Are there any additional resources or data provided in the Online Betting for Sports and Casinos report?
While the report offers comprehensive insights, it's advisable to review the specific contents or supplementary materials provided to ascertain if additional resources or data are available.
14. How can I stay updated on further developments or reports in the Online Betting for Sports and Casinos?
To stay informed about further developments, trends, and reports in the Online Betting for Sports and Casinos, consider subscribing to industry newsletters, following relevant companies and organizations, or regularly checking reputable industry news sources and publications.
Methodology
Step 1 - Identification of Relevant Samples Size from Population Database


Step 2 - Approaches for Defining Global Market Size (Value, Volume* & Price*)

Note*: In applicable scenarios
Step 3 - Data Sources
Primary Research
- Web Analytics
- Survey Reports
- Research Institute
- Latest Research Reports
- Opinion Leaders
Secondary Research
- Annual Reports
- White Paper
- Latest Press Release
- Industry Association
- Paid Database
- Investor Presentations

Step 4 - Data Triangulation
Involves using different sources of information in order to increase the validity of a study
These sources are likely to be stakeholders in a program - participants, other researchers, program staff, other community members, and so on.
Then we put all data in single framework & apply various statistical tools to find out the dynamic on the market.
During the analysis stage, feedback from the stakeholder groups would be compared to determine areas of agreement as well as areas of divergence