
Key Insights
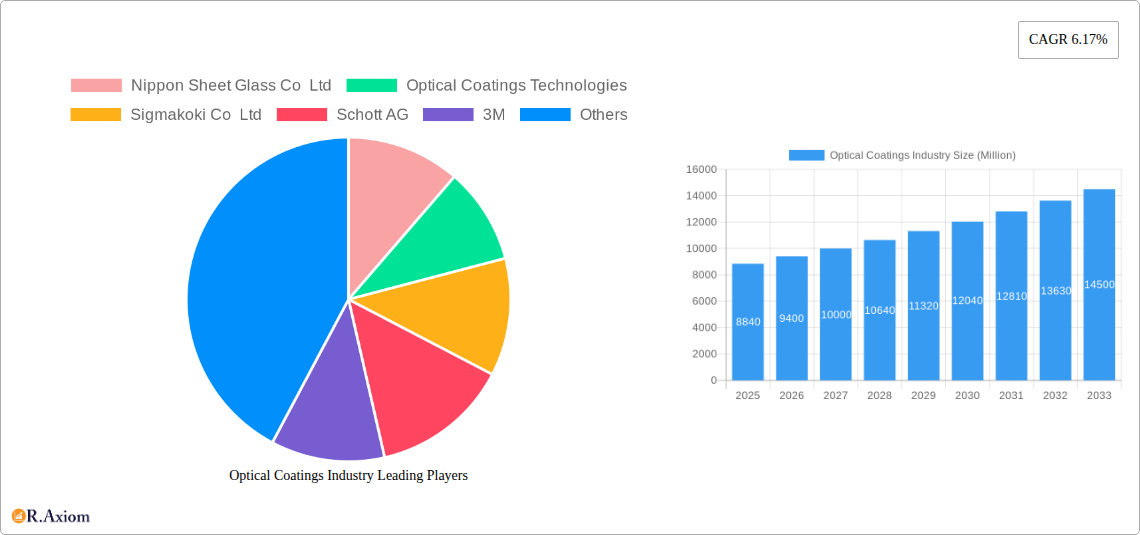
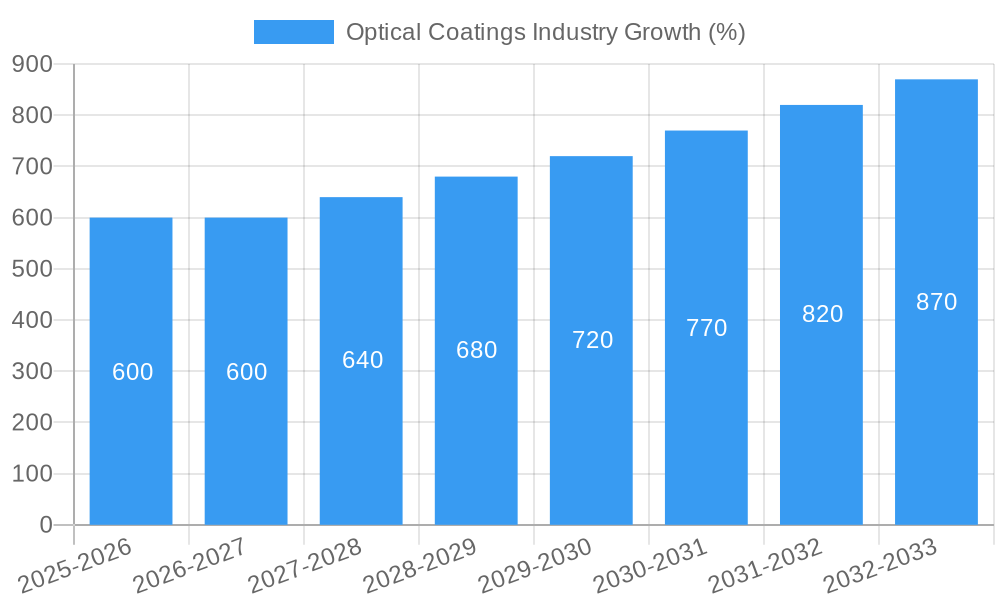
The global optical coatings market, valued at $8.84 billion in 2025, is projected to experience robust growth, driven by a Compound Annual Growth Rate (CAGR) of 6.17% from 2025 to 2033. This expansion is fueled by several key factors. The increasing demand for advanced optical components in diverse sectors like electronics, automotive, and healthcare is a significant driver. Miniaturization trends in electronics necessitate high-performance optical coatings for improved efficiency and functionality in smaller devices. Similarly, the automotive industry's adoption of advanced driver-assistance systems (ADAS) and autonomous driving technologies creates a substantial demand for sophisticated optical coatings in sensors and cameras. The growth of renewable energy, particularly solar power, further contributes to market expansion, as optical coatings enhance solar cell efficiency. Technological advancements, such as the development of more durable and environmentally friendly coating materials, also support market growth. Competition among major players like Nippon Sheet Glass, 3M, and Schott AG is fostering innovation and driving down costs, making optical coatings more accessible across various applications.
However, challenges remain. The high initial investment required for advanced coating technologies and the complexity of manufacturing processes can hinder market penetration, especially for smaller players. Furthermore, the susceptibility of certain coatings to environmental factors like temperature and humidity may limit their lifespan and require more frequent replacements, posing a potential restraint to overall growth. Nevertheless, ongoing research and development efforts focused on improving coating durability and expanding application possibilities are expected to mitigate these challenges and sustain the market's positive trajectory. The market segmentation shows strong growth in Anti-reflective coatings driven by the expanding display market and Chemical Vapor Deposition technology driven by its high precision. Regional growth is expected to be led by Asia-Pacific due to the high concentration of electronics manufacturing and strong growth in renewable energy adoption.
Optical Coatings Industry Market Report: 2019-2033
This comprehensive report provides an in-depth analysis of the global optical coatings industry, encompassing market size, growth projections, competitive landscape, and future trends. The study period covers 2019-2033, with 2025 as the base and estimated year. This report is invaluable for industry stakeholders, investors, and researchers seeking to understand and capitalize on opportunities within this dynamic sector. The market is expected to reach xx Million by 2033, exhibiting a CAGR of xx% during the forecast period (2025-2033).
Optical Coatings Industry Market Concentration & Innovation
The optical coatings industry is characterized by a moderately concentrated market structure, with several large multinational corporations holding significant market share. Key players such as Nippon Sheet Glass Co Ltd, 3M, PPG Industries Inc, and Zeiss International dominate various segments, leveraging their established technological expertise and extensive distribution networks. However, the market also features a number of smaller, specialized companies focusing on niche applications or innovative technologies.
Market Concentration Metrics (2024 Estimates):
- Top 5 players hold approximately xx% of the global market share.
- Average market share of the top 10 players: xx%
Innovation Drivers:
- Advancements in deposition techniques (e.g., Atomic Layer Deposition) are enabling the creation of more precise and durable coatings.
- Growing demand for high-performance coatings in emerging applications (e.g., AR/VR, LiDAR) is spurring innovation.
- Stringent regulatory requirements related to environmental impact are prompting the development of eco-friendly coating materials.
Regulatory Frameworks & M&A Activity:
- Regulatory compliance regarding material safety and environmental impact varies across regions, influencing production and market entry.
- Recent M&A activities, such as Carl Zeiss Meditec's acquisition of Kogent and Katalyst Surgical in April 2022 (valued at xx Million), indicate consolidation trends within the industry. These mergers often aim to expand product portfolios and geographical reach. The total value of M&A deals in the optical coatings industry between 2019 and 2024 is estimated at xx Million.
Product Substitutes & End-User Trends:
- The availability of alternative surface treatment methods presents some competitive pressure. However, the unique optical properties of coated surfaces maintain a strong competitive advantage.
- End-user demand is increasingly driven by the need for improved performance, durability, and cost-effectiveness.
Optical Coatings Industry Industry Trends & Insights
The optical coatings market is experiencing robust growth, driven by several key factors. The increasing adoption of advanced technologies such as smartphones, automobiles, and aerospace equipment fuels the demand for high-performance optical coatings. The rising penetration of optical technologies in healthcare and telecommunications further enhances market growth. The global market size reached xx Million in 2024, and is projected to reach xx Million by 2033.
Technological advancements, particularly in deposition techniques and material science, are enabling the development of coatings with enhanced functionalities and superior performance characteristics. The adoption of sustainable manufacturing practices is also gaining traction, as manufacturers strive to reduce their environmental footprint. Consumer preferences for high-quality, durable products with advanced functionalities are driving demand for innovative coating solutions. The competitive landscape is dynamic, with existing players investing heavily in R&D and emerging companies entering the market with disruptive technologies. This competitive pressure fosters innovation and keeps prices competitive. The market is witnessing a shift towards specialized coatings tailored to specific applications, further driving segmentation and specialization within the industry.
Dominant Markets & Segments in Optical Coatings Industry
Dominant Regions/Countries: North America and Asia-Pacific currently dominate the optical coatings market, driven by strong demand from electronics, automotive, and aerospace sectors. Europe holds a significant share, while other regions are experiencing gradual growth.
Dominant Product Types:
- Anti-reflective coatings: This segment holds the largest market share due to its widespread application across various industries.
- Optical filter coatings: Strong growth is driven by increasing demand for specialized filters in advanced optical systems.
Dominant Technologies:
- Ion-beam sputtering: This technology is preferred for its ability to produce high-quality, durable coatings.
- Chemical vapor deposition: Widely used for its scalability and cost-effectiveness.
Dominant End-User Industries:
- Electronics and semiconductors: High demand for advanced coatings in displays, sensors, and other components fuels market growth.
- Automotive: Increasing use of advanced driver-assistance systems (ADAS) and autonomous driving technologies drives demand for specialized coatings.
Key Drivers (by Segment):
- Electronics and Semiconductors: Technological advancements in electronics, miniaturization trends, and growth in the semiconductor industry.
- Automotive: Growing adoption of ADAS, increasing demand for improved vehicle safety and fuel efficiency.
- Aerospace & Defense: Demand for high-performance coatings in defense systems and space applications.
Optical Coatings Industry Product Developments
Recent product innovations include coatings with enhanced durability, improved optical properties, and specialized functionalities. For example, the development of self-cleaning coatings has gained significant traction, offering improved performance and reduced maintenance costs. Manufacturers are focusing on developing coatings with enhanced resistance to harsh environmental conditions, tailored for specific applications like aerospace and automotive. The integration of nanotechnology is also paving the way for new coatings with superior optical properties and functionalities. These developments cater to the increasing demand for high-performance coatings in various sectors, bolstering the competitive landscape.
Report Scope & Segmentation Analysis
This report provides a detailed segmentation analysis of the optical coatings market across product type (Optical Filter Coatings, Anti-reflective Coatings, Transparent Conductive Coatings, Mirror Coatings (High Reflective), Beam Splitter Coatings, Other Product Types), technology (Chemical Vapor Deposition, Ion-beam Sputtering, Plasma Sputtering, Atomic Layer Deposition, Sub-wavelength Structured Surfaces), and end-user industry (Aerospace and Defense, Electronics and Semiconductors, Telecommunications, Healthcare, Solar, Automotive, Other End-user Industries). Each segment's growth projections, market sizes, and competitive dynamics are thoroughly analyzed. The market is further segmented by geographic region, offering detailed insights into regional variations and trends.
Key Drivers of Optical Coatings Industry Growth
The optical coatings industry is experiencing significant growth due to several key factors. Technological advancements are leading to the development of more efficient and durable coatings. The increasing demand for high-performance coatings in various end-user industries, such as electronics, automotive, and aerospace, is a significant driver. Favorable government policies and initiatives promoting technological innovation and sustainable manufacturing practices are also contributing to market expansion. Furthermore, rising consumer demand for high-quality products with enhanced functionalities fuels the growth.
Challenges in the Optical Coatings Industry Sector
The optical coatings industry faces several challenges. Stringent environmental regulations and the rising cost of raw materials pose significant hurdles for manufacturers. Intense competition, especially from low-cost producers, puts pressure on profit margins. Supply chain disruptions can impact production and lead to delays in delivery. Furthermore, the need for continuous innovation to meet evolving customer needs and technological advancements presents ongoing challenges.
Emerging Opportunities in Optical Coatings Industry
The optical coatings industry presents several emerging opportunities. The growing adoption of augmented reality (AR) and virtual reality (VR) technologies is creating demand for specialized coatings. The rising demand for energy-efficient solutions in the solar energy sector is fueling the growth of solar coatings. The development of novel coating materials with improved properties and functionalities opens new avenues for innovation. Expansion into emerging markets and the development of sustainable manufacturing practices offer further opportunities for growth.
Leading Players in the Optical Coatings Industry Market
- Nippon Sheet Glass Co Ltd
- Optical Coatings Technologies
- Sigmakoki Co Ltd
- Schott AG
- 3M
- PPG Industries Inc
- Quantum Coating
- Zeiss International
- Edmund Optics Inc
- DuPont
- Inrad Optics
- Artemis Optical Ltd
- Accucoat Inc
- Materion Corporation
- Abrisa Technologies
- Reynard Corporation
- Newport Corporation
- Zygo Corporation
Key Developments in Optical Coatings Industry Industry
- April 2022: Imatest partnered with Edmund Optics Inc., enabling seamless purchase of Imatest software and charts via Edmund Optics' website. This improved access to image quality evaluation tools for Edmund Optics' customers.
- April 2022: Edmund Optics Inc. opened a new facility in New Jersey, enhancing internal/external collaboration, services, and technical support.
- April 2022: Carl Zeiss Meditec acquired Kogent Surgical, LLC and Katalyst Surgical, LLC, strengthening its surgical solutions offerings and expanding its market reach.
Strategic Outlook for Optical Coatings Industry Market
The optical coatings industry is poised for continued growth, driven by technological advancements and increasing demand across various sectors. The development of novel coating materials and improved deposition techniques will further enhance product performance and expand applications. The growing adoption of sustainable manufacturing practices will create new opportunities for environmentally friendly coatings. Strategic partnerships and collaborations will play a key role in driving innovation and market expansion. Companies focusing on niche applications and offering customized solutions will gain a competitive advantage. The continued penetration of advanced technologies in various industries will ensure a robust growth trajectory for the optical coatings market in the coming years.
Optical Coatings Industry Segmentation
-
1. Product Type
- 1.1. Optical Filter Coatings
- 1.2. Anti-reflective Coatings
- 1.3. Transparent Conductive Coatings
- 1.4. Mirror Coatings (High Reflective)
- 1.5. Beam Splitter Coatings
- 1.6. Other Pr
-
2. Technology
- 2.1. Chemical Vapor Deposition
- 2.2. Ion-beam Sputtering
- 2.3. Plasma Sputtering
- 2.4. Atomic Layer Deposition
- 2.5. Sub-wavelength Structured Surfaces
-
3. End-user Industry
- 3.1. Aerospace and Defense
- 3.2. Electronics and Semiconductors
- 3.3. Telecommunications
- 3.4. Healthcare
- 3.5. Solar
- 3.6. Automotive
- 3.7. Other En
Optical Coatings Industry Segmentation By Geography
-
1. Asia Pacific
- 1.1. China
- 1.2. India
- 1.3. Japan
- 1.4. South Korea
- 1.5. Malaysia
- 1.6. Thailand
- 1.7. Indonesia
- 1.8. Vietnam
- 1.9. Rest of Asia Pacific
-
2. North America
- 2.1. United States
- 2.2. Canada
- 2.3. Mexico
-
3. Europe
- 3.1. Germany
- 3.2. United Kingdom
- 3.3. Italy
- 3.4. France
- 3.5. Spain
- 3.6. Nordic Countries
- 3.7. Turkey
- 3.8. Russia
- 3.9. Rest of Europe
-
4. South America
- 4.1. Brazil
- 4.2. Argentina
- 4.3. Colombia
- 4.4. Rest of South America
-
5. Middle East and Africa
- 5.1. Saudi Arabia
- 5.2. South Africa
- 5.3. Qatar
- 5.4. United Arab Emirates
- 5.5. Nigeria
- 5.6. Egypt
- 5.7. Rest of Middle East and Africa

Optical Coatings Industry REPORT HIGHLIGHTS
| Aspects | Details |
|---|---|
| Study Period | 2019-2033 |
| Base Year | 2024 |
| Estimated Year | 2025 |
| Forecast Period | 2025-2033 |
| Historical Period | 2019-2024 |
| Growth Rate | CAGR of 6.17% from 2019-2033 |
| Segmentation |
|
Table of Contents
- 1. Introduction
- 1.1. Research Scope
- 1.2. Market Segmentation
- 1.3. Research Methodology
- 1.4. Definitions and Assumptions
- 2. Executive Summary
- 2.1. Introduction
- 3. Market Dynamics
- 3.1. Introduction
- 3.2. Market Drivers
- 3.2.1. Growing Demand from the Solar Industry; Technological Advancements in the Optical Coatings Process
- 3.3. Market Restrains
- 3.3.1. High Costs and Some Limiting Properties of Optical Coatings
- 3.4. Market Trends
- 3.4.1. The Electronics and Semiconductors Segment is Expected to Dominate the Market
- 4. Market Factor Analysis
- 4.1. Porters Five Forces
- 4.2. Supply/Value Chain
- 4.3. PESTEL analysis
- 4.4. Market Entropy
- 4.5. Patent/Trademark Analysis
- 5. Global Optical Coatings Industry Analysis, Insights and Forecast, 2019-2031
- 5.1. Market Analysis, Insights and Forecast - by Product Type
- 5.1.1. Optical Filter Coatings
- 5.1.2. Anti-reflective Coatings
- 5.1.3. Transparent Conductive Coatings
- 5.1.4. Mirror Coatings (High Reflective)
- 5.1.5. Beam Splitter Coatings
- 5.1.6. Other Pr
- 5.2. Market Analysis, Insights and Forecast - by Technology
- 5.2.1. Chemical Vapor Deposition
- 5.2.2. Ion-beam Sputtering
- 5.2.3. Plasma Sputtering
- 5.2.4. Atomic Layer Deposition
- 5.2.5. Sub-wavelength Structured Surfaces
- 5.3. Market Analysis, Insights and Forecast - by End-user Industry
- 5.3.1. Aerospace and Defense
- 5.3.2. Electronics and Semiconductors
- 5.3.3. Telecommunications
- 5.3.4. Healthcare
- 5.3.5. Solar
- 5.3.6. Automotive
- 5.3.7. Other En
- 5.4. Market Analysis, Insights and Forecast - by Region
- 5.4.1. Asia Pacific
- 5.4.2. North America
- 5.4.3. Europe
- 5.4.4. South America
- 5.4.5. Middle East and Africa
- 5.1. Market Analysis, Insights and Forecast - by Product Type
- 6. Asia Pacific Optical Coatings Industry Analysis, Insights and Forecast, 2019-2031
- 6.1. Market Analysis, Insights and Forecast - by Product Type
- 6.1.1. Optical Filter Coatings
- 6.1.2. Anti-reflective Coatings
- 6.1.3. Transparent Conductive Coatings
- 6.1.4. Mirror Coatings (High Reflective)
- 6.1.5. Beam Splitter Coatings
- 6.1.6. Other Pr
- 6.2. Market Analysis, Insights and Forecast - by Technology
- 6.2.1. Chemical Vapor Deposition
- 6.2.2. Ion-beam Sputtering
- 6.2.3. Plasma Sputtering
- 6.2.4. Atomic Layer Deposition
- 6.2.5. Sub-wavelength Structured Surfaces
- 6.3. Market Analysis, Insights and Forecast - by End-user Industry
- 6.3.1. Aerospace and Defense
- 6.3.2. Electronics and Semiconductors
- 6.3.3. Telecommunications
- 6.3.4. Healthcare
- 6.3.5. Solar
- 6.3.6. Automotive
- 6.3.7. Other En
- 6.1. Market Analysis, Insights and Forecast - by Product Type
- 7. North America Optical Coatings Industry Analysis, Insights and Forecast, 2019-2031
- 7.1. Market Analysis, Insights and Forecast - by Product Type
- 7.1.1. Optical Filter Coatings
- 7.1.2. Anti-reflective Coatings
- 7.1.3. Transparent Conductive Coatings
- 7.1.4. Mirror Coatings (High Reflective)
- 7.1.5. Beam Splitter Coatings
- 7.1.6. Other Pr
- 7.2. Market Analysis, Insights and Forecast - by Technology
- 7.2.1. Chemical Vapor Deposition
- 7.2.2. Ion-beam Sputtering
- 7.2.3. Plasma Sputtering
- 7.2.4. Atomic Layer Deposition
- 7.2.5. Sub-wavelength Structured Surfaces
- 7.3. Market Analysis, Insights and Forecast - by End-user Industry
- 7.3.1. Aerospace and Defense
- 7.3.2. Electronics and Semiconductors
- 7.3.3. Telecommunications
- 7.3.4. Healthcare
- 7.3.5. Solar
- 7.3.6. Automotive
- 7.3.7. Other En
- 7.1. Market Analysis, Insights and Forecast - by Product Type
- 8. Europe Optical Coatings Industry Analysis, Insights and Forecast, 2019-2031
- 8.1. Market Analysis, Insights and Forecast - by Product Type
- 8.1.1. Optical Filter Coatings
- 8.1.2. Anti-reflective Coatings
- 8.1.3. Transparent Conductive Coatings
- 8.1.4. Mirror Coatings (High Reflective)
- 8.1.5. Beam Splitter Coatings
- 8.1.6. Other Pr
- 8.2. Market Analysis, Insights and Forecast - by Technology
- 8.2.1. Chemical Vapor Deposition
- 8.2.2. Ion-beam Sputtering
- 8.2.3. Plasma Sputtering
- 8.2.4. Atomic Layer Deposition
- 8.2.5. Sub-wavelength Structured Surfaces
- 8.3. Market Analysis, Insights and Forecast - by End-user Industry
- 8.3.1. Aerospace and Defense
- 8.3.2. Electronics and Semiconductors
- 8.3.3. Telecommunications
- 8.3.4. Healthcare
- 8.3.5. Solar
- 8.3.6. Automotive
- 8.3.7. Other En
- 8.1. Market Analysis, Insights and Forecast - by Product Type
- 9. South America Optical Coatings Industry Analysis, Insights and Forecast, 2019-2031
- 9.1. Market Analysis, Insights and Forecast - by Product Type
- 9.1.1. Optical Filter Coatings
- 9.1.2. Anti-reflective Coatings
- 9.1.3. Transparent Conductive Coatings
- 9.1.4. Mirror Coatings (High Reflective)
- 9.1.5. Beam Splitter Coatings
- 9.1.6. Other Pr
- 9.2. Market Analysis, Insights and Forecast - by Technology
- 9.2.1. Chemical Vapor Deposition
- 9.2.2. Ion-beam Sputtering
- 9.2.3. Plasma Sputtering
- 9.2.4. Atomic Layer Deposition
- 9.2.5. Sub-wavelength Structured Surfaces
- 9.3. Market Analysis, Insights and Forecast - by End-user Industry
- 9.3.1. Aerospace and Defense
- 9.3.2. Electronics and Semiconductors
- 9.3.3. Telecommunications
- 9.3.4. Healthcare
- 9.3.5. Solar
- 9.3.6. Automotive
- 9.3.7. Other En
- 9.1. Market Analysis, Insights and Forecast - by Product Type
- 10. Middle East and Africa Optical Coatings Industry Analysis, Insights and Forecast, 2019-2031
- 10.1. Market Analysis, Insights and Forecast - by Product Type
- 10.1.1. Optical Filter Coatings
- 10.1.2. Anti-reflective Coatings
- 10.1.3. Transparent Conductive Coatings
- 10.1.4. Mirror Coatings (High Reflective)
- 10.1.5. Beam Splitter Coatings
- 10.1.6. Other Pr
- 10.2. Market Analysis, Insights and Forecast - by Technology
- 10.2.1. Chemical Vapor Deposition
- 10.2.2. Ion-beam Sputtering
- 10.2.3. Plasma Sputtering
- 10.2.4. Atomic Layer Deposition
- 10.2.5. Sub-wavelength Structured Surfaces
- 10.3. Market Analysis, Insights and Forecast - by End-user Industry
- 10.3.1. Aerospace and Defense
- 10.3.2. Electronics and Semiconductors
- 10.3.3. Telecommunications
- 10.3.4. Healthcare
- 10.3.5. Solar
- 10.3.6. Automotive
- 10.3.7. Other En
- 10.1. Market Analysis, Insights and Forecast - by Product Type
- 11. Asia Pacific Optical Coatings Industry Analysis, Insights and Forecast, 2019-2031
- 11.1. Market Analysis, Insights and Forecast - By Country/Sub-region
- 11.1.1 China
- 11.1.2 India
- 11.1.3 Japan
- 11.1.4 South Korea
- 11.1.5 Rest of Asia Pacific
- 12. North America Optical Coatings Industry Analysis, Insights and Forecast, 2019-2031
- 12.1. Market Analysis, Insights and Forecast - By Country/Sub-region
- 12.1.1 United States
- 12.1.2 Canada
- 12.1.3 Mexico
- 13. Europe Optical Coatings Industry Analysis, Insights and Forecast, 2019-2031
- 13.1. Market Analysis, Insights and Forecast - By Country/Sub-region
- 13.1.1 Germany
- 13.1.2 United Kingdom
- 13.1.3 Italy
- 13.1.4 France
- 13.1.5 Rest of Europe
- 14. South America Optical Coatings Industry Analysis, Insights and Forecast, 2019-2031
- 14.1. Market Analysis, Insights and Forecast - By Country/Sub-region
- 14.1.1 Brazil
- 14.1.2 Argentina
- 14.1.3 Rest of South America
- 15. Middle East and Africa Optical Coatings Industry Analysis, Insights and Forecast, 2019-2031
- 15.1. Market Analysis, Insights and Forecast - By Country/Sub-region
- 15.1.1 Saudi Arabia
- 15.1.2 South Africa
- 15.1.3 Rest of Middle East and Africa
- 16. Competitive Analysis
- 16.1. Global Market Share Analysis 2024
- 16.2. Company Profiles
- 16.2.1 Nippon Sheet Glass Co Ltd
- 16.2.1.1. Overview
- 16.2.1.2. Products
- 16.2.1.3. SWOT Analysis
- 16.2.1.4. Recent Developments
- 16.2.1.5. Financials (Based on Availability)
- 16.2.2 Optical Coatings Technologies
- 16.2.2.1. Overview
- 16.2.2.2. Products
- 16.2.2.3. SWOT Analysis
- 16.2.2.4. Recent Developments
- 16.2.2.5. Financials (Based on Availability)
- 16.2.3 Sigmakoki Co Ltd
- 16.2.3.1. Overview
- 16.2.3.2. Products
- 16.2.3.3. SWOT Analysis
- 16.2.3.4. Recent Developments
- 16.2.3.5. Financials (Based on Availability)
- 16.2.4 Schott AG
- 16.2.4.1. Overview
- 16.2.4.2. Products
- 16.2.4.3. SWOT Analysis
- 16.2.4.4. Recent Developments
- 16.2.4.5. Financials (Based on Availability)
- 16.2.5 3M
- 16.2.5.1. Overview
- 16.2.5.2. Products
- 16.2.5.3. SWOT Analysis
- 16.2.5.4. Recent Developments
- 16.2.5.5. Financials (Based on Availability)
- 16.2.6 PPG Industries Inc
- 16.2.6.1. Overview
- 16.2.6.2. Products
- 16.2.6.3. SWOT Analysis
- 16.2.6.4. Recent Developments
- 16.2.6.5. Financials (Based on Availability)
- 16.2.7 Quantum Coating
- 16.2.7.1. Overview
- 16.2.7.2. Products
- 16.2.7.3. SWOT Analysis
- 16.2.7.4. Recent Developments
- 16.2.7.5. Financials (Based on Availability)
- 16.2.8 Zeiss International
- 16.2.8.1. Overview
- 16.2.8.2. Products
- 16.2.8.3. SWOT Analysis
- 16.2.8.4. Recent Developments
- 16.2.8.5. Financials (Based on Availability)
- 16.2.9 Edmund Optics Inc
- 16.2.9.1. Overview
- 16.2.9.2. Products
- 16.2.9.3. SWOT Analysis
- 16.2.9.4. Recent Developments
- 16.2.9.5. Financials (Based on Availability)
- 16.2.10 DuPont
- 16.2.10.1. Overview
- 16.2.10.2. Products
- 16.2.10.3. SWOT Analysis
- 16.2.10.4. Recent Developments
- 16.2.10.5. Financials (Based on Availability)
- 16.2.11 Inrad Optics
- 16.2.11.1. Overview
- 16.2.11.2. Products
- 16.2.11.3. SWOT Analysis
- 16.2.11.4. Recent Developments
- 16.2.11.5. Financials (Based on Availability)
- 16.2.12 Artemis Optical Ltd
- 16.2.12.1. Overview
- 16.2.12.2. Products
- 16.2.12.3. SWOT Analysis
- 16.2.12.4. Recent Developments
- 16.2.12.5. Financials (Based on Availability)
- 16.2.13 Accucoat Inc
- 16.2.13.1. Overview
- 16.2.13.2. Products
- 16.2.13.3. SWOT Analysis
- 16.2.13.4. Recent Developments
- 16.2.13.5. Financials (Based on Availability)
- 16.2.14 Materion Corporation
- 16.2.14.1. Overview
- 16.2.14.2. Products
- 16.2.14.3. SWOT Analysis
- 16.2.14.4. Recent Developments
- 16.2.14.5. Financials (Based on Availability)
- 16.2.15 Abrisa Technologies
- 16.2.15.1. Overview
- 16.2.15.2. Products
- 16.2.15.3. SWOT Analysis
- 16.2.15.4. Recent Developments
- 16.2.15.5. Financials (Based on Availability)
- 16.2.16 Reynard Corporation
- 16.2.16.1. Overview
- 16.2.16.2. Products
- 16.2.16.3. SWOT Analysis
- 16.2.16.4. Recent Developments
- 16.2.16.5. Financials (Based on Availability)
- 16.2.17 Newport Corporation
- 16.2.17.1. Overview
- 16.2.17.2. Products
- 16.2.17.3. SWOT Analysis
- 16.2.17.4. Recent Developments
- 16.2.17.5. Financials (Based on Availability)
- 16.2.18 Zygo Corporation*List Not Exhaustive
- 16.2.18.1. Overview
- 16.2.18.2. Products
- 16.2.18.3. SWOT Analysis
- 16.2.18.4. Recent Developments
- 16.2.18.5. Financials (Based on Availability)
- 16.2.1 Nippon Sheet Glass Co Ltd
List of Figures
- Figure 1: Global Optical Coatings Industry Revenue Breakdown (Million, %) by Region 2024 & 2032
- Figure 2: Asia Pacific Optical Coatings Industry Revenue (Million), by Country 2024 & 2032
- Figure 3: Asia Pacific Optical Coatings Industry Revenue Share (%), by Country 2024 & 2032
- Figure 4: North America Optical Coatings Industry Revenue (Million), by Country 2024 & 2032
- Figure 5: North America Optical Coatings Industry Revenue Share (%), by Country 2024 & 2032
- Figure 6: Europe Optical Coatings Industry Revenue (Million), by Country 2024 & 2032
- Figure 7: Europe Optical Coatings Industry Revenue Share (%), by Country 2024 & 2032
- Figure 8: South America Optical Coatings Industry Revenue (Million), by Country 2024 & 2032
- Figure 9: South America Optical Coatings Industry Revenue Share (%), by Country 2024 & 2032
- Figure 10: Middle East and Africa Optical Coatings Industry Revenue (Million), by Country 2024 & 2032
- Figure 11: Middle East and Africa Optical Coatings Industry Revenue Share (%), by Country 2024 & 2032
- Figure 12: Asia Pacific Optical Coatings Industry Revenue (Million), by Product Type 2024 & 2032
- Figure 13: Asia Pacific Optical Coatings Industry Revenue Share (%), by Product Type 2024 & 2032
- Figure 14: Asia Pacific Optical Coatings Industry Revenue (Million), by Technology 2024 & 2032
- Figure 15: Asia Pacific Optical Coatings Industry Revenue Share (%), by Technology 2024 & 2032
- Figure 16: Asia Pacific Optical Coatings Industry Revenue (Million), by End-user Industry 2024 & 2032
- Figure 17: Asia Pacific Optical Coatings Industry Revenue Share (%), by End-user Industry 2024 & 2032
- Figure 18: Asia Pacific Optical Coatings Industry Revenue (Million), by Country 2024 & 2032
- Figure 19: Asia Pacific Optical Coatings Industry Revenue Share (%), by Country 2024 & 2032
- Figure 20: North America Optical Coatings Industry Revenue (Million), by Product Type 2024 & 2032
- Figure 21: North America Optical Coatings Industry Revenue Share (%), by Product Type 2024 & 2032
- Figure 22: North America Optical Coatings Industry Revenue (Million), by Technology 2024 & 2032
- Figure 23: North America Optical Coatings Industry Revenue Share (%), by Technology 2024 & 2032
- Figure 24: North America Optical Coatings Industry Revenue (Million), by End-user Industry 2024 & 2032
- Figure 25: North America Optical Coatings Industry Revenue Share (%), by End-user Industry 2024 & 2032
- Figure 26: North America Optical Coatings Industry Revenue (Million), by Country 2024 & 2032
- Figure 27: North America Optical Coatings Industry Revenue Share (%), by Country 2024 & 2032
- Figure 28: Europe Optical Coatings Industry Revenue (Million), by Product Type 2024 & 2032
- Figure 29: Europe Optical Coatings Industry Revenue Share (%), by Product Type 2024 & 2032
- Figure 30: Europe Optical Coatings Industry Revenue (Million), by Technology 2024 & 2032
- Figure 31: Europe Optical Coatings Industry Revenue Share (%), by Technology 2024 & 2032
- Figure 32: Europe Optical Coatings Industry Revenue (Million), by End-user Industry 2024 & 2032
- Figure 33: Europe Optical Coatings Industry Revenue Share (%), by End-user Industry 2024 & 2032
- Figure 34: Europe Optical Coatings Industry Revenue (Million), by Country 2024 & 2032
- Figure 35: Europe Optical Coatings Industry Revenue Share (%), by Country 2024 & 2032
- Figure 36: South America Optical Coatings Industry Revenue (Million), by Product Type 2024 & 2032
- Figure 37: South America Optical Coatings Industry Revenue Share (%), by Product Type 2024 & 2032
- Figure 38: South America Optical Coatings Industry Revenue (Million), by Technology 2024 & 2032
- Figure 39: South America Optical Coatings Industry Revenue Share (%), by Technology 2024 & 2032
- Figure 40: South America Optical Coatings Industry Revenue (Million), by End-user Industry 2024 & 2032
- Figure 41: South America Optical Coatings Industry Revenue Share (%), by End-user Industry 2024 & 2032
- Figure 42: South America Optical Coatings Industry Revenue (Million), by Country 2024 & 2032
- Figure 43: South America Optical Coatings Industry Revenue Share (%), by Country 2024 & 2032
- Figure 44: Middle East and Africa Optical Coatings Industry Revenue (Million), by Product Type 2024 & 2032
- Figure 45: Middle East and Africa Optical Coatings Industry Revenue Share (%), by Product Type 2024 & 2032
- Figure 46: Middle East and Africa Optical Coatings Industry Revenue (Million), by Technology 2024 & 2032
- Figure 47: Middle East and Africa Optical Coatings Industry Revenue Share (%), by Technology 2024 & 2032
- Figure 48: Middle East and Africa Optical Coatings Industry Revenue (Million), by End-user Industry 2024 & 2032
- Figure 49: Middle East and Africa Optical Coatings Industry Revenue Share (%), by End-user Industry 2024 & 2032
- Figure 50: Middle East and Africa Optical Coatings Industry Revenue (Million), by Country 2024 & 2032
- Figure 51: Middle East and Africa Optical Coatings Industry Revenue Share (%), by Country 2024 & 2032
List of Tables
- Table 1: Global Optical Coatings Industry Revenue Million Forecast, by Region 2019 & 2032
- Table 2: Global Optical Coatings Industry Revenue Million Forecast, by Product Type 2019 & 2032
- Table 3: Global Optical Coatings Industry Revenue Million Forecast, by Technology 2019 & 2032
- Table 4: Global Optical Coatings Industry Revenue Million Forecast, by End-user Industry 2019 & 2032
- Table 5: Global Optical Coatings Industry Revenue Million Forecast, by Region 2019 & 2032
- Table 6: Global Optical Coatings Industry Revenue Million Forecast, by Country 2019 & 2032
- Table 7: China Optical Coatings Industry Revenue (Million) Forecast, by Application 2019 & 2032
- Table 8: India Optical Coatings Industry Revenue (Million) Forecast, by Application 2019 & 2032
- Table 9: Japan Optical Coatings Industry Revenue (Million) Forecast, by Application 2019 & 2032
- Table 10: South Korea Optical Coatings Industry Revenue (Million) Forecast, by Application 2019 & 2032
- Table 11: Rest of Asia Pacific Optical Coatings Industry Revenue (Million) Forecast, by Application 2019 & 2032
- Table 12: Global Optical Coatings Industry Revenue Million Forecast, by Country 2019 & 2032
- Table 13: United States Optical Coatings Industry Revenue (Million) Forecast, by Application 2019 & 2032
- Table 14: Canada Optical Coatings Industry Revenue (Million) Forecast, by Application 2019 & 2032
- Table 15: Mexico Optical Coatings Industry Revenue (Million) Forecast, by Application 2019 & 2032
- Table 16: Global Optical Coatings Industry Revenue Million Forecast, by Country 2019 & 2032
- Table 17: Germany Optical Coatings Industry Revenue (Million) Forecast, by Application 2019 & 2032
- Table 18: United Kingdom Optical Coatings Industry Revenue (Million) Forecast, by Application 2019 & 2032
- Table 19: Italy Optical Coatings Industry Revenue (Million) Forecast, by Application 2019 & 2032
- Table 20: France Optical Coatings Industry Revenue (Million) Forecast, by Application 2019 & 2032
- Table 21: Rest of Europe Optical Coatings Industry Revenue (Million) Forecast, by Application 2019 & 2032
- Table 22: Global Optical Coatings Industry Revenue Million Forecast, by Country 2019 & 2032
- Table 23: Brazil Optical Coatings Industry Revenue (Million) Forecast, by Application 2019 & 2032
- Table 24: Argentina Optical Coatings Industry Revenue (Million) Forecast, by Application 2019 & 2032
- Table 25: Rest of South America Optical Coatings Industry Revenue (Million) Forecast, by Application 2019 & 2032
- Table 26: Global Optical Coatings Industry Revenue Million Forecast, by Country 2019 & 2032
- Table 27: Saudi Arabia Optical Coatings Industry Revenue (Million) Forecast, by Application 2019 & 2032
- Table 28: South Africa Optical Coatings Industry Revenue (Million) Forecast, by Application 2019 & 2032
- Table 29: Rest of Middle East and Africa Optical Coatings Industry Revenue (Million) Forecast, by Application 2019 & 2032
- Table 30: Global Optical Coatings Industry Revenue Million Forecast, by Product Type 2019 & 2032
- Table 31: Global Optical Coatings Industry Revenue Million Forecast, by Technology 2019 & 2032
- Table 32: Global Optical Coatings Industry Revenue Million Forecast, by End-user Industry 2019 & 2032
- Table 33: Global Optical Coatings Industry Revenue Million Forecast, by Country 2019 & 2032
- Table 34: China Optical Coatings Industry Revenue (Million) Forecast, by Application 2019 & 2032
- Table 35: India Optical Coatings Industry Revenue (Million) Forecast, by Application 2019 & 2032
- Table 36: Japan Optical Coatings Industry Revenue (Million) Forecast, by Application 2019 & 2032
- Table 37: South Korea Optical Coatings Industry Revenue (Million) Forecast, by Application 2019 & 2032
- Table 38: Malaysia Optical Coatings Industry Revenue (Million) Forecast, by Application 2019 & 2032
- Table 39: Thailand Optical Coatings Industry Revenue (Million) Forecast, by Application 2019 & 2032
- Table 40: Indonesia Optical Coatings Industry Revenue (Million) Forecast, by Application 2019 & 2032
- Table 41: Vietnam Optical Coatings Industry Revenue (Million) Forecast, by Application 2019 & 2032
- Table 42: Rest of Asia Pacific Optical Coatings Industry Revenue (Million) Forecast, by Application 2019 & 2032
- Table 43: Global Optical Coatings Industry Revenue Million Forecast, by Product Type 2019 & 2032
- Table 44: Global Optical Coatings Industry Revenue Million Forecast, by Technology 2019 & 2032
- Table 45: Global Optical Coatings Industry Revenue Million Forecast, by End-user Industry 2019 & 2032
- Table 46: Global Optical Coatings Industry Revenue Million Forecast, by Country 2019 & 2032
- Table 47: United States Optical Coatings Industry Revenue (Million) Forecast, by Application 2019 & 2032
- Table 48: Canada Optical Coatings Industry Revenue (Million) Forecast, by Application 2019 & 2032
- Table 49: Mexico Optical Coatings Industry Revenue (Million) Forecast, by Application 2019 & 2032
- Table 50: Global Optical Coatings Industry Revenue Million Forecast, by Product Type 2019 & 2032
- Table 51: Global Optical Coatings Industry Revenue Million Forecast, by Technology 2019 & 2032
- Table 52: Global Optical Coatings Industry Revenue Million Forecast, by End-user Industry 2019 & 2032
- Table 53: Global Optical Coatings Industry Revenue Million Forecast, by Country 2019 & 2032
- Table 54: Germany Optical Coatings Industry Revenue (Million) Forecast, by Application 2019 & 2032
- Table 55: United Kingdom Optical Coatings Industry Revenue (Million) Forecast, by Application 2019 & 2032
- Table 56: Italy Optical Coatings Industry Revenue (Million) Forecast, by Application 2019 & 2032
- Table 57: France Optical Coatings Industry Revenue (Million) Forecast, by Application 2019 & 2032
- Table 58: Spain Optical Coatings Industry Revenue (Million) Forecast, by Application 2019 & 2032
- Table 59: Nordic Countries Optical Coatings Industry Revenue (Million) Forecast, by Application 2019 & 2032
- Table 60: Turkey Optical Coatings Industry Revenue (Million) Forecast, by Application 2019 & 2032
- Table 61: Russia Optical Coatings Industry Revenue (Million) Forecast, by Application 2019 & 2032
- Table 62: Rest of Europe Optical Coatings Industry Revenue (Million) Forecast, by Application 2019 & 2032
- Table 63: Global Optical Coatings Industry Revenue Million Forecast, by Product Type 2019 & 2032
- Table 64: Global Optical Coatings Industry Revenue Million Forecast, by Technology 2019 & 2032
- Table 65: Global Optical Coatings Industry Revenue Million Forecast, by End-user Industry 2019 & 2032
- Table 66: Global Optical Coatings Industry Revenue Million Forecast, by Country 2019 & 2032
- Table 67: Brazil Optical Coatings Industry Revenue (Million) Forecast, by Application 2019 & 2032
- Table 68: Argentina Optical Coatings Industry Revenue (Million) Forecast, by Application 2019 & 2032
- Table 69: Colombia Optical Coatings Industry Revenue (Million) Forecast, by Application 2019 & 2032
- Table 70: Rest of South America Optical Coatings Industry Revenue (Million) Forecast, by Application 2019 & 2032
- Table 71: Global Optical Coatings Industry Revenue Million Forecast, by Product Type 2019 & 2032
- Table 72: Global Optical Coatings Industry Revenue Million Forecast, by Technology 2019 & 2032
- Table 73: Global Optical Coatings Industry Revenue Million Forecast, by End-user Industry 2019 & 2032
- Table 74: Global Optical Coatings Industry Revenue Million Forecast, by Country 2019 & 2032
- Table 75: Saudi Arabia Optical Coatings Industry Revenue (Million) Forecast, by Application 2019 & 2032
- Table 76: South Africa Optical Coatings Industry Revenue (Million) Forecast, by Application 2019 & 2032
- Table 77: Qatar Optical Coatings Industry Revenue (Million) Forecast, by Application 2019 & 2032
- Table 78: United Arab Emirates Optical Coatings Industry Revenue (Million) Forecast, by Application 2019 & 2032
- Table 79: Nigeria Optical Coatings Industry Revenue (Million) Forecast, by Application 2019 & 2032
- Table 80: Egypt Optical Coatings Industry Revenue (Million) Forecast, by Application 2019 & 2032
- Table 81: Rest of Middle East and Africa Optical Coatings Industry Revenue (Million) Forecast, by Application 2019 & 2032
Frequently Asked Questions
1. What is the projected Compound Annual Growth Rate (CAGR) of the Optical Coatings Industry?
The projected CAGR is approximately 6.17%.
2. Which companies are prominent players in the Optical Coatings Industry?
Key companies in the market include Nippon Sheet Glass Co Ltd, Optical Coatings Technologies, Sigmakoki Co Ltd, Schott AG, 3M, PPG Industries Inc, Quantum Coating, Zeiss International, Edmund Optics Inc, DuPont, Inrad Optics, Artemis Optical Ltd, Accucoat Inc, Materion Corporation, Abrisa Technologies, Reynard Corporation, Newport Corporation, Zygo Corporation*List Not Exhaustive.
3. What are the main segments of the Optical Coatings Industry?
The market segments include Product Type, Technology, End-user Industry.
4. Can you provide details about the market size?
The market size is estimated to be USD 8.84 Million as of 2022.
5. What are some drivers contributing to market growth?
Growing Demand from the Solar Industry; Technological Advancements in the Optical Coatings Process.
6. What are the notable trends driving market growth?
The Electronics and Semiconductors Segment is Expected to Dominate the Market.
7. Are there any restraints impacting market growth?
High Costs and Some Limiting Properties of Optical Coatings.
8. Can you provide examples of recent developments in the market?
April 2022: Imatest announced a new partnership with Edmund Optics Inc. to enable its customers to buy Imatest software and charts via Edmund Optics' website seamlessly. Additionally, this partnership will allow Edmund Optics' imaging customers to easily acquire the tools needed to evaluate their imaging performance.
9. What pricing options are available for accessing the report?
Pricing options include single-user, multi-user, and enterprise licenses priced at USD 4750, USD 5250, and USD 8750 respectively.
10. Is the market size provided in terms of value or volume?
The market size is provided in terms of value, measured in Million.
11. Are there any specific market keywords associated with the report?
Yes, the market keyword associated with the report is "Optical Coatings Industry," which aids in identifying and referencing the specific market segment covered.
12. How do I determine which pricing option suits my needs best?
The pricing options vary based on user requirements and access needs. Individual users may opt for single-user licenses, while businesses requiring broader access may choose multi-user or enterprise licenses for cost-effective access to the report.
13. Are there any additional resources or data provided in the Optical Coatings Industry report?
While the report offers comprehensive insights, it's advisable to review the specific contents or supplementary materials provided to ascertain if additional resources or data are available.
14. How can I stay updated on further developments or reports in the Optical Coatings Industry?
To stay informed about further developments, trends, and reports in the Optical Coatings Industry, consider subscribing to industry newsletters, following relevant companies and organizations, or regularly checking reputable industry news sources and publications.
Methodology
Step 1 - Identification of Relevant Samples Size from Population Database


Step 2 - Approaches for Defining Global Market Size (Value, Volume* & Price*)

Note*: In applicable scenarios
Step 3 - Data Sources
Primary Research
- Web Analytics
- Survey Reports
- Research Institute
- Latest Research Reports
- Opinion Leaders
Secondary Research
- Annual Reports
- White Paper
- Latest Press Release
- Industry Association
- Paid Database
- Investor Presentations

Step 4 - Data Triangulation
Involves using different sources of information in order to increase the validity of a study
These sources are likely to be stakeholders in a program - participants, other researchers, program staff, other community members, and so on.
Then we put all data in single framework & apply various statistical tools to find out the dynamic on the market.
During the analysis stage, feedback from the stakeholder groups would be compared to determine areas of agreement as well as areas of divergence


