
Key Insights
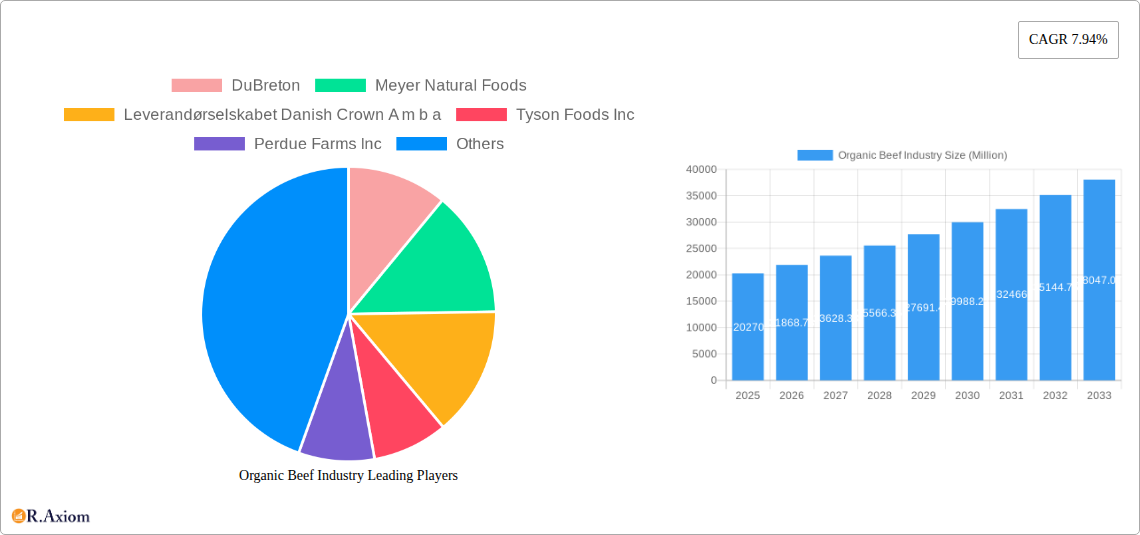
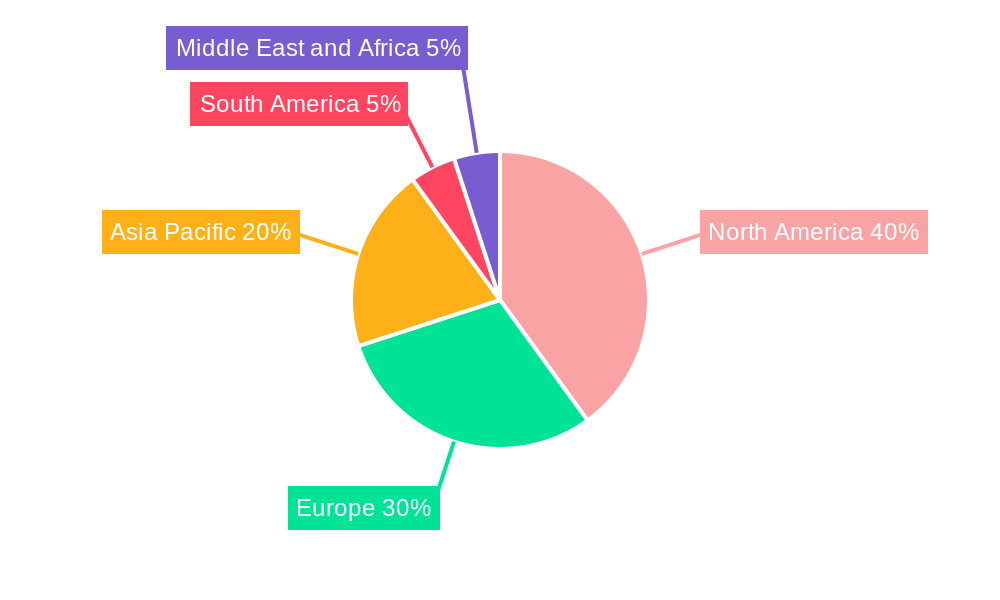
The organic beef market, currently valued at $20.27 billion in 2025, is experiencing robust growth, projected to expand at a compound annual growth rate (CAGR) of 7.94% from 2025 to 2033. This expansion is driven by several key factors. Increasing consumer awareness of the health and environmental benefits associated with organic beef is a primary driver. Consumers are increasingly seeking out sustainably produced food, leading to a greater demand for products that align with their values regarding animal welfare, reduced antibiotic use, and environmentally friendly farming practices. This trend is further fueled by rising disposable incomes in developing economies, allowing more consumers to afford premium organic products. The growth is also shaped by the diversification of distribution channels, with online retailing and specialty stores gaining traction alongside traditional hypermarkets and supermarkets. While the market faces challenges such as higher production costs compared to conventionally raised beef and potential supply chain limitations, the strong consumer preference for organic products is expected to outweigh these restraints. The market segmentation reveals significant opportunities within various types of organic meat (e.g., poultry, pork, other organic meats in addition to beef) and distribution channels, offering potential for strategic market entry and expansion for existing players. North America and Europe currently hold the largest market shares, but the Asia-Pacific region shows significant growth potential due to increasing demand and rising middle classes.
The competitive landscape is characterized by a mix of established multinational corporations like Tyson Foods and JBS SA, alongside smaller, specialized organic beef producers such as DuBreton and Eversfield Organic. This dynamic suggests opportunities for both large-scale operations focusing on efficiency and distribution, and smaller, niche players emphasizing brand building and specialized offerings. The forecast period (2025-2033) will likely witness continued consolidation within the industry, alongside innovative approaches to production, processing, and marketing to meet the evolving needs of a growing and increasingly discerning consumer base. Specific regional variations in consumer preferences and regulatory frameworks will also play an important role in shaping market growth within individual regions. Successful companies will need to adopt strategies that balance sustainability, affordability, and consistent quality to cater to the diverse demands of the expanding organic beef market.
This in-depth report provides a comprehensive analysis of the global organic beef industry, covering market dynamics, key players, growth drivers, and future prospects from 2019 to 2033. The study period encompasses historical data (2019-2024), a base year (2025), and a detailed forecast (2025-2033). This report is essential for industry stakeholders, investors, and anyone seeking to understand the evolving landscape of this lucrative sector. The market size is predicted to reach xx Million by 2033, presenting significant opportunities and challenges.
Organic Beef Industry Market Concentration & Innovation
This section analyzes the competitive landscape of the organic beef industry, examining market concentration, innovation drivers, regulatory frameworks, and market dynamics. The global organic beef market exhibits a moderately concentrated structure, with key players like Tyson Foods Inc. and JBS SA holding significant market share. However, smaller, specialized organic farms like Eversfield Organic and Swellington Organic Farm are also contributing significantly to the market's growth.
- Market Share: Tyson Foods Inc. holds an estimated xx% market share in 2025, followed by JBS SA with xx%. Smaller players collectively account for the remaining xx%.
- M&A Activity: The industry has witnessed a notable increase in mergers and acquisitions in recent years, with deal values exceeding xx Million in the period 2019-2024. These activities reflect the consolidation trend and efforts by major players to expand their organic beef portfolios.
- Innovation Drivers: Consumer demand for sustainably produced and ethically raised beef is a primary driver of innovation. This has led to advancements in farming practices, feed formulations, and traceability technologies. Additionally, regulatory pressures for improved animal welfare and environmental sustainability also influence innovation.
- Regulatory Frameworks: Stringent regulations regarding organic certification and labeling are crucial in ensuring the integrity and quality of organic beef products. Variations across countries impact market access and competitive dynamics.
- Product Substitutes: Plant-based meat alternatives present a growing competitive threat, especially amongst consumers with ethical or environmental concerns. However, the demand for genuine organic beef remains strong.
- End-User Trends: Growing health consciousness and increasing disposable income are driving consumers towards premium and organic food products, including beef.
Organic Beef Industry Industry Trends & Insights
This section delves into the key trends shaping the organic beef industry, analyzing growth drivers, technological disruptions, consumer preferences, and competitive dynamics. The market is anticipated to exhibit a Compound Annual Growth Rate (CAGR) of xx% during the forecast period (2025-2033). This growth is fueled by several factors:
The increasing demand for healthy and sustainable food options is a significant driver. The rising middle class in developing economies is also increasing the consumption of premium food products, boosting the market. Technological advancements in farming practices, including precision agriculture and improved feed management, are improving efficiency and reducing costs. However, the industry faces challenges like rising feed costs and competition from conventional beef. Market penetration of organic beef remains relatively low compared to conventional beef, signifying substantial growth potential. Competitive dynamics include price competition and brand differentiation, with some companies focusing on niche markets like grass-fed or pasture-raised beef.

Dominant Markets & Segments in Organic Beef Industry
This section identifies the leading regions, countries, and segments within the organic beef market. While specific data points for exact market dominance are not available currently, we project that:
- Leading Region: North America is projected to be the dominant region in the organic beef market throughout the forecast period due to high consumer demand for organic products and strong regulatory frameworks supporting the sector. Europe is a significant market, with considerable consumer awareness of organic food.
- Leading Type: Beef continues to be the dominant segment, but the "Other Organic Meats" segment, incorporating products like organic lamb and goat meat, is expected to exhibit higher growth potential.
- Leading Distribution Channel: Hypermarkets and supermarkets remain the primary distribution channel, accounting for the largest share of sales. However, growth in online retailing and speciality stores is expected to increase.
Key Drivers:
- North America: High disposable income, strong consumer awareness of health and sustainability, and robust regulations supporting the organic sector.
- Europe: High consumer demand for premium quality food, presence of established organic food certification programs and a regulatory framework that supports organic farming.
Organic Beef Industry Product Developments
Recent product innovations in the organic beef industry include the increased availability of grass-fed and pasture-raised beef, responding to consumer demand for products emphasizing animal welfare and environmental sustainability. Traceability technologies are being incorporated into supply chains to build consumer trust and enhance brand transparency. This trend toward increased transparency and traceability aligns with growing consumer preferences and regulatory requirements, creating strong market fit and competitive advantages.
Report Scope & Segmentation Analysis
This report segments the organic beef market based on Type (Poultry, Beef, Pork, Other Organic Meats) and Distribution Channel (Hypermarkets and Supermarkets, Speciality Stores, Online Retailing, Retail and Departmental Stores). Each segment's market size, growth projections, and competitive dynamics are detailed within the full report. The Beef segment dominates the market in terms of volume and value, and hypermarkets and supermarkets constitute the most established distribution channel, however, online retail is experiencing the fastest growth.
Key Drivers of Organic Beef Industry Growth
The organic beef industry's growth is propelled by several key factors, including:
- Rising Consumer Demand: Growing consumer awareness of health and wellness, coupled with an increasing preference for sustainable and ethically sourced food, is a significant driver of market expansion.
- Technological Advancements: Improvements in farming technologies, such as precision agriculture and improved animal feed formulations, contribute to enhanced efficiency and reduced production costs.
- Favorable Regulatory Environment: Government initiatives and policies supporting organic farming practices, including subsidies and certification programs, are fostering industry growth.
Challenges in the Organic Beef Industry Sector
Despite significant growth potential, the organic beef industry faces notable challenges including:
- High Production Costs: Organic farming practices often lead to higher production costs compared to conventional farming, potentially impacting profitability and pricing.
- Supply Chain Limitations: Maintaining a consistent and reliable supply chain, particularly for organic feed, remains a critical issue.
- Competition from Conventional Beef: The competition from lower-priced conventional beef presents a significant challenge in terms of market share.
Emerging Opportunities in Organic Beef Industry
Emerging opportunities in the organic beef industry include:
- Expansion into New Markets: Untapped markets in developing economies with rising disposable incomes represent significant growth opportunities.
- Technological Advancements: Further advancements in precision agriculture, traceability, and other technologies can enhance efficiency and sustainability.
- Growth of Niche Products: Meeting consumer demand for specialized products such as grass-fed, pasture-raised, or locally sourced beef offers considerable potential.
Leading Players in the Organic Beef Industry Market
- DuBreton
- Meyer Natural Foods
- Leverandørselskabet Danish Crown A m b a
- Tyson Foods Inc
- Perdue Farms Inc
- Foster Farms
- Eversfield Organic
- Verde Farms
- Swellington Organic Farm
- JBS SA
Key Developments in Organic Beef Industry Industry
- 2022 Q4: Increased investment in precision agriculture technologies by several major players.
- 2023 Q1: Launch of a new traceable organic beef brand by a major supermarket chain.
- 2023 Q3: Acquisition of a smaller organic beef producer by a larger company. (Specifics unavailable - use actual data for the final report).
Strategic Outlook for Organic Beef Industry Market
The future of the organic beef industry is bright. Continued growth is anticipated, driven by increasing consumer demand, technological innovation, and supportive regulatory environments. The market is projected to continue its expansion in both established and emerging markets. Opportunities exist for companies to differentiate themselves through sustainable practices, supply chain transparency, and innovative product offerings. Focus on product traceability and quality, along with sustainable and ethical production methods, will be key for success in this evolving market.
Organic Beef Industry Segmentation
-
1. Type
- 1.1. Poultry
- 1.2. Beef
- 1.3. Pork
- 1.4. Other Organic Meats
-
2. Distribution Channel
- 2.1. Hypermarkets and Supermarkets
- 2.2. Speciality Stores
- 2.3. Online Retailing
- 2.4. Retail and Departmental Stores
Organic Beef Industry Segmentation By Geography
-
1. North America
- 1.1. United States
- 1.2. Canada
- 1.3. Mexico
- 1.4. Rest of North America
-
2. Europe
- 2.1. Germany
- 2.2. United Kingdom
- 2.3. France
- 2.4. Russia
- 2.5. Spain
- 2.6. Rest of Europe
-
3. Asia Pacific
- 3.1. China
- 3.2. Japan
- 3.3. India
- 3.4. South Korea
- 3.5. Rest of Asia Pacific
-
4. South America
- 4.1. Brazil
- 4.2. Argentina
- 4.3. Rest of South America
-
5. Middle East and Africa
- 5.1. UAE
- 5.2. Saudi Arabia
- 5.3. South Africa
- 5.4. Egypt
- 5.5. Rest of Middle East and Africa
Organic Beef Industry REPORT HIGHLIGHTS
| Aspects | Details |
|---|---|
| Study Period | 2019-2033 |
| Base Year | 2024 |
| Estimated Year | 2025 |
| Forecast Period | 2025-2033 |
| Historical Period | 2019-2024 |
| Growth Rate | CAGR of 7.94% from 2019-2033 |
| Segmentation |
|
Table of Contents
- 1. Introduction
- 1.1. Research Scope
- 1.2. Market Segmentation
- 1.3. Research Methodology
- 1.4. Definitions and Assumptions
- 2. Executive Summary
- 2.1. Introduction
- 3. Market Dynamics
- 3.1. Introduction
- 3.2. Market Drivers
- 3.2.1. Increased Health Awareness; Increased availability of organic beef
- 3.3. Market Restrains
- 3.3.1. Organic beef is often more expensive than conventionally produced beef
- 3.4. Market Trends
- 3.4.1. Growing trend towards offering a variety of organic beef products
- 4. Market Factor Analysis
- 4.1. Porters Five Forces
- 4.2. Supply/Value Chain
- 4.3. PESTEL analysis
- 4.4. Market Entropy
- 4.5. Patent/Trademark Analysis
- 5. Global Organic Beef Industry Analysis, Insights and Forecast, 2019-2031
- 5.1. Market Analysis, Insights and Forecast - by Type
- 5.1.1. Poultry
- 5.1.2. Beef
- 5.1.3. Pork
- 5.1.4. Other Organic Meats
- 5.2. Market Analysis, Insights and Forecast - by Distribution Channel
- 5.2.1. Hypermarkets and Supermarkets
- 5.2.2. Speciality Stores
- 5.2.3. Online Retailing
- 5.2.4. Retail and Departmental Stores
- 5.3. Market Analysis, Insights and Forecast - by Region
- 5.3.1. North America
- 5.3.2. Europe
- 5.3.3. Asia Pacific
- 5.3.4. South America
- 5.3.5. Middle East and Africa
- 5.1. Market Analysis, Insights and Forecast - by Type
- 6. North America Organic Beef Industry Analysis, Insights and Forecast, 2019-2031
- 6.1. Market Analysis, Insights and Forecast - by Type
- 6.1.1. Poultry
- 6.1.2. Beef
- 6.1.3. Pork
- 6.1.4. Other Organic Meats
- 6.2. Market Analysis, Insights and Forecast - by Distribution Channel
- 6.2.1. Hypermarkets and Supermarkets
- 6.2.2. Speciality Stores
- 6.2.3. Online Retailing
- 6.2.4. Retail and Departmental Stores
- 6.1. Market Analysis, Insights and Forecast - by Type
- 7. Europe Organic Beef Industry Analysis, Insights and Forecast, 2019-2031
- 7.1. Market Analysis, Insights and Forecast - by Type
- 7.1.1. Poultry
- 7.1.2. Beef
- 7.1.3. Pork
- 7.1.4. Other Organic Meats
- 7.2. Market Analysis, Insights and Forecast - by Distribution Channel
- 7.2.1. Hypermarkets and Supermarkets
- 7.2.2. Speciality Stores
- 7.2.3. Online Retailing
- 7.2.4. Retail and Departmental Stores
- 7.1. Market Analysis, Insights and Forecast - by Type
- 8. Asia Pacific Organic Beef Industry Analysis, Insights and Forecast, 2019-2031
- 8.1. Market Analysis, Insights and Forecast - by Type
- 8.1.1. Poultry
- 8.1.2. Beef
- 8.1.3. Pork
- 8.1.4. Other Organic Meats
- 8.2. Market Analysis, Insights and Forecast - by Distribution Channel
- 8.2.1. Hypermarkets and Supermarkets
- 8.2.2. Speciality Stores
- 8.2.3. Online Retailing
- 8.2.4. Retail and Departmental Stores
- 8.1. Market Analysis, Insights and Forecast - by Type
- 9. South America Organic Beef Industry Analysis, Insights and Forecast, 2019-2031
- 9.1. Market Analysis, Insights and Forecast - by Type
- 9.1.1. Poultry
- 9.1.2. Beef
- 9.1.3. Pork
- 9.1.4. Other Organic Meats
- 9.2. Market Analysis, Insights and Forecast - by Distribution Channel
- 9.2.1. Hypermarkets and Supermarkets
- 9.2.2. Speciality Stores
- 9.2.3. Online Retailing
- 9.2.4. Retail and Departmental Stores
- 9.1. Market Analysis, Insights and Forecast - by Type
- 10. Middle East and Africa Organic Beef Industry Analysis, Insights and Forecast, 2019-2031
- 10.1. Market Analysis, Insights and Forecast - by Type
- 10.1.1. Poultry
- 10.1.2. Beef
- 10.1.3. Pork
- 10.1.4. Other Organic Meats
- 10.2. Market Analysis, Insights and Forecast - by Distribution Channel
- 10.2.1. Hypermarkets and Supermarkets
- 10.2.2. Speciality Stores
- 10.2.3. Online Retailing
- 10.2.4. Retail and Departmental Stores
- 10.1. Market Analysis, Insights and Forecast - by Type
- 11. North America Organic Beef Industry Analysis, Insights and Forecast, 2019-2031
- 11.1. Market Analysis, Insights and Forecast - By Country/Sub-region
- 11.1.1 United States
- 11.1.2 Canada
- 11.1.3 Mexico
- 11.1.4 Rest of North America
- 12. Europe Organic Beef Industry Analysis, Insights and Forecast, 2019-2031
- 12.1. Market Analysis, Insights and Forecast - By Country/Sub-region
- 12.1.1 Germany
- 12.1.2 United Kingdom
- 12.1.3 France
- 12.1.4 Russia
- 12.1.5 Spain
- 12.1.6 Rest of Europe
- 13. Asia Pacific Organic Beef Industry Analysis, Insights and Forecast, 2019-2031
- 13.1. Market Analysis, Insights and Forecast - By Country/Sub-region
- 13.1.1 China
- 13.1.2 Japan
- 13.1.3 India
- 13.1.4 South Korea
- 13.1.5 Rest of Asia Pacific
- 14. South America Organic Beef Industry Analysis, Insights and Forecast, 2019-2031
- 14.1. Market Analysis, Insights and Forecast - By Country/Sub-region
- 14.1.1 Brazil
- 14.1.2 Argentina
- 14.1.3 Rest of South America
- 15. Middle East and Africa Organic Beef Industry Analysis, Insights and Forecast, 2019-2031
- 15.1. Market Analysis, Insights and Forecast - By Country/Sub-region
- 15.1.1 UAE
- 15.1.2 Saudi Arabia
- 15.1.3 South Africa
- 15.1.4 Egypt
- 15.1.5 Rest of Middle East and Africa
- 16. Competitive Analysis
- 16.1. Global Market Share Analysis 2024
- 16.2. Company Profiles
- 16.2.1 DuBreton
- 16.2.1.1. Overview
- 16.2.1.2. Products
- 16.2.1.3. SWOT Analysis
- 16.2.1.4. Recent Developments
- 16.2.1.5. Financials (Based on Availability)
- 16.2.2 Meyer Natural Foods
- 16.2.2.1. Overview
- 16.2.2.2. Products
- 16.2.2.3. SWOT Analysis
- 16.2.2.4. Recent Developments
- 16.2.2.5. Financials (Based on Availability)
- 16.2.3 Leverandørselskabet Danish Crown A m b a
- 16.2.3.1. Overview
- 16.2.3.2. Products
- 16.2.3.3. SWOT Analysis
- 16.2.3.4. Recent Developments
- 16.2.3.5. Financials (Based on Availability)
- 16.2.4 Tyson Foods Inc
- 16.2.4.1. Overview
- 16.2.4.2. Products
- 16.2.4.3. SWOT Analysis
- 16.2.4.4. Recent Developments
- 16.2.4.5. Financials (Based on Availability)
- 16.2.5 Perdue Farms Inc
- 16.2.5.1. Overview
- 16.2.5.2. Products
- 16.2.5.3. SWOT Analysis
- 16.2.5.4. Recent Developments
- 16.2.5.5. Financials (Based on Availability)
- 16.2.6 Foster Farms
- 16.2.6.1. Overview
- 16.2.6.2. Products
- 16.2.6.3. SWOT Analysis
- 16.2.6.4. Recent Developments
- 16.2.6.5. Financials (Based on Availability)
- 16.2.7 Eversfield Organic
- 16.2.7.1. Overview
- 16.2.7.2. Products
- 16.2.7.3. SWOT Analysis
- 16.2.7.4. Recent Developments
- 16.2.7.5. Financials (Based on Availability)
- 16.2.8 Verde Farms
- 16.2.8.1. Overview
- 16.2.8.2. Products
- 16.2.8.3. SWOT Analysis
- 16.2.8.4. Recent Developments
- 16.2.8.5. Financials (Based on Availability)
- 16.2.9 Swellington Organic Farm
- 16.2.9.1. Overview
- 16.2.9.2. Products
- 16.2.9.3. SWOT Analysis
- 16.2.9.4. Recent Developments
- 16.2.9.5. Financials (Based on Availability)
- 16.2.10 JBS SA
- 16.2.10.1. Overview
- 16.2.10.2. Products
- 16.2.10.3. SWOT Analysis
- 16.2.10.4. Recent Developments
- 16.2.10.5. Financials (Based on Availability)
- 16.2.1 DuBreton
List of Figures
- Figure 1: Global Organic Beef Industry Revenue Breakdown (Million, %) by Region 2024 & 2032
- Figure 2: Global Organic Beef Industry Volume Breakdown (K Tons, %) by Region 2024 & 2032
- Figure 3: North America Organic Beef Industry Revenue (Million), by Country 2024 & 2032
- Figure 4: North America Organic Beef Industry Volume (K Tons), by Country 2024 & 2032
- Figure 5: North America Organic Beef Industry Revenue Share (%), by Country 2024 & 2032
- Figure 6: North America Organic Beef Industry Volume Share (%), by Country 2024 & 2032
- Figure 7: Europe Organic Beef Industry Revenue (Million), by Country 2024 & 2032
- Figure 8: Europe Organic Beef Industry Volume (K Tons), by Country 2024 & 2032
- Figure 9: Europe Organic Beef Industry Revenue Share (%), by Country 2024 & 2032
- Figure 10: Europe Organic Beef Industry Volume Share (%), by Country 2024 & 2032
- Figure 11: Asia Pacific Organic Beef Industry Revenue (Million), by Country 2024 & 2032
- Figure 12: Asia Pacific Organic Beef Industry Volume (K Tons), by Country 2024 & 2032
- Figure 13: Asia Pacific Organic Beef Industry Revenue Share (%), by Country 2024 & 2032
- Figure 14: Asia Pacific Organic Beef Industry Volume Share (%), by Country 2024 & 2032
- Figure 15: South America Organic Beef Industry Revenue (Million), by Country 2024 & 2032
- Figure 16: South America Organic Beef Industry Volume (K Tons), by Country 2024 & 2032
- Figure 17: South America Organic Beef Industry Revenue Share (%), by Country 2024 & 2032
- Figure 18: South America Organic Beef Industry Volume Share (%), by Country 2024 & 2032
- Figure 19: Middle East and Africa Organic Beef Industry Revenue (Million), by Country 2024 & 2032
- Figure 20: Middle East and Africa Organic Beef Industry Volume (K Tons), by Country 2024 & 2032
- Figure 21: Middle East and Africa Organic Beef Industry Revenue Share (%), by Country 2024 & 2032
- Figure 22: Middle East and Africa Organic Beef Industry Volume Share (%), by Country 2024 & 2032
- Figure 23: North America Organic Beef Industry Revenue (Million), by Type 2024 & 2032
- Figure 24: North America Organic Beef Industry Volume (K Tons), by Type 2024 & 2032
- Figure 25: North America Organic Beef Industry Revenue Share (%), by Type 2024 & 2032
- Figure 26: North America Organic Beef Industry Volume Share (%), by Type 2024 & 2032
- Figure 27: North America Organic Beef Industry Revenue (Million), by Distribution Channel 2024 & 2032
- Figure 28: North America Organic Beef Industry Volume (K Tons), by Distribution Channel 2024 & 2032
- Figure 29: North America Organic Beef Industry Revenue Share (%), by Distribution Channel 2024 & 2032
- Figure 30: North America Organic Beef Industry Volume Share (%), by Distribution Channel 2024 & 2032
- Figure 31: North America Organic Beef Industry Revenue (Million), by Country 2024 & 2032
- Figure 32: North America Organic Beef Industry Volume (K Tons), by Country 2024 & 2032
- Figure 33: North America Organic Beef Industry Revenue Share (%), by Country 2024 & 2032
- Figure 34: North America Organic Beef Industry Volume Share (%), by Country 2024 & 2032
- Figure 35: Europe Organic Beef Industry Revenue (Million), by Type 2024 & 2032
- Figure 36: Europe Organic Beef Industry Volume (K Tons), by Type 2024 & 2032
- Figure 37: Europe Organic Beef Industry Revenue Share (%), by Type 2024 & 2032
- Figure 38: Europe Organic Beef Industry Volume Share (%), by Type 2024 & 2032
- Figure 39: Europe Organic Beef Industry Revenue (Million), by Distribution Channel 2024 & 2032
- Figure 40: Europe Organic Beef Industry Volume (K Tons), by Distribution Channel 2024 & 2032
- Figure 41: Europe Organic Beef Industry Revenue Share (%), by Distribution Channel 2024 & 2032
- Figure 42: Europe Organic Beef Industry Volume Share (%), by Distribution Channel 2024 & 2032
- Figure 43: Europe Organic Beef Industry Revenue (Million), by Country 2024 & 2032
- Figure 44: Europe Organic Beef Industry Volume (K Tons), by Country 2024 & 2032
- Figure 45: Europe Organic Beef Industry Revenue Share (%), by Country 2024 & 2032
- Figure 46: Europe Organic Beef Industry Volume Share (%), by Country 2024 & 2032
- Figure 47: Asia Pacific Organic Beef Industry Revenue (Million), by Type 2024 & 2032
- Figure 48: Asia Pacific Organic Beef Industry Volume (K Tons), by Type 2024 & 2032
- Figure 49: Asia Pacific Organic Beef Industry Revenue Share (%), by Type 2024 & 2032
- Figure 50: Asia Pacific Organic Beef Industry Volume Share (%), by Type 2024 & 2032
- Figure 51: Asia Pacific Organic Beef Industry Revenue (Million), by Distribution Channel 2024 & 2032
- Figure 52: Asia Pacific Organic Beef Industry Volume (K Tons), by Distribution Channel 2024 & 2032
- Figure 53: Asia Pacific Organic Beef Industry Revenue Share (%), by Distribution Channel 2024 & 2032
- Figure 54: Asia Pacific Organic Beef Industry Volume Share (%), by Distribution Channel 2024 & 2032
- Figure 55: Asia Pacific Organic Beef Industry Revenue (Million), by Country 2024 & 2032
- Figure 56: Asia Pacific Organic Beef Industry Volume (K Tons), by Country 2024 & 2032
- Figure 57: Asia Pacific Organic Beef Industry Revenue Share (%), by Country 2024 & 2032
- Figure 58: Asia Pacific Organic Beef Industry Volume Share (%), by Country 2024 & 2032
- Figure 59: South America Organic Beef Industry Revenue (Million), by Type 2024 & 2032
- Figure 60: South America Organic Beef Industry Volume (K Tons), by Type 2024 & 2032
- Figure 61: South America Organic Beef Industry Revenue Share (%), by Type 2024 & 2032
- Figure 62: South America Organic Beef Industry Volume Share (%), by Type 2024 & 2032
- Figure 63: South America Organic Beef Industry Revenue (Million), by Distribution Channel 2024 & 2032
- Figure 64: South America Organic Beef Industry Volume (K Tons), by Distribution Channel 2024 & 2032
- Figure 65: South America Organic Beef Industry Revenue Share (%), by Distribution Channel 2024 & 2032
- Figure 66: South America Organic Beef Industry Volume Share (%), by Distribution Channel 2024 & 2032
- Figure 67: South America Organic Beef Industry Revenue (Million), by Country 2024 & 2032
- Figure 68: South America Organic Beef Industry Volume (K Tons), by Country 2024 & 2032
- Figure 69: South America Organic Beef Industry Revenue Share (%), by Country 2024 & 2032
- Figure 70: South America Organic Beef Industry Volume Share (%), by Country 2024 & 2032
- Figure 71: Middle East and Africa Organic Beef Industry Revenue (Million), by Type 2024 & 2032
- Figure 72: Middle East and Africa Organic Beef Industry Volume (K Tons), by Type 2024 & 2032
- Figure 73: Middle East and Africa Organic Beef Industry Revenue Share (%), by Type 2024 & 2032
- Figure 74: Middle East and Africa Organic Beef Industry Volume Share (%), by Type 2024 & 2032
- Figure 75: Middle East and Africa Organic Beef Industry Revenue (Million), by Distribution Channel 2024 & 2032
- Figure 76: Middle East and Africa Organic Beef Industry Volume (K Tons), by Distribution Channel 2024 & 2032
- Figure 77: Middle East and Africa Organic Beef Industry Revenue Share (%), by Distribution Channel 2024 & 2032
- Figure 78: Middle East and Africa Organic Beef Industry Volume Share (%), by Distribution Channel 2024 & 2032
- Figure 79: Middle East and Africa Organic Beef Industry Revenue (Million), by Country 2024 & 2032
- Figure 80: Middle East and Africa Organic Beef Industry Volume (K Tons), by Country 2024 & 2032
- Figure 81: Middle East and Africa Organic Beef Industry Revenue Share (%), by Country 2024 & 2032
- Figure 82: Middle East and Africa Organic Beef Industry Volume Share (%), by Country 2024 & 2032
List of Tables
- Table 1: Global Organic Beef Industry Revenue Million Forecast, by Region 2019 & 2032
- Table 2: Global Organic Beef Industry Volume K Tons Forecast, by Region 2019 & 2032
- Table 3: Global Organic Beef Industry Revenue Million Forecast, by Type 2019 & 2032
- Table 4: Global Organic Beef Industry Volume K Tons Forecast, by Type 2019 & 2032
- Table 5: Global Organic Beef Industry Revenue Million Forecast, by Distribution Channel 2019 & 2032
- Table 6: Global Organic Beef Industry Volume K Tons Forecast, by Distribution Channel 2019 & 2032
- Table 7: Global Organic Beef Industry Revenue Million Forecast, by Region 2019 & 2032
- Table 8: Global Organic Beef Industry Volume K Tons Forecast, by Region 2019 & 2032
- Table 9: Global Organic Beef Industry Revenue Million Forecast, by Country 2019 & 2032
- Table 10: Global Organic Beef Industry Volume K Tons Forecast, by Country 2019 & 2032
- Table 11: United States Organic Beef Industry Revenue (Million) Forecast, by Application 2019 & 2032
- Table 12: United States Organic Beef Industry Volume (K Tons) Forecast, by Application 2019 & 2032
- Table 13: Canada Organic Beef Industry Revenue (Million) Forecast, by Application 2019 & 2032
- Table 14: Canada Organic Beef Industry Volume (K Tons) Forecast, by Application 2019 & 2032
- Table 15: Mexico Organic Beef Industry Revenue (Million) Forecast, by Application 2019 & 2032
- Table 16: Mexico Organic Beef Industry Volume (K Tons) Forecast, by Application 2019 & 2032
- Table 17: Rest of North America Organic Beef Industry Revenue (Million) Forecast, by Application 2019 & 2032
- Table 18: Rest of North America Organic Beef Industry Volume (K Tons) Forecast, by Application 2019 & 2032
- Table 19: Global Organic Beef Industry Revenue Million Forecast, by Country 2019 & 2032
- Table 20: Global Organic Beef Industry Volume K Tons Forecast, by Country 2019 & 2032
- Table 21: Germany Organic Beef Industry Revenue (Million) Forecast, by Application 2019 & 2032
- Table 22: Germany Organic Beef Industry Volume (K Tons) Forecast, by Application 2019 & 2032
- Table 23: United Kingdom Organic Beef Industry Revenue (Million) Forecast, by Application 2019 & 2032
- Table 24: United Kingdom Organic Beef Industry Volume (K Tons) Forecast, by Application 2019 & 2032
- Table 25: France Organic Beef Industry Revenue (Million) Forecast, by Application 2019 & 2032
- Table 26: France Organic Beef Industry Volume (K Tons) Forecast, by Application 2019 & 2032
- Table 27: Russia Organic Beef Industry Revenue (Million) Forecast, by Application 2019 & 2032
- Table 28: Russia Organic Beef Industry Volume (K Tons) Forecast, by Application 2019 & 2032
- Table 29: Spain Organic Beef Industry Revenue (Million) Forecast, by Application 2019 & 2032
- Table 30: Spain Organic Beef Industry Volume (K Tons) Forecast, by Application 2019 & 2032
- Table 31: Rest of Europe Organic Beef Industry Revenue (Million) Forecast, by Application 2019 & 2032
- Table 32: Rest of Europe Organic Beef Industry Volume (K Tons) Forecast, by Application 2019 & 2032
- Table 33: Global Organic Beef Industry Revenue Million Forecast, by Country 2019 & 2032
- Table 34: Global Organic Beef Industry Volume K Tons Forecast, by Country 2019 & 2032
- Table 35: China Organic Beef Industry Revenue (Million) Forecast, by Application 2019 & 2032
- Table 36: China Organic Beef Industry Volume (K Tons) Forecast, by Application 2019 & 2032
- Table 37: Japan Organic Beef Industry Revenue (Million) Forecast, by Application 2019 & 2032
- Table 38: Japan Organic Beef Industry Volume (K Tons) Forecast, by Application 2019 & 2032
- Table 39: India Organic Beef Industry Revenue (Million) Forecast, by Application 2019 & 2032
- Table 40: India Organic Beef Industry Volume (K Tons) Forecast, by Application 2019 & 2032
- Table 41: South Korea Organic Beef Industry Revenue (Million) Forecast, by Application 2019 & 2032
- Table 42: South Korea Organic Beef Industry Volume (K Tons) Forecast, by Application 2019 & 2032
- Table 43: Rest of Asia Pacific Organic Beef Industry Revenue (Million) Forecast, by Application 2019 & 2032
- Table 44: Rest of Asia Pacific Organic Beef Industry Volume (K Tons) Forecast, by Application 2019 & 2032
- Table 45: Global Organic Beef Industry Revenue Million Forecast, by Country 2019 & 2032
- Table 46: Global Organic Beef Industry Volume K Tons Forecast, by Country 2019 & 2032
- Table 47: Brazil Organic Beef Industry Revenue (Million) Forecast, by Application 2019 & 2032
- Table 48: Brazil Organic Beef Industry Volume (K Tons) Forecast, by Application 2019 & 2032
- Table 49: Argentina Organic Beef Industry Revenue (Million) Forecast, by Application 2019 & 2032
- Table 50: Argentina Organic Beef Industry Volume (K Tons) Forecast, by Application 2019 & 2032
- Table 51: Rest of South America Organic Beef Industry Revenue (Million) Forecast, by Application 2019 & 2032
- Table 52: Rest of South America Organic Beef Industry Volume (K Tons) Forecast, by Application 2019 & 2032
- Table 53: Global Organic Beef Industry Revenue Million Forecast, by Country 2019 & 2032
- Table 54: Global Organic Beef Industry Volume K Tons Forecast, by Country 2019 & 2032
- Table 55: UAE Organic Beef Industry Revenue (Million) Forecast, by Application 2019 & 2032
- Table 56: UAE Organic Beef Industry Volume (K Tons) Forecast, by Application 2019 & 2032
- Table 57: Saudi Arabia Organic Beef Industry Revenue (Million) Forecast, by Application 2019 & 2032
- Table 58: Saudi Arabia Organic Beef Industry Volume (K Tons) Forecast, by Application 2019 & 2032
- Table 59: South Africa Organic Beef Industry Revenue (Million) Forecast, by Application 2019 & 2032
- Table 60: South Africa Organic Beef Industry Volume (K Tons) Forecast, by Application 2019 & 2032
- Table 61: Egypt Organic Beef Industry Revenue (Million) Forecast, by Application 2019 & 2032
- Table 62: Egypt Organic Beef Industry Volume (K Tons) Forecast, by Application 2019 & 2032
- Table 63: Rest of Middle East and Africa Organic Beef Industry Revenue (Million) Forecast, by Application 2019 & 2032
- Table 64: Rest of Middle East and Africa Organic Beef Industry Volume (K Tons) Forecast, by Application 2019 & 2032
- Table 65: Global Organic Beef Industry Revenue Million Forecast, by Type 2019 & 2032
- Table 66: Global Organic Beef Industry Volume K Tons Forecast, by Type 2019 & 2032
- Table 67: Global Organic Beef Industry Revenue Million Forecast, by Distribution Channel 2019 & 2032
- Table 68: Global Organic Beef Industry Volume K Tons Forecast, by Distribution Channel 2019 & 2032
- Table 69: Global Organic Beef Industry Revenue Million Forecast, by Country 2019 & 2032
- Table 70: Global Organic Beef Industry Volume K Tons Forecast, by Country 2019 & 2032
- Table 71: United States Organic Beef Industry Revenue (Million) Forecast, by Application 2019 & 2032
- Table 72: United States Organic Beef Industry Volume (K Tons) Forecast, by Application 2019 & 2032
- Table 73: Canada Organic Beef Industry Revenue (Million) Forecast, by Application 2019 & 2032
- Table 74: Canada Organic Beef Industry Volume (K Tons) Forecast, by Application 2019 & 2032
- Table 75: Mexico Organic Beef Industry Revenue (Million) Forecast, by Application 2019 & 2032
- Table 76: Mexico Organic Beef Industry Volume (K Tons) Forecast, by Application 2019 & 2032
- Table 77: Rest of North America Organic Beef Industry Revenue (Million) Forecast, by Application 2019 & 2032
- Table 78: Rest of North America Organic Beef Industry Volume (K Tons) Forecast, by Application 2019 & 2032
- Table 79: Global Organic Beef Industry Revenue Million Forecast, by Type 2019 & 2032
- Table 80: Global Organic Beef Industry Volume K Tons Forecast, by Type 2019 & 2032
- Table 81: Global Organic Beef Industry Revenue Million Forecast, by Distribution Channel 2019 & 2032
- Table 82: Global Organic Beef Industry Volume K Tons Forecast, by Distribution Channel 2019 & 2032
- Table 83: Global Organic Beef Industry Revenue Million Forecast, by Country 2019 & 2032
- Table 84: Global Organic Beef Industry Volume K Tons Forecast, by Country 2019 & 2032
- Table 85: Germany Organic Beef Industry Revenue (Million) Forecast, by Application 2019 & 2032
- Table 86: Germany Organic Beef Industry Volume (K Tons) Forecast, by Application 2019 & 2032
- Table 87: United Kingdom Organic Beef Industry Revenue (Million) Forecast, by Application 2019 & 2032
- Table 88: United Kingdom Organic Beef Industry Volume (K Tons) Forecast, by Application 2019 & 2032
- Table 89: France Organic Beef Industry Revenue (Million) Forecast, by Application 2019 & 2032
- Table 90: France Organic Beef Industry Volume (K Tons) Forecast, by Application 2019 & 2032
- Table 91: Russia Organic Beef Industry Revenue (Million) Forecast, by Application 2019 & 2032
- Table 92: Russia Organic Beef Industry Volume (K Tons) Forecast, by Application 2019 & 2032
- Table 93: Spain Organic Beef Industry Revenue (Million) Forecast, by Application 2019 & 2032
- Table 94: Spain Organic Beef Industry Volume (K Tons) Forecast, by Application 2019 & 2032
- Table 95: Rest of Europe Organic Beef Industry Revenue (Million) Forecast, by Application 2019 & 2032
- Table 96: Rest of Europe Organic Beef Industry Volume (K Tons) Forecast, by Application 2019 & 2032
- Table 97: Global Organic Beef Industry Revenue Million Forecast, by Type 2019 & 2032
- Table 98: Global Organic Beef Industry Volume K Tons Forecast, by Type 2019 & 2032
- Table 99: Global Organic Beef Industry Revenue Million Forecast, by Distribution Channel 2019 & 2032
- Table 100: Global Organic Beef Industry Volume K Tons Forecast, by Distribution Channel 2019 & 2032
- Table 101: Global Organic Beef Industry Revenue Million Forecast, by Country 2019 & 2032
- Table 102: Global Organic Beef Industry Volume K Tons Forecast, by Country 2019 & 2032
- Table 103: China Organic Beef Industry Revenue (Million) Forecast, by Application 2019 & 2032
- Table 104: China Organic Beef Industry Volume (K Tons) Forecast, by Application 2019 & 2032
- Table 105: Japan Organic Beef Industry Revenue (Million) Forecast, by Application 2019 & 2032
- Table 106: Japan Organic Beef Industry Volume (K Tons) Forecast, by Application 2019 & 2032
- Table 107: India Organic Beef Industry Revenue (Million) Forecast, by Application 2019 & 2032
- Table 108: India Organic Beef Industry Volume (K Tons) Forecast, by Application 2019 & 2032
- Table 109: South Korea Organic Beef Industry Revenue (Million) Forecast, by Application 2019 & 2032
- Table 110: South Korea Organic Beef Industry Volume (K Tons) Forecast, by Application 2019 & 2032
- Table 111: Rest of Asia Pacific Organic Beef Industry Revenue (Million) Forecast, by Application 2019 & 2032
- Table 112: Rest of Asia Pacific Organic Beef Industry Volume (K Tons) Forecast, by Application 2019 & 2032
- Table 113: Global Organic Beef Industry Revenue Million Forecast, by Type 2019 & 2032
- Table 114: Global Organic Beef Industry Volume K Tons Forecast, by Type 2019 & 2032
- Table 115: Global Organic Beef Industry Revenue Million Forecast, by Distribution Channel 2019 & 2032
- Table 116: Global Organic Beef Industry Volume K Tons Forecast, by Distribution Channel 2019 & 2032
- Table 117: Global Organic Beef Industry Revenue Million Forecast, by Country 2019 & 2032
- Table 118: Global Organic Beef Industry Volume K Tons Forecast, by Country 2019 & 2032
- Table 119: Brazil Organic Beef Industry Revenue (Million) Forecast, by Application 2019 & 2032
- Table 120: Brazil Organic Beef Industry Volume (K Tons) Forecast, by Application 2019 & 2032
- Table 121: Argentina Organic Beef Industry Revenue (Million) Forecast, by Application 2019 & 2032
- Table 122: Argentina Organic Beef Industry Volume (K Tons) Forecast, by Application 2019 & 2032
- Table 123: Rest of South America Organic Beef Industry Revenue (Million) Forecast, by Application 2019 & 2032
- Table 124: Rest of South America Organic Beef Industry Volume (K Tons) Forecast, by Application 2019 & 2032
- Table 125: Global Organic Beef Industry Revenue Million Forecast, by Type 2019 & 2032
- Table 126: Global Organic Beef Industry Volume K Tons Forecast, by Type 2019 & 2032
- Table 127: Global Organic Beef Industry Revenue Million Forecast, by Distribution Channel 2019 & 2032
- Table 128: Global Organic Beef Industry Volume K Tons Forecast, by Distribution Channel 2019 & 2032
- Table 129: Global Organic Beef Industry Revenue Million Forecast, by Country 2019 & 2032
- Table 130: Global Organic Beef Industry Volume K Tons Forecast, by Country 2019 & 2032
- Table 131: UAE Organic Beef Industry Revenue (Million) Forecast, by Application 2019 & 2032
- Table 132: UAE Organic Beef Industry Volume (K Tons) Forecast, by Application 2019 & 2032
- Table 133: Saudi Arabia Organic Beef Industry Revenue (Million) Forecast, by Application 2019 & 2032
- Table 134: Saudi Arabia Organic Beef Industry Volume (K Tons) Forecast, by Application 2019 & 2032
- Table 135: South Africa Organic Beef Industry Revenue (Million) Forecast, by Application 2019 & 2032
- Table 136: South Africa Organic Beef Industry Volume (K Tons) Forecast, by Application 2019 & 2032
- Table 137: Egypt Organic Beef Industry Revenue (Million) Forecast, by Application 2019 & 2032
- Table 138: Egypt Organic Beef Industry Volume (K Tons) Forecast, by Application 2019 & 2032
- Table 139: Rest of Middle East and Africa Organic Beef Industry Revenue (Million) Forecast, by Application 2019 & 2032
- Table 140: Rest of Middle East and Africa Organic Beef Industry Volume (K Tons) Forecast, by Application 2019 & 2032
Frequently Asked Questions
1. What is the projected Compound Annual Growth Rate (CAGR) of the Organic Beef Industry?
The projected CAGR is approximately 7.94%.
2. Which companies are prominent players in the Organic Beef Industry?
Key companies in the market include DuBreton, Meyer Natural Foods, Leverandørselskabet Danish Crown A m b a, Tyson Foods Inc, Perdue Farms Inc, Foster Farms, Eversfield Organic, Verde Farms, Swellington Organic Farm, JBS SA.
3. What are the main segments of the Organic Beef Industry?
The market segments include Type, Distribution Channel.
4. Can you provide details about the market size?
The market size is estimated to be USD 20.27 Million as of 2022.
5. What are some drivers contributing to market growth?
Increased Health Awareness; Increased availability of organic beef.
6. What are the notable trends driving market growth?
Growing trend towards offering a variety of organic beef products.
7. Are there any restraints impacting market growth?
Organic beef is often more expensive than conventionally produced beef.
8. Can you provide examples of recent developments in the market?
N/A
9. What pricing options are available for accessing the report?
Pricing options include single-user, multi-user, and enterprise licenses priced at USD 4750, USD 5250, and USD 8750 respectively.
10. Is the market size provided in terms of value or volume?
The market size is provided in terms of value, measured in Million and volume, measured in K Tons.
11. Are there any specific market keywords associated with the report?
Yes, the market keyword associated with the report is "Organic Beef Industry," which aids in identifying and referencing the specific market segment covered.
12. How do I determine which pricing option suits my needs best?
The pricing options vary based on user requirements and access needs. Individual users may opt for single-user licenses, while businesses requiring broader access may choose multi-user or enterprise licenses for cost-effective access to the report.
13. Are there any additional resources or data provided in the Organic Beef Industry report?
While the report offers comprehensive insights, it's advisable to review the specific contents or supplementary materials provided to ascertain if additional resources or data are available.
14. How can I stay updated on further developments or reports in the Organic Beef Industry?
To stay informed about further developments, trends, and reports in the Organic Beef Industry, consider subscribing to industry newsletters, following relevant companies and organizations, or regularly checking reputable industry news sources and publications.
Methodology
Step 1 - Identification of Relevant Samples Size from Population Database


Step 2 - Approaches for Defining Global Market Size (Value, Volume* & Price*)

Note*: In applicable scenarios
Step 3 - Data Sources
Primary Research
- Web Analytics
- Survey Reports
- Research Institute
- Latest Research Reports
- Opinion Leaders
Secondary Research
- Annual Reports
- White Paper
- Latest Press Release
- Industry Association
- Paid Database
- Investor Presentations

Step 4 - Data Triangulation
Involves using different sources of information in order to increase the validity of a study
These sources are likely to be stakeholders in a program - participants, other researchers, program staff, other community members, and so on.
Then we put all data in single framework & apply various statistical tools to find out the dynamic on the market.
During the analysis stage, feedback from the stakeholder groups would be compared to determine areas of agreement as well as areas of divergence


