
Key Insights
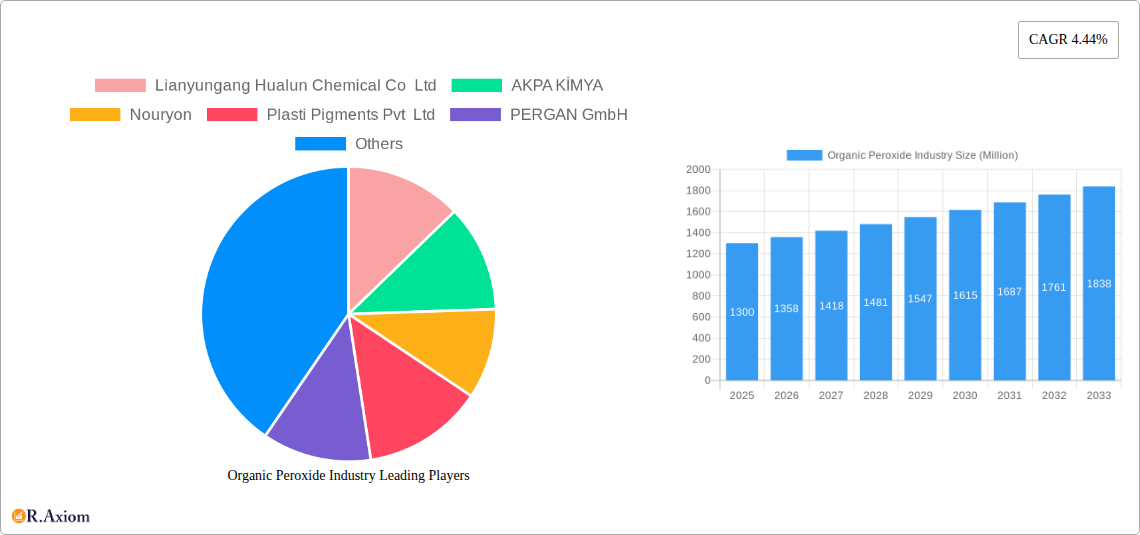
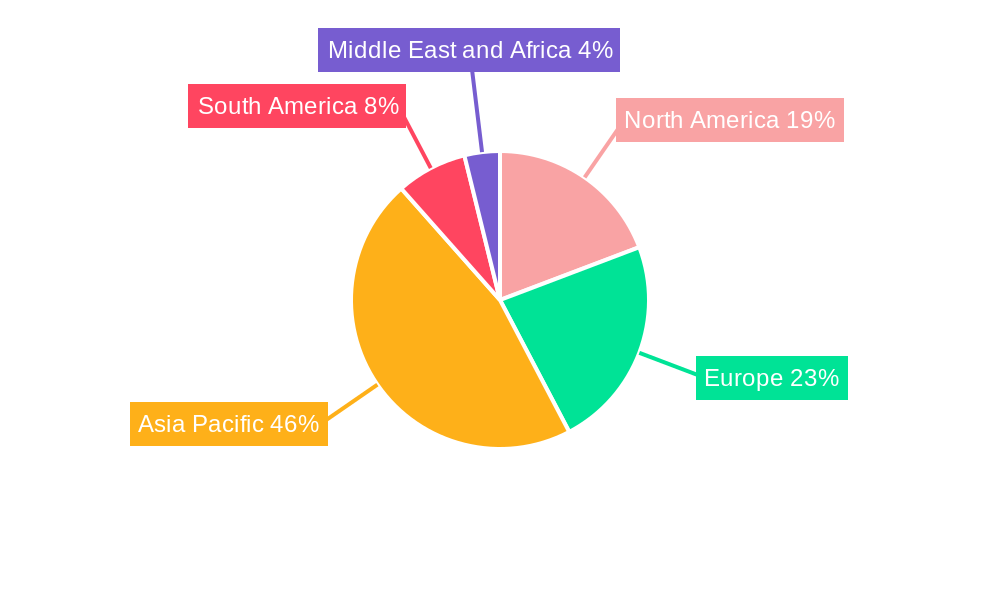
The global organic peroxide market, valued at $1.3 billion in 2025, is projected to experience robust growth, driven by a compound annual growth rate (CAGR) of 4.44% from 2025 to 2033. This expansion is fueled by several key factors. The increasing demand for polymers and rubber in diverse industries like automotive, construction, and packaging is a significant driver. The burgeoning coatings and adhesives market, particularly in the construction and infrastructure sectors, also contributes substantially to organic peroxide consumption. Furthermore, growth in the healthcare and cosmetics industries, where organic peroxides are used as curing agents and bleaching agents respectively, is bolstering market expansion. Technological advancements leading to the development of more efficient and specialized organic peroxide types further enhance market prospects. However, stringent environmental regulations concerning the handling and disposal of these chemicals pose a significant restraint, along with concerns regarding their potential health hazards, demanding safe handling practices and increasing production costs. The market is segmented by application (polymers & rubber, coatings & adhesives, paper & textile, cosmetics, healthcare, others) and type (diacyl peroxides, ketone peroxides, percarbonates, benzoyl peroxide, dialkyl peroxides, hydro-peroxides, peroxyesters, others), offering diverse opportunities for market players. Regional variations exist, with Asia Pacific, especially China and India, projected to dominate owing to rapid industrialization and economic growth. North America and Europe are also substantial markets with established manufacturing bases and relatively mature industries.
The competitive landscape is marked by a mix of large multinational corporations and specialized chemical manufacturers. Key players are strategically investing in research and development to improve product efficacy, safety, and sustainability, driving innovation within the sector. The market is likely to see increased mergers and acquisitions as companies seek to consolidate their market share and expand their product portfolios. The focus on sustainable and environmentally friendly organic peroxide alternatives is expected to gain momentum, shaping future market dynamics. This growth trajectory necessitates a proactive approach to regulatory compliance and a strong emphasis on safety protocols across the supply chain. Future market trends will be shaped by advancements in material science, increasing demand for high-performance materials, and the growing focus on sustainable manufacturing practices within the target industries.
Organic Peroxide Industry: A Comprehensive Market Report (2019-2033)
This detailed report provides a comprehensive analysis of the global organic peroxide industry, covering market size, segmentation, key players, growth drivers, challenges, and future opportunities. The study period spans from 2019 to 2033, with 2025 serving as the base and estimated year. The report utilizes a robust methodology to forecast market trends from 2025 to 2033, building upon historical data from 2019 to 2024. The report is designed for industry stakeholders, including manufacturers, distributors, investors, and researchers seeking actionable insights into this dynamic market.
Organic Peroxide Industry Market Concentration & Innovation
This section analyzes the competitive landscape of the organic peroxide market, examining market concentration, innovation drivers, regulatory frameworks, product substitutes, end-user trends, and mergers & acquisitions (M&A) activities. The report quantifies market share held by leading players like Arkema Group, Nouryon, and United Initiators, among others. It also investigates the impact of R&D investments on innovation and new product development within the industry, with specific examples of novel organic peroxide applications. The analysis includes a review of relevant regulations and their influence on market growth. Furthermore, the report assesses the impact of substitute materials and evolving end-user preferences on market dynamics. Finally, significant M&A activities are highlighted, including deal values and their strategic implications for the industry's consolidation and competitive landscape. The overall market concentration is expected to be moderately high, with a few major players holding significant market share in xx Million. Significant M&A activity is expected to continue, with projected deal values in the xx Million range over the forecast period.
- Market Share Analysis: Detailed breakdown of market share held by key players.
- Innovation Drivers: Assessment of R&D spending and technological advancements.
- Regulatory Landscape: Analysis of key regulations and their impact.
- Substitute Products: Evaluation of the threat from substitute materials.
- End-User Trends: Examination of changing demand patterns in various applications.
- M&A Activity: Review of significant mergers and acquisitions, including deal values.
Organic Peroxide Industry Industry Trends & Insights
This section delves into the key trends and insights shaping the organic peroxide market. It explores market growth drivers, technological disruptions, evolving consumer preferences, and competitive dynamics. The report provides a detailed analysis of the factors contributing to the market's Compound Annual Growth Rate (CAGR), projecting a CAGR of xx% during the forecast period (2025-2033). Market penetration of organic peroxides in various end-use industries is also assessed, revealing the varying levels of adoption across different applications. The analysis will include insights into emerging technologies and their potential to transform the industry, as well as shifts in consumer demand influencing the market. The competitive dynamics, including pricing strategies, market positioning, and strategic partnerships, are also evaluated, offering a comprehensive understanding of the market's current state and future trajectory. The increasing demand for high-performance materials in various industries is expected to be a significant driver of market growth, contributing to a market size of xx Million by 2033.
Dominant Markets & Segments in Organic Peroxide Industry
This section identifies the dominant regions, countries, and market segments within the organic peroxide industry. The analysis focuses on key application segments (Polymers and Rubber, Coatings and Adhesives, Paper and Textile, Cosmetics, Healthcare, Other Applications) and product types (Diacyl Peroxides, Ketone Peroxides, Percarbonates, Benzoyl Peroxide, Dialkyl Peroxides, Hydro-Peroxides, Peroxyesters, Other Types). The report will pinpoint the leading segment by revenue and volume, detailing factors that contribute to its dominance.
Dominant Application Segments:
- Polymers and Rubber: Strong growth driven by the expanding automotive and construction industries.
- Coatings and Adhesives: High demand from the increasing construction and packaging sectors.
- Paper and Textile: Moderate growth, influenced by industry-specific regulations and innovation.
- Cosmetics and Healthcare: Niche market with steady growth driven by demand for specialized products.
- Other Applications: A diverse segment with variable growth depending on the specific application.
Dominant Product Types:
- Benzoyl Peroxide: Largest market share due to wide applications.
- Dialkyl Peroxides: Significant growth potential in specific applications.
- Other Types: A diverse range of peroxides with specific niche applications.
Key Drivers for Dominant Segments: Bullet points detailing economic policies, infrastructure developments, and technological advancements driving growth in the leading segments and regions will be included.
Organic Peroxide Industry Product Developments
Recent years have seen significant innovations in organic peroxide technology, focusing on enhancing performance, safety, and sustainability. New product formulations with improved efficiency and reduced environmental impact are driving market growth. Companies are actively developing specialized organic peroxides tailored to specific applications, leading to enhanced performance and reduced costs for end-users. The integration of advanced technologies, such as nanotechnology, is further optimizing the properties and applications of organic peroxides. This trend towards greater specificity and efficiency is set to continue, creating new opportunities for growth and innovation in the market.
Report Scope & Segmentation Analysis
This report offers a comprehensive segmentation of the organic peroxide market, analyzing each segment's growth projections, market size, and competitive dynamics. The analysis covers the aforementioned application and type segments, providing detailed information on market size and growth forecasts for each. The competitive landscape within each segment is also examined, highlighting major players and their market strategies.
- Application Segmentation: Each application segment will have a dedicated paragraph with growth projections, market sizes, and competitive dynamics.
- Type Segmentation: Each type segment will have a dedicated paragraph with growth projections, market sizes, and competitive dynamics.
Key Drivers of Organic Peroxide Industry Growth
The organic peroxide market's growth is propelled by several factors. The increasing demand for high-performance polymers and resins in various industries such as automotive, construction, and packaging is a primary driver. Technological advancements leading to more efficient and safer peroxide formulations are further boosting market growth. Stringent regulatory requirements concerning the use of alternative chemicals are pushing the adoption of organic peroxides as a safer alternative in many applications. Favorable economic conditions in key markets also contribute significantly to the market's expansion.
Challenges in the Organic Peroxide Industry Sector
Despite its growth potential, the organic peroxide industry faces certain challenges. Stringent safety regulations and environmental concerns related to the handling and disposal of these chemicals pose significant hurdles. Fluctuations in raw material prices and supply chain disruptions can impact production costs and profitability. Intense competition from other cross-linking agents and emerging technologies further adds to the challenges faced by industry players. These factors can impact market growth and profitability, requiring companies to adopt strategic measures to mitigate these risks.
Emerging Opportunities in Organic Peroxide Industry
The organic peroxide market presents various opportunities for growth. The expanding demand for sustainable and eco-friendly products is opening doors for bio-based organic peroxides and innovative formulations with reduced environmental impact. The development of specialized organic peroxides for niche applications, particularly in high-growth industries like electronics and renewable energy, holds significant potential. Furthermore, exploring new markets and expanding into developing economies presents considerable growth opportunities.
Leading Players in the Organic Peroxide Industry Market
- Arkema Group
- Nouryon
- United Initiators
- Lianyungang Hualun Chemical Co Ltd
- AKPA KİMYA
- Plasti Pigments Pvt Ltd
- PERGAN GmbH
- Novichem Spzoo
- Kawaguchi Chemical Co Ltd
- MPI Chemie BV
- ACE CHEMICAL CORP
- NOF CORPORATION
- Chinasun Specialty Products Co Ltd
Key Developments in Organic Peroxide Industry Industry
- July 2022: United Initiators completed a new TBHP-TBA facility with 25 ktons/a capacity in Huaibei, Anhui Province, China, expanding its downstream organic peroxide production and strengthening its market presence.
- October 2022: Arkema announced a reorganization of its Luperox and Retic organic peroxide distribution in several European countries, partnering with Weber and Schaer, The Dolder company, and Univar Solutions for the crosslinking market, effective January 1st, 2023. This strategic move aims to enhance market reach and distribution efficiency.
Strategic Outlook for Organic Peroxide Industry Market
The organic peroxide market is poised for continued growth, driven by increasing demand in key application areas and technological advancements. The focus on sustainability and the development of eco-friendly formulations will shape future market dynamics. Companies adopting innovative strategies, strategic partnerships, and efficient distribution networks will be better positioned to capitalize on the emerging growth opportunities in this dynamic market. The market is expected to witness significant expansion over the forecast period, with continued innovation and strategic collaborations driving further growth.
Organic Peroxide Industry Segmentation
-
1. Type
- 1.1. Diacyl Peroxides
- 1.2. Ketone Peroxides
- 1.3. Percarbonates
- 1.4. Benzoyl Peroxide
- 1.5. Dialkyl Peroxides
- 1.6. Hydro-Peroxides
- 1.7. Peroxyesters
- 1.8. Other Types
-
2. Application
- 2.1. Polymers and Rubber
- 2.2. Coatings and Adhesives
- 2.3. Paper and Textile
- 2.4. Cosmetics
- 2.5. Healthcare
- 2.6. Other Applications
Organic Peroxide Industry Segmentation By Geography
-
1. Asia Pacific
- 1.1. China
- 1.2. India
- 1.3. Japan
- 1.4. South Korea
- 1.5. Rest of Asia Pacific
-
2. North America
- 2.1. United States
- 2.2. Canada
- 2.3. Mexico
-
3. Europe
- 3.1. Germany
- 3.2. United Kingdom
- 3.3. Italy
- 3.4. France
- 3.5. Spain
- 3.6. Rest of Europe
-
4. South America
- 4.1. Brazil
- 4.2. Argentina
- 4.3. Rest of South America
-
5. Middle East and Africa
- 5.1. Saudi Arabia
- 5.2. South Africa
- 5.3. Rest of Middle East and Africa
Organic Peroxide Industry REPORT HIGHLIGHTS
| Aspects | Details |
|---|---|
| Study Period | 2019-2033 |
| Base Year | 2024 |
| Estimated Year | 2025 |
| Forecast Period | 2025-2033 |
| Historical Period | 2019-2024 |
| Growth Rate | CAGR of 4.44% from 2019-2033 |
| Segmentation |
|
Table of Contents
- 1. Introduction
- 1.1. Research Scope
- 1.2. Market Segmentation
- 1.3. Research Methodology
- 1.4. Definitions and Assumptions
- 2. Executive Summary
- 2.1. Introduction
- 3. Market Dynamics
- 3.1. Introduction
- 3.2. Market Drivers
- 3.2.1. Increasing Demand for Polymers from Various End-user Industries; Surging Utilization in Coating Applications
- 3.3. Market Restrains
- 3.3.1 Difficulty in Storage
- 3.3.2 Transport
- 3.3.3 and Handling Organic Peroxides
- 3.4. Market Trends
- 3.4.1. Polymers and Rubbers to Dominate the Market
- 4. Market Factor Analysis
- 4.1. Porters Five Forces
- 4.2. Supply/Value Chain
- 4.3. PESTEL analysis
- 4.4. Market Entropy
- 4.5. Patent/Trademark Analysis
- 5. Global Organic Peroxide Industry Analysis, Insights and Forecast, 2019-2031
- 5.1. Market Analysis, Insights and Forecast - by Type
- 5.1.1. Diacyl Peroxides
- 5.1.2. Ketone Peroxides
- 5.1.3. Percarbonates
- 5.1.4. Benzoyl Peroxide
- 5.1.5. Dialkyl Peroxides
- 5.1.6. Hydro-Peroxides
- 5.1.7. Peroxyesters
- 5.1.8. Other Types
- 5.2. Market Analysis, Insights and Forecast - by Application
- 5.2.1. Polymers and Rubber
- 5.2.2. Coatings and Adhesives
- 5.2.3. Paper and Textile
- 5.2.4. Cosmetics
- 5.2.5. Healthcare
- 5.2.6. Other Applications
- 5.3. Market Analysis, Insights and Forecast - by Region
- 5.3.1. Asia Pacific
- 5.3.2. North America
- 5.3.3. Europe
- 5.3.4. South America
- 5.3.5. Middle East and Africa
- 5.1. Market Analysis, Insights and Forecast - by Type
- 6. Asia Pacific Organic Peroxide Industry Analysis, Insights and Forecast, 2019-2031
- 6.1. Market Analysis, Insights and Forecast - by Type
- 6.1.1. Diacyl Peroxides
- 6.1.2. Ketone Peroxides
- 6.1.3. Percarbonates
- 6.1.4. Benzoyl Peroxide
- 6.1.5. Dialkyl Peroxides
- 6.1.6. Hydro-Peroxides
- 6.1.7. Peroxyesters
- 6.1.8. Other Types
- 6.2. Market Analysis, Insights and Forecast - by Application
- 6.2.1. Polymers and Rubber
- 6.2.2. Coatings and Adhesives
- 6.2.3. Paper and Textile
- 6.2.4. Cosmetics
- 6.2.5. Healthcare
- 6.2.6. Other Applications
- 6.1. Market Analysis, Insights and Forecast - by Type
- 7. North America Organic Peroxide Industry Analysis, Insights and Forecast, 2019-2031
- 7.1. Market Analysis, Insights and Forecast - by Type
- 7.1.1. Diacyl Peroxides
- 7.1.2. Ketone Peroxides
- 7.1.3. Percarbonates
- 7.1.4. Benzoyl Peroxide
- 7.1.5. Dialkyl Peroxides
- 7.1.6. Hydro-Peroxides
- 7.1.7. Peroxyesters
- 7.1.8. Other Types
- 7.2. Market Analysis, Insights and Forecast - by Application
- 7.2.1. Polymers and Rubber
- 7.2.2. Coatings and Adhesives
- 7.2.3. Paper and Textile
- 7.2.4. Cosmetics
- 7.2.5. Healthcare
- 7.2.6. Other Applications
- 7.1. Market Analysis, Insights and Forecast - by Type
- 8. Europe Organic Peroxide Industry Analysis, Insights and Forecast, 2019-2031
- 8.1. Market Analysis, Insights and Forecast - by Type
- 8.1.1. Diacyl Peroxides
- 8.1.2. Ketone Peroxides
- 8.1.3. Percarbonates
- 8.1.4. Benzoyl Peroxide
- 8.1.5. Dialkyl Peroxides
- 8.1.6. Hydro-Peroxides
- 8.1.7. Peroxyesters
- 8.1.8. Other Types
- 8.2. Market Analysis, Insights and Forecast - by Application
- 8.2.1. Polymers and Rubber
- 8.2.2. Coatings and Adhesives
- 8.2.3. Paper and Textile
- 8.2.4. Cosmetics
- 8.2.5. Healthcare
- 8.2.6. Other Applications
- 8.1. Market Analysis, Insights and Forecast - by Type
- 9. South America Organic Peroxide Industry Analysis, Insights and Forecast, 2019-2031
- 9.1. Market Analysis, Insights and Forecast - by Type
- 9.1.1. Diacyl Peroxides
- 9.1.2. Ketone Peroxides
- 9.1.3. Percarbonates
- 9.1.4. Benzoyl Peroxide
- 9.1.5. Dialkyl Peroxides
- 9.1.6. Hydro-Peroxides
- 9.1.7. Peroxyesters
- 9.1.8. Other Types
- 9.2. Market Analysis, Insights and Forecast - by Application
- 9.2.1. Polymers and Rubber
- 9.2.2. Coatings and Adhesives
- 9.2.3. Paper and Textile
- 9.2.4. Cosmetics
- 9.2.5. Healthcare
- 9.2.6. Other Applications
- 9.1. Market Analysis, Insights and Forecast - by Type
- 10. Middle East and Africa Organic Peroxide Industry Analysis, Insights and Forecast, 2019-2031
- 10.1. Market Analysis, Insights and Forecast - by Type
- 10.1.1. Diacyl Peroxides
- 10.1.2. Ketone Peroxides
- 10.1.3. Percarbonates
- 10.1.4. Benzoyl Peroxide
- 10.1.5. Dialkyl Peroxides
- 10.1.6. Hydro-Peroxides
- 10.1.7. Peroxyesters
- 10.1.8. Other Types
- 10.2. Market Analysis, Insights and Forecast - by Application
- 10.2.1. Polymers and Rubber
- 10.2.2. Coatings and Adhesives
- 10.2.3. Paper and Textile
- 10.2.4. Cosmetics
- 10.2.5. Healthcare
- 10.2.6. Other Applications
- 10.1. Market Analysis, Insights and Forecast - by Type
- 11. Asia Pacific Organic Peroxide Industry Analysis, Insights and Forecast, 2019-2031
- 11.1. Market Analysis, Insights and Forecast - By Country/Sub-region
- 11.1.1 China
- 11.1.2 India
- 11.1.3 Japan
- 11.1.4 South Korea
- 11.1.5 Rest of Asia Pacific
- 12. North America Organic Peroxide Industry Analysis, Insights and Forecast, 2019-2031
- 12.1. Market Analysis, Insights and Forecast - By Country/Sub-region
- 12.1.1 United States
- 12.1.2 Canada
- 12.1.3 Mexico
- 13. Europe Organic Peroxide Industry Analysis, Insights and Forecast, 2019-2031
- 13.1. Market Analysis, Insights and Forecast - By Country/Sub-region
- 13.1.1 Germany
- 13.1.2 United Kingdom
- 13.1.3 Italy
- 13.1.4 France
- 13.1.5 Spain
- 13.1.6 Rest of Europe
- 14. South America Organic Peroxide Industry Analysis, Insights and Forecast, 2019-2031
- 14.1. Market Analysis, Insights and Forecast - By Country/Sub-region
- 14.1.1 Brazil
- 14.1.2 Argentina
- 14.1.3 Rest of South America
- 15. Middle East and Africa Organic Peroxide Industry Analysis, Insights and Forecast, 2019-2031
- 15.1. Market Analysis, Insights and Forecast - By Country/Sub-region
- 15.1.1 Saudi Arabia
- 15.1.2 South Africa
- 15.1.3 Rest of Middle East and Africa
- 16. Competitive Analysis
- 16.1. Global Market Share Analysis 2024
- 16.2. Company Profiles
- 16.2.1 Lianyungang Hualun Chemical Co Ltd
- 16.2.1.1. Overview
- 16.2.1.2. Products
- 16.2.1.3. SWOT Analysis
- 16.2.1.4. Recent Developments
- 16.2.1.5. Financials (Based on Availability)
- 16.2.2 AKPA KİMYA
- 16.2.2.1. Overview
- 16.2.2.2. Products
- 16.2.2.3. SWOT Analysis
- 16.2.2.4. Recent Developments
- 16.2.2.5. Financials (Based on Availability)
- 16.2.3 Nouryon
- 16.2.3.1. Overview
- 16.2.3.2. Products
- 16.2.3.3. SWOT Analysis
- 16.2.3.4. Recent Developments
- 16.2.3.5. Financials (Based on Availability)
- 16.2.4 Plasti Pigments Pvt Ltd
- 16.2.4.1. Overview
- 16.2.4.2. Products
- 16.2.4.3. SWOT Analysis
- 16.2.4.4. Recent Developments
- 16.2.4.5. Financials (Based on Availability)
- 16.2.5 PERGAN GmbH
- 16.2.5.1. Overview
- 16.2.5.2. Products
- 16.2.5.3. SWOT Analysis
- 16.2.5.4. Recent Developments
- 16.2.5.5. Financials (Based on Availability)
- 16.2.6 Novichem Spzoo
- 16.2.6.1. Overview
- 16.2.6.2. Products
- 16.2.6.3. SWOT Analysis
- 16.2.6.4. Recent Developments
- 16.2.6.5. Financials (Based on Availability)
- 16.2.7 United Initiators*List Not Exhaustive
- 16.2.7.1. Overview
- 16.2.7.2. Products
- 16.2.7.3. SWOT Analysis
- 16.2.7.4. Recent Developments
- 16.2.7.5. Financials (Based on Availability)
- 16.2.8 Kawaguchi Chemical Co Ltd
- 16.2.8.1. Overview
- 16.2.8.2. Products
- 16.2.8.3. SWOT Analysis
- 16.2.8.4. Recent Developments
- 16.2.8.5. Financials (Based on Availability)
- 16.2.9 MPI Chemie BV
- 16.2.9.1. Overview
- 16.2.9.2. Products
- 16.2.9.3. SWOT Analysis
- 16.2.9.4. Recent Developments
- 16.2.9.5. Financials (Based on Availability)
- 16.2.10 ACE CHEMICAL CORP
- 16.2.10.1. Overview
- 16.2.10.2. Products
- 16.2.10.3. SWOT Analysis
- 16.2.10.4. Recent Developments
- 16.2.10.5. Financials (Based on Availability)
- 16.2.11 Arkema Group
- 16.2.11.1. Overview
- 16.2.11.2. Products
- 16.2.11.3. SWOT Analysis
- 16.2.11.4. Recent Developments
- 16.2.11.5. Financials (Based on Availability)
- 16.2.12 NOF CORPORATION
- 16.2.12.1. Overview
- 16.2.12.2. Products
- 16.2.12.3. SWOT Analysis
- 16.2.12.4. Recent Developments
- 16.2.12.5. Financials (Based on Availability)
- 16.2.13 Chinasun Specialty Products Co Ltd
- 16.2.13.1. Overview
- 16.2.13.2. Products
- 16.2.13.3. SWOT Analysis
- 16.2.13.4. Recent Developments
- 16.2.13.5. Financials (Based on Availability)
- 16.2.1 Lianyungang Hualun Chemical Co Ltd
List of Figures
- Figure 1: Global Organic Peroxide Industry Revenue Breakdown (Million, %) by Region 2024 & 2032
- Figure 2: Asia Pacific Organic Peroxide Industry Revenue (Million), by Country 2024 & 2032
- Figure 3: Asia Pacific Organic Peroxide Industry Revenue Share (%), by Country 2024 & 2032
- Figure 4: North America Organic Peroxide Industry Revenue (Million), by Country 2024 & 2032
- Figure 5: North America Organic Peroxide Industry Revenue Share (%), by Country 2024 & 2032
- Figure 6: Europe Organic Peroxide Industry Revenue (Million), by Country 2024 & 2032
- Figure 7: Europe Organic Peroxide Industry Revenue Share (%), by Country 2024 & 2032
- Figure 8: South America Organic Peroxide Industry Revenue (Million), by Country 2024 & 2032
- Figure 9: South America Organic Peroxide Industry Revenue Share (%), by Country 2024 & 2032
- Figure 10: Middle East and Africa Organic Peroxide Industry Revenue (Million), by Country 2024 & 2032
- Figure 11: Middle East and Africa Organic Peroxide Industry Revenue Share (%), by Country 2024 & 2032
- Figure 12: Asia Pacific Organic Peroxide Industry Revenue (Million), by Type 2024 & 2032
- Figure 13: Asia Pacific Organic Peroxide Industry Revenue Share (%), by Type 2024 & 2032
- Figure 14: Asia Pacific Organic Peroxide Industry Revenue (Million), by Application 2024 & 2032
- Figure 15: Asia Pacific Organic Peroxide Industry Revenue Share (%), by Application 2024 & 2032
- Figure 16: Asia Pacific Organic Peroxide Industry Revenue (Million), by Country 2024 & 2032
- Figure 17: Asia Pacific Organic Peroxide Industry Revenue Share (%), by Country 2024 & 2032
- Figure 18: North America Organic Peroxide Industry Revenue (Million), by Type 2024 & 2032
- Figure 19: North America Organic Peroxide Industry Revenue Share (%), by Type 2024 & 2032
- Figure 20: North America Organic Peroxide Industry Revenue (Million), by Application 2024 & 2032
- Figure 21: North America Organic Peroxide Industry Revenue Share (%), by Application 2024 & 2032
- Figure 22: North America Organic Peroxide Industry Revenue (Million), by Country 2024 & 2032
- Figure 23: North America Organic Peroxide Industry Revenue Share (%), by Country 2024 & 2032
- Figure 24: Europe Organic Peroxide Industry Revenue (Million), by Type 2024 & 2032
- Figure 25: Europe Organic Peroxide Industry Revenue Share (%), by Type 2024 & 2032
- Figure 26: Europe Organic Peroxide Industry Revenue (Million), by Application 2024 & 2032
- Figure 27: Europe Organic Peroxide Industry Revenue Share (%), by Application 2024 & 2032
- Figure 28: Europe Organic Peroxide Industry Revenue (Million), by Country 2024 & 2032
- Figure 29: Europe Organic Peroxide Industry Revenue Share (%), by Country 2024 & 2032
- Figure 30: South America Organic Peroxide Industry Revenue (Million), by Type 2024 & 2032
- Figure 31: South America Organic Peroxide Industry Revenue Share (%), by Type 2024 & 2032
- Figure 32: South America Organic Peroxide Industry Revenue (Million), by Application 2024 & 2032
- Figure 33: South America Organic Peroxide Industry Revenue Share (%), by Application 2024 & 2032
- Figure 34: South America Organic Peroxide Industry Revenue (Million), by Country 2024 & 2032
- Figure 35: South America Organic Peroxide Industry Revenue Share (%), by Country 2024 & 2032
- Figure 36: Middle East and Africa Organic Peroxide Industry Revenue (Million), by Type 2024 & 2032
- Figure 37: Middle East and Africa Organic Peroxide Industry Revenue Share (%), by Type 2024 & 2032
- Figure 38: Middle East and Africa Organic Peroxide Industry Revenue (Million), by Application 2024 & 2032
- Figure 39: Middle East and Africa Organic Peroxide Industry Revenue Share (%), by Application 2024 & 2032
- Figure 40: Middle East and Africa Organic Peroxide Industry Revenue (Million), by Country 2024 & 2032
- Figure 41: Middle East and Africa Organic Peroxide Industry Revenue Share (%), by Country 2024 & 2032
List of Tables
- Table 1: Global Organic Peroxide Industry Revenue Million Forecast, by Region 2019 & 2032
- Table 2: Global Organic Peroxide Industry Revenue Million Forecast, by Type 2019 & 2032
- Table 3: Global Organic Peroxide Industry Revenue Million Forecast, by Application 2019 & 2032
- Table 4: Global Organic Peroxide Industry Revenue Million Forecast, by Region 2019 & 2032
- Table 5: Global Organic Peroxide Industry Revenue Million Forecast, by Country 2019 & 2032
- Table 6: China Organic Peroxide Industry Revenue (Million) Forecast, by Application 2019 & 2032
- Table 7: India Organic Peroxide Industry Revenue (Million) Forecast, by Application 2019 & 2032
- Table 8: Japan Organic Peroxide Industry Revenue (Million) Forecast, by Application 2019 & 2032
- Table 9: South Korea Organic Peroxide Industry Revenue (Million) Forecast, by Application 2019 & 2032
- Table 10: Rest of Asia Pacific Organic Peroxide Industry Revenue (Million) Forecast, by Application 2019 & 2032
- Table 11: Global Organic Peroxide Industry Revenue Million Forecast, by Country 2019 & 2032
- Table 12: United States Organic Peroxide Industry Revenue (Million) Forecast, by Application 2019 & 2032
- Table 13: Canada Organic Peroxide Industry Revenue (Million) Forecast, by Application 2019 & 2032
- Table 14: Mexico Organic Peroxide Industry Revenue (Million) Forecast, by Application 2019 & 2032
- Table 15: Global Organic Peroxide Industry Revenue Million Forecast, by Country 2019 & 2032
- Table 16: Germany Organic Peroxide Industry Revenue (Million) Forecast, by Application 2019 & 2032
- Table 17: United Kingdom Organic Peroxide Industry Revenue (Million) Forecast, by Application 2019 & 2032
- Table 18: Italy Organic Peroxide Industry Revenue (Million) Forecast, by Application 2019 & 2032
- Table 19: France Organic Peroxide Industry Revenue (Million) Forecast, by Application 2019 & 2032
- Table 20: Spain Organic Peroxide Industry Revenue (Million) Forecast, by Application 2019 & 2032
- Table 21: Rest of Europe Organic Peroxide Industry Revenue (Million) Forecast, by Application 2019 & 2032
- Table 22: Global Organic Peroxide Industry Revenue Million Forecast, by Country 2019 & 2032
- Table 23: Brazil Organic Peroxide Industry Revenue (Million) Forecast, by Application 2019 & 2032
- Table 24: Argentina Organic Peroxide Industry Revenue (Million) Forecast, by Application 2019 & 2032
- Table 25: Rest of South America Organic Peroxide Industry Revenue (Million) Forecast, by Application 2019 & 2032
- Table 26: Global Organic Peroxide Industry Revenue Million Forecast, by Country 2019 & 2032
- Table 27: Saudi Arabia Organic Peroxide Industry Revenue (Million) Forecast, by Application 2019 & 2032
- Table 28: South Africa Organic Peroxide Industry Revenue (Million) Forecast, by Application 2019 & 2032
- Table 29: Rest of Middle East and Africa Organic Peroxide Industry Revenue (Million) Forecast, by Application 2019 & 2032
- Table 30: Global Organic Peroxide Industry Revenue Million Forecast, by Type 2019 & 2032
- Table 31: Global Organic Peroxide Industry Revenue Million Forecast, by Application 2019 & 2032
- Table 32: Global Organic Peroxide Industry Revenue Million Forecast, by Country 2019 & 2032
- Table 33: China Organic Peroxide Industry Revenue (Million) Forecast, by Application 2019 & 2032
- Table 34: India Organic Peroxide Industry Revenue (Million) Forecast, by Application 2019 & 2032
- Table 35: Japan Organic Peroxide Industry Revenue (Million) Forecast, by Application 2019 & 2032
- Table 36: South Korea Organic Peroxide Industry Revenue (Million) Forecast, by Application 2019 & 2032
- Table 37: Rest of Asia Pacific Organic Peroxide Industry Revenue (Million) Forecast, by Application 2019 & 2032
- Table 38: Global Organic Peroxide Industry Revenue Million Forecast, by Type 2019 & 2032
- Table 39: Global Organic Peroxide Industry Revenue Million Forecast, by Application 2019 & 2032
- Table 40: Global Organic Peroxide Industry Revenue Million Forecast, by Country 2019 & 2032
- Table 41: United States Organic Peroxide Industry Revenue (Million) Forecast, by Application 2019 & 2032
- Table 42: Canada Organic Peroxide Industry Revenue (Million) Forecast, by Application 2019 & 2032
- Table 43: Mexico Organic Peroxide Industry Revenue (Million) Forecast, by Application 2019 & 2032
- Table 44: Global Organic Peroxide Industry Revenue Million Forecast, by Type 2019 & 2032
- Table 45: Global Organic Peroxide Industry Revenue Million Forecast, by Application 2019 & 2032
- Table 46: Global Organic Peroxide Industry Revenue Million Forecast, by Country 2019 & 2032
- Table 47: Germany Organic Peroxide Industry Revenue (Million) Forecast, by Application 2019 & 2032
- Table 48: United Kingdom Organic Peroxide Industry Revenue (Million) Forecast, by Application 2019 & 2032
- Table 49: Italy Organic Peroxide Industry Revenue (Million) Forecast, by Application 2019 & 2032
- Table 50: France Organic Peroxide Industry Revenue (Million) Forecast, by Application 2019 & 2032
- Table 51: Spain Organic Peroxide Industry Revenue (Million) Forecast, by Application 2019 & 2032
- Table 52: Rest of Europe Organic Peroxide Industry Revenue (Million) Forecast, by Application 2019 & 2032
- Table 53: Global Organic Peroxide Industry Revenue Million Forecast, by Type 2019 & 2032
- Table 54: Global Organic Peroxide Industry Revenue Million Forecast, by Application 2019 & 2032
- Table 55: Global Organic Peroxide Industry Revenue Million Forecast, by Country 2019 & 2032
- Table 56: Brazil Organic Peroxide Industry Revenue (Million) Forecast, by Application 2019 & 2032
- Table 57: Argentina Organic Peroxide Industry Revenue (Million) Forecast, by Application 2019 & 2032
- Table 58: Rest of South America Organic Peroxide Industry Revenue (Million) Forecast, by Application 2019 & 2032
- Table 59: Global Organic Peroxide Industry Revenue Million Forecast, by Type 2019 & 2032
- Table 60: Global Organic Peroxide Industry Revenue Million Forecast, by Application 2019 & 2032
- Table 61: Global Organic Peroxide Industry Revenue Million Forecast, by Country 2019 & 2032
- Table 62: Saudi Arabia Organic Peroxide Industry Revenue (Million) Forecast, by Application 2019 & 2032
- Table 63: South Africa Organic Peroxide Industry Revenue (Million) Forecast, by Application 2019 & 2032
- Table 64: Rest of Middle East and Africa Organic Peroxide Industry Revenue (Million) Forecast, by Application 2019 & 2032
Frequently Asked Questions
1. What is the projected Compound Annual Growth Rate (CAGR) of the Organic Peroxide Industry?
The projected CAGR is approximately 4.44%.
2. Which companies are prominent players in the Organic Peroxide Industry?
Key companies in the market include Lianyungang Hualun Chemical Co Ltd, AKPA KİMYA, Nouryon, Plasti Pigments Pvt Ltd, PERGAN GmbH, Novichem Spzoo, United Initiators*List Not Exhaustive, Kawaguchi Chemical Co Ltd, MPI Chemie BV, ACE CHEMICAL CORP, Arkema Group, NOF CORPORATION, Chinasun Specialty Products Co Ltd.
3. What are the main segments of the Organic Peroxide Industry?
The market segments include Type, Application.
4. Can you provide details about the market size?
The market size is estimated to be USD 1.30 Million as of 2022.
5. What are some drivers contributing to market growth?
Increasing Demand for Polymers from Various End-user Industries; Surging Utilization in Coating Applications.
6. What are the notable trends driving market growth?
Polymers and Rubbers to Dominate the Market.
7. Are there any restraints impacting market growth?
Difficulty in Storage. Transport. and Handling Organic Peroxides.
8. Can you provide examples of recent developments in the market?
In October 2022, Arkema announced that the company will reorganize the distribution of its Luperox and Retic organic peroxides, with Weber and Schaer, The Dolder company, and Univar Solutions, for the crosslinking market in several European countries as of January 1st, 2023.
9. What pricing options are available for accessing the report?
Pricing options include single-user, multi-user, and enterprise licenses priced at USD 4750, USD 5250, and USD 8750 respectively.
10. Is the market size provided in terms of value or volume?
The market size is provided in terms of value, measured in Million.
11. Are there any specific market keywords associated with the report?
Yes, the market keyword associated with the report is "Organic Peroxide Industry," which aids in identifying and referencing the specific market segment covered.
12. How do I determine which pricing option suits my needs best?
The pricing options vary based on user requirements and access needs. Individual users may opt for single-user licenses, while businesses requiring broader access may choose multi-user or enterprise licenses for cost-effective access to the report.
13. Are there any additional resources or data provided in the Organic Peroxide Industry report?
While the report offers comprehensive insights, it's advisable to review the specific contents or supplementary materials provided to ascertain if additional resources or data are available.
14. How can I stay updated on further developments or reports in the Organic Peroxide Industry?
To stay informed about further developments, trends, and reports in the Organic Peroxide Industry, consider subscribing to industry newsletters, following relevant companies and organizations, or regularly checking reputable industry news sources and publications.
Methodology
Step 1 - Identification of Relevant Samples Size from Population Database


Step 2 - Approaches for Defining Global Market Size (Value, Volume* & Price*)

Note*: In applicable scenarios
Step 3 - Data Sources
Primary Research
- Web Analytics
- Survey Reports
- Research Institute
- Latest Research Reports
- Opinion Leaders
Secondary Research
- Annual Reports
- White Paper
- Latest Press Release
- Industry Association
- Paid Database
- Investor Presentations

Step 4 - Data Triangulation
Involves using different sources of information in order to increase the validity of a study
These sources are likely to be stakeholders in a program - participants, other researchers, program staff, other community members, and so on.
Then we put all data in single framework & apply various statistical tools to find out the dynamic on the market.
During the analysis stage, feedback from the stakeholder groups would be compared to determine areas of agreement as well as areas of divergence


