
Key Insights
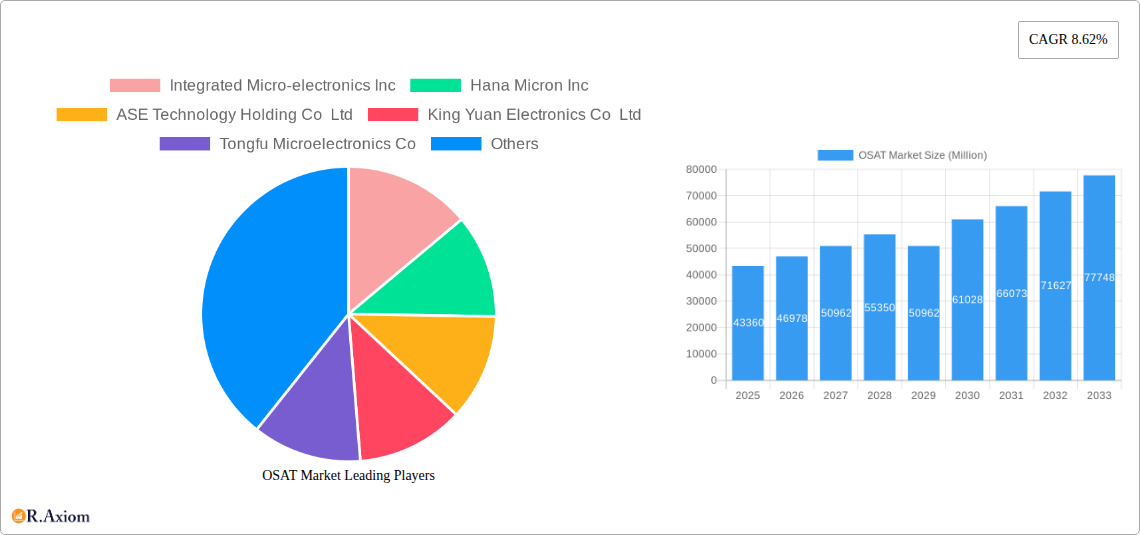
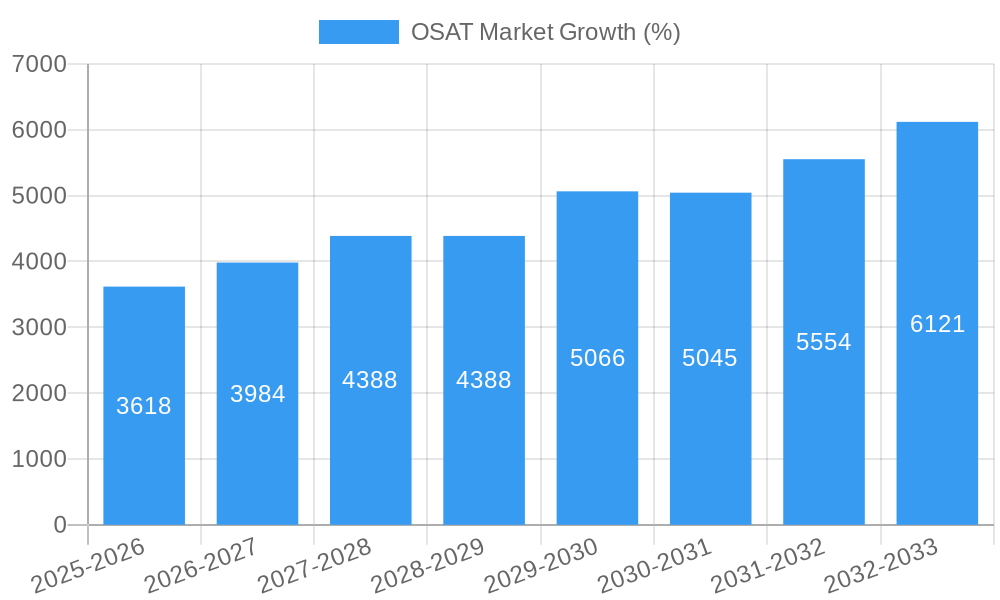
The OSAT (Outsourcing Semiconductor Assembly and Test) market is experiencing robust growth, projected to reach \$43.36 billion in 2025 and maintain a compound annual growth rate (CAGR) of 8.62% from 2025 to 2033. This expansion is driven by several key factors. The increasing demand for advanced packaging technologies like Ball Grid Array (BGA), Chip Scale Packaging (CSP), and stacked die packaging, fueled by the proliferation of high-performance computing, artificial intelligence, and 5G communication devices, is a major catalyst. Furthermore, the rising adoption of miniaturization and system-in-package (SiP) solutions in consumer electronics, automotive, and industrial applications is significantly boosting market demand. The outsourcing trend among semiconductor companies, aiming to optimize production costs and focus on core competencies, further fuels the OSAT market's growth. However, challenges like fluctuating raw material prices, geopolitical uncertainties, and the complexity of advanced packaging technologies could potentially restrain market growth to some extent.
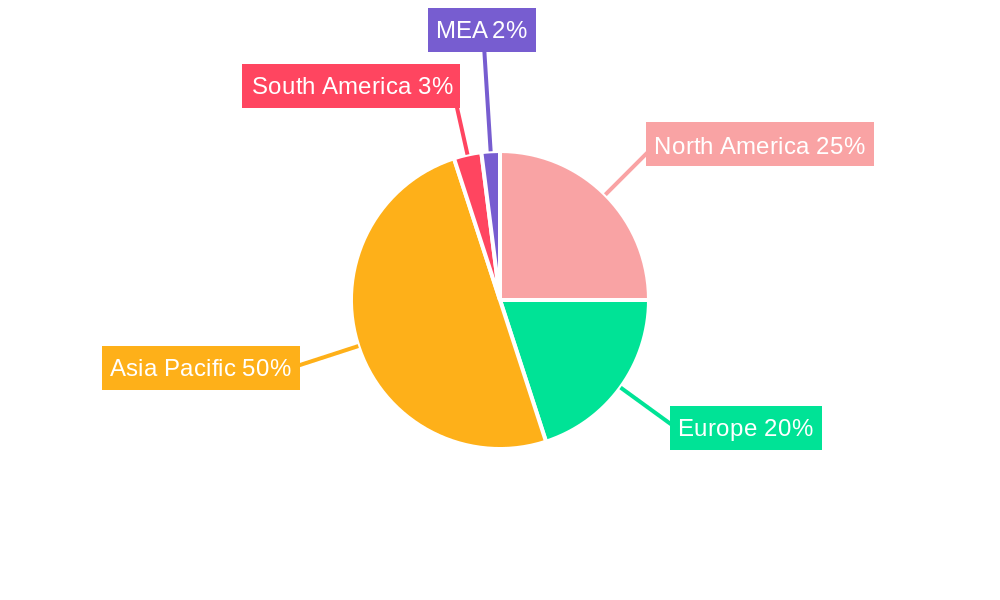
Geographical distribution shows a significant concentration of the OSAT market in the Asia-Pacific region, particularly in China, Japan, South Korea, and Taiwan, driven by established manufacturing hubs and strong technological expertise. North America and Europe also hold substantial market shares, contributing significantly to the overall growth. Segment-wise, the market is diversified across various service types (packaging and testing) and application areas (consumer electronics, automotive, computing and networking, etc.). The competitive landscape features a mix of large multinational corporations and regional players, indicating a level of market consolidation alongside the emergence of innovative players. Future growth will likely be shaped by continuous advancements in packaging technologies, the rising demand for high-bandwidth memory solutions, and the ongoing expansion of the global electronics industry.
OSAT Market: A Comprehensive Market Report (2019-2033)
This in-depth report provides a comprehensive analysis of the OSAT (Outsourced Semiconductor Assembly and Test) market, covering market size, segmentation, growth drivers, challenges, and key players. The study period spans from 2019 to 2033, with 2025 serving as the base and estimated year. The report offers actionable insights for industry stakeholders, investors, and businesses seeking to navigate this dynamic market.
OSAT Market Market Concentration & Innovation
The OSAT market exhibits a moderately concentrated landscape, with a few dominant players holding significant market share. Market concentration is influenced by factors such as economies of scale, technological advancements, and strategic mergers and acquisitions (M&A). The top 10 companies account for approximately xx% of the global market share in 2025. Innovation is a key driver, with companies investing heavily in R&D to develop advanced packaging technologies, such as 3D packaging and system-in-package (SiP) solutions. This is further fueled by increasing demand for miniaturization and higher performance in electronic devices.
- Market Share (2025): ASE Technology Holding Co Ltd (xx%), Amkor Technology Inc (xx%), Integrated Micro-electronics Inc (xx%), others (xx%).
- M&A Activity: The past five years have witnessed several significant M&A deals, valued at over USD xx billion, reflecting the industry's consolidation trend and quest for technological capabilities. For example, the acquisition of [Company A] by [Company B] in [Year] resulted in a significant expansion of [Company B]'s market reach and technological portfolio.
- Regulatory Landscape: Government regulations and policies related to semiconductor manufacturing and trade significantly impact market dynamics. Fluctuations in these regulations can influence investment decisions and market growth.
- Product Substitutes: While direct substitutes for OSAT services are limited, alternative packaging technologies and in-house assembly capabilities by original equipment manufacturers (OEMs) present indirect competitive pressure.
- End-User Trends: The increasing demand for high-performance electronics across various sectors, such as automotive, consumer electronics, and communication, is driving significant growth in the OSAT market.
OSAT Market Industry Trends & Insights
The OSAT market is witnessing robust growth, driven by several key factors. The global market is projected to reach USD xx billion by 2033, exhibiting a CAGR of xx% during the forecast period (2025-2033). The increasing demand for miniaturized and high-performance electronic devices is a primary driver, pushing for advancements in packaging technologies like 3D stacking and System-in-Package (SiP). Technological disruptions, such as the introduction of advanced materials and automation, are further enhancing efficiency and reducing costs. Moreover, shifting consumer preferences towards sophisticated electronics are fueling demand. However, competitive dynamics, including pricing pressures and technological advancements, represent ongoing challenges for OSAT providers.
Dominant Markets & Segments in OSAT Market
The Asia-Pacific region dominates the OSAT market, driven by a strong manufacturing base and presence of key players in countries like China, Taiwan, and South Korea. Within the segments:
- By Service Type: Packaging holds a larger market share compared to testing, largely due to the higher complexity and value-add involved in advanced packaging solutions. The packaging segment is estimated to have a value of USD xx billion in 2025, while testing is valued at USD xx billion.
- By Type of Packaging: Ball Grid Array (BGA) Packaging currently holds the largest segment, but the growth of Chip Scale Packaging (CSP) and advanced technologies like Stacked Die and Multi Chip Packaging is accelerating. These advanced packaging types offer higher density and performance advantages, driving increased adoption in high-end applications.
- By Application: The consumer electronics segment currently leads in terms of revenue and volume, although the automotive and computing sectors are experiencing significant growth rates due to increasing integration of electronics into vehicles and data centers.
Key Drivers for Dominant Segments:
- Asia-Pacific: Strong government support for semiconductor industries, established manufacturing infrastructure, and a large pool of skilled labor.
- Packaging: Demand for miniaturization, performance enhancements, and cost optimization in electronic devices.
- BGA Packaging: Mature technology with established supply chains and wide applicability across various applications.
- Consumer Electronics: High volume demand for smartphones, wearables, and other consumer electronics products.
OSAT Market Product Developments
Recent product innovations in the OSAT market focus on advanced packaging technologies, such as 3D integration, heterogeneous integration, and fan-out wafer-level packaging (FOWLP). These advancements cater to the increasing demand for higher performance, miniaturization, and power efficiency in electronic devices. Companies are also investing in automation and process optimization to enhance efficiency and reduce costs. The market is increasingly characterized by flexible and customized packaging solutions to meet the diverse needs of various applications.
Report Scope & Segmentation Analysis
This report segments the OSAT market by service type (Packaging, Testing), type of packaging (Ball Grid Array (BGA) Packaging, Chip Scale Packaging (CSP), Stacked Die Packaging, Multi Chip Packaging, Quad Flat and Dual-inline Packaging), and application (Communication, Consumer Electronics, Automotive, Computing and Networking, Industrial, Other Applications). Each segment's market size, growth projections, and competitive dynamics are analyzed in detail. The report provides historical data from 2019 to 2024 and forecasts until 2033.
Key Drivers of OSAT Market Growth
The OSAT market growth is propelled by several factors:
- Technological advancements: The continuous development of advanced packaging technologies like 3D packaging and SiP is driving market expansion.
- Increasing demand for electronics: The rising demand for electronics across various end-use sectors, such as consumer electronics, automotive, and computing, significantly fuels the growth.
- Government initiatives: Government policies and incentives aimed at boosting domestic semiconductor industries, like India's "Make in India" initiative, are creating favorable market conditions.
Challenges in the OSAT Market Sector
The OSAT market faces several challenges:
- Intense competition: The market is highly competitive, with many players vying for market share.
- Supply chain disruptions: Global supply chain issues can impact the availability of materials and components.
- Technological complexity: Advanced packaging technologies require significant investments in R&D and specialized expertise.
Emerging Opportunities in OSAT Market
Several emerging opportunities exist within the OSAT market:
- Growth in emerging markets: Expanding markets in developing economies present significant growth potential.
- 5G technology: The rollout of 5G networks is driving demand for high-performance packaging solutions.
- Automotive electronics: The increasing use of electronics in automobiles presents a substantial growth avenue for OSAT providers.
Leading Players in the OSAT Market Market
- Integrated Micro-electronics Inc
- Hana Micron Inc
- ASE Technology Holding Co Ltd
- King Yuan Electronics Co Ltd
- Tongfu Microelectronics Co
- Jiangsu Changjiang Electronics Technology Co Ltd
- Formosa Advanced Technologies Co Ltd
- Chipbond Technology Corporation
- Powertech Technology Inc
- Tianshui Huatian Technology Co Ltd
- Lingsen Precision Industries Ltd
- Amkor Technology Inc
- UTAC Holdings Ltd
- ChipMOS Technologies Inc
Key Developments in OSAT Market Industry
- December 2023: Sahasra Electronics plans a USD 42.2 Million investment in a semiconductor packaging facility in India.
- November 2023: JCET Automotive Electronics (Shanghai) Co. Ltd receives a USD 0.61 Billion capital injection for an advanced packaging facility.
Strategic Outlook for OSAT Market Market
The OSAT market is poised for continued growth, driven by technological advancements, increasing demand for electronics, and favorable government policies. The focus on advanced packaging technologies and the expansion into new markets and applications will shape the future of the industry. Companies that invest in R&D, automation, and strategic partnerships are likely to succeed in this competitive landscape.
OSAT Market Segmentation
-
1. Service Type
- 1.1. Packaging
- 1.2. Testing
-
2. Type of Packaging
- 2.1. Ball Grid Array (BGA) Packaging
- 2.2. Chip Scale Packaging (CSP)
- 2.3. Stacked Die Packaging
- 2.4. Multi Chip Packaging
- 2.5. Quad Flat and Dual-inline Packaging
-
3. Application
- 3.1. Communication
- 3.2. Consumer Electronics
- 3.3. Automotive
- 3.4. Computing and Networking
- 3.5. Industrial
- 3.6. Other Applications
OSAT Market Segmentation By Geography
- 1. United States
- 2. China
- 3. Taiwan
- 4. South Korea
- 5. Malaysia
- 6. Singapore
- 7. Japan
OSAT Market REPORT HIGHLIGHTS
| Aspects | Details |
|---|---|
| Study Period | 2019-2033 |
| Base Year | 2024 |
| Estimated Year | 2025 |
| Forecast Period | 2025-2033 |
| Historical Period | 2019-2024 |
| Growth Rate | CAGR of 8.62% from 2019-2033 |
| Segmentation |
|
Table of Contents
- 1. Introduction
- 1.1. Research Scope
- 1.2. Market Segmentation
- 1.3. Research Methodology
- 1.4. Definitions and Assumptions
- 2. Executive Summary
- 2.1. Introduction
- 3. Market Dynamics
- 3.1. Introduction
- 3.2. Market Drivers
- 3.2.1. Increased Applications of Semiconductors in Automotive; Advancement in Semiconductor Packaging Due to Trends like 5G
- 3.3. Market Restrains
- 3.3.1. Vertical Integration is One of the Significant Concerns of OSAT Players
- 3.4. Market Trends
- 3.4.1. Communication to be the Largest Application Segment
- 4. Market Factor Analysis
- 4.1. Porters Five Forces
- 4.2. Supply/Value Chain
- 4.3. PESTEL analysis
- 4.4. Market Entropy
- 4.5. Patent/Trademark Analysis
- 5. Global OSAT Market Analysis, Insights and Forecast, 2019-2031
- 5.1. Market Analysis, Insights and Forecast - by Service Type
- 5.1.1. Packaging
- 5.1.2. Testing
- 5.2. Market Analysis, Insights and Forecast - by Type of Packaging
- 5.2.1. Ball Grid Array (BGA) Packaging
- 5.2.2. Chip Scale Packaging (CSP)
- 5.2.3. Stacked Die Packaging
- 5.2.4. Multi Chip Packaging
- 5.2.5. Quad Flat and Dual-inline Packaging
- 5.3. Market Analysis, Insights and Forecast - by Application
- 5.3.1. Communication
- 5.3.2. Consumer Electronics
- 5.3.3. Automotive
- 5.3.4. Computing and Networking
- 5.3.5. Industrial
- 5.3.6. Other Applications
- 5.4. Market Analysis, Insights and Forecast - by Region
- 5.4.1. United States
- 5.4.2. China
- 5.4.3. Taiwan
- 5.4.4. South Korea
- 5.4.5. Malaysia
- 5.4.6. Singapore
- 5.4.7. Japan
- 5.1. Market Analysis, Insights and Forecast - by Service Type
- 6. United States OSAT Market Analysis, Insights and Forecast, 2019-2031
- 6.1. Market Analysis, Insights and Forecast - by Service Type
- 6.1.1. Packaging
- 6.1.2. Testing
- 6.2. Market Analysis, Insights and Forecast - by Type of Packaging
- 6.2.1. Ball Grid Array (BGA) Packaging
- 6.2.2. Chip Scale Packaging (CSP)
- 6.2.3. Stacked Die Packaging
- 6.2.4. Multi Chip Packaging
- 6.2.5. Quad Flat and Dual-inline Packaging
- 6.3. Market Analysis, Insights and Forecast - by Application
- 6.3.1. Communication
- 6.3.2. Consumer Electronics
- 6.3.3. Automotive
- 6.3.4. Computing and Networking
- 6.3.5. Industrial
- 6.3.6. Other Applications
- 6.1. Market Analysis, Insights and Forecast - by Service Type
- 7. China OSAT Market Analysis, Insights and Forecast, 2019-2031
- 7.1. Market Analysis, Insights and Forecast - by Service Type
- 7.1.1. Packaging
- 7.1.2. Testing
- 7.2. Market Analysis, Insights and Forecast - by Type of Packaging
- 7.2.1. Ball Grid Array (BGA) Packaging
- 7.2.2. Chip Scale Packaging (CSP)
- 7.2.3. Stacked Die Packaging
- 7.2.4. Multi Chip Packaging
- 7.2.5. Quad Flat and Dual-inline Packaging
- 7.3. Market Analysis, Insights and Forecast - by Application
- 7.3.1. Communication
- 7.3.2. Consumer Electronics
- 7.3.3. Automotive
- 7.3.4. Computing and Networking
- 7.3.5. Industrial
- 7.3.6. Other Applications
- 7.1. Market Analysis, Insights and Forecast - by Service Type
- 8. Taiwan OSAT Market Analysis, Insights and Forecast, 2019-2031
- 8.1. Market Analysis, Insights and Forecast - by Service Type
- 8.1.1. Packaging
- 8.1.2. Testing
- 8.2. Market Analysis, Insights and Forecast - by Type of Packaging
- 8.2.1. Ball Grid Array (BGA) Packaging
- 8.2.2. Chip Scale Packaging (CSP)
- 8.2.3. Stacked Die Packaging
- 8.2.4. Multi Chip Packaging
- 8.2.5. Quad Flat and Dual-inline Packaging
- 8.3. Market Analysis, Insights and Forecast - by Application
- 8.3.1. Communication
- 8.3.2. Consumer Electronics
- 8.3.3. Automotive
- 8.3.4. Computing and Networking
- 8.3.5. Industrial
- 8.3.6. Other Applications
- 8.1. Market Analysis, Insights and Forecast - by Service Type
- 9. South Korea OSAT Market Analysis, Insights and Forecast, 2019-2031
- 9.1. Market Analysis, Insights and Forecast - by Service Type
- 9.1.1. Packaging
- 9.1.2. Testing
- 9.2. Market Analysis, Insights and Forecast - by Type of Packaging
- 9.2.1. Ball Grid Array (BGA) Packaging
- 9.2.2. Chip Scale Packaging (CSP)
- 9.2.3. Stacked Die Packaging
- 9.2.4. Multi Chip Packaging
- 9.2.5. Quad Flat and Dual-inline Packaging
- 9.3. Market Analysis, Insights and Forecast - by Application
- 9.3.1. Communication
- 9.3.2. Consumer Electronics
- 9.3.3. Automotive
- 9.3.4. Computing and Networking
- 9.3.5. Industrial
- 9.3.6. Other Applications
- 9.1. Market Analysis, Insights and Forecast - by Service Type
- 10. Malaysia OSAT Market Analysis, Insights and Forecast, 2019-2031
- 10.1. Market Analysis, Insights and Forecast - by Service Type
- 10.1.1. Packaging
- 10.1.2. Testing
- 10.2. Market Analysis, Insights and Forecast - by Type of Packaging
- 10.2.1. Ball Grid Array (BGA) Packaging
- 10.2.2. Chip Scale Packaging (CSP)
- 10.2.3. Stacked Die Packaging
- 10.2.4. Multi Chip Packaging
- 10.2.5. Quad Flat and Dual-inline Packaging
- 10.3. Market Analysis, Insights and Forecast - by Application
- 10.3.1. Communication
- 10.3.2. Consumer Electronics
- 10.3.3. Automotive
- 10.3.4. Computing and Networking
- 10.3.5. Industrial
- 10.3.6. Other Applications
- 10.1. Market Analysis, Insights and Forecast - by Service Type
- 11. Singapore OSAT Market Analysis, Insights and Forecast, 2019-2031
- 11.1. Market Analysis, Insights and Forecast - by Service Type
- 11.1.1. Packaging
- 11.1.2. Testing
- 11.2. Market Analysis, Insights and Forecast - by Type of Packaging
- 11.2.1. Ball Grid Array (BGA) Packaging
- 11.2.2. Chip Scale Packaging (CSP)
- 11.2.3. Stacked Die Packaging
- 11.2.4. Multi Chip Packaging
- 11.2.5. Quad Flat and Dual-inline Packaging
- 11.3. Market Analysis, Insights and Forecast - by Application
- 11.3.1. Communication
- 11.3.2. Consumer Electronics
- 11.3.3. Automotive
- 11.3.4. Computing and Networking
- 11.3.5. Industrial
- 11.3.6. Other Applications
- 11.1. Market Analysis, Insights and Forecast - by Service Type
- 12. Japan OSAT Market Analysis, Insights and Forecast, 2019-2031
- 12.1. Market Analysis, Insights and Forecast - by Service Type
- 12.1.1. Packaging
- 12.1.2. Testing
- 12.2. Market Analysis, Insights and Forecast - by Type of Packaging
- 12.2.1. Ball Grid Array (BGA) Packaging
- 12.2.2. Chip Scale Packaging (CSP)
- 12.2.3. Stacked Die Packaging
- 12.2.4. Multi Chip Packaging
- 12.2.5. Quad Flat and Dual-inline Packaging
- 12.3. Market Analysis, Insights and Forecast - by Application
- 12.3.1. Communication
- 12.3.2. Consumer Electronics
- 12.3.3. Automotive
- 12.3.4. Computing and Networking
- 12.3.5. Industrial
- 12.3.6. Other Applications
- 12.1. Market Analysis, Insights and Forecast - by Service Type
- 13. North America OSAT Market Analysis, Insights and Forecast, 2019-2031
- 13.1. Market Analysis, Insights and Forecast - By Country/Sub-region
- 13.1.1 United States
- 13.1.2 Canada
- 13.1.3 Mexico
- 14. Europe OSAT Market Analysis, Insights and Forecast, 2019-2031
- 14.1. Market Analysis, Insights and Forecast - By Country/Sub-region
- 14.1.1 Germany
- 14.1.2 United Kingdom
- 14.1.3 France
- 14.1.4 Spain
- 14.1.5 Italy
- 14.1.6 Spain
- 14.1.7 Belgium
- 14.1.8 Netherland
- 14.1.9 Nordics
- 14.1.10 Rest of Europe
- 15. Asia Pacific OSAT Market Analysis, Insights and Forecast, 2019-2031
- 15.1. Market Analysis, Insights and Forecast - By Country/Sub-region
- 15.1.1 China
- 15.1.2 Japan
- 15.1.3 India
- 15.1.4 South Korea
- 15.1.5 Southeast Asia
- 15.1.6 Australia
- 15.1.7 Indonesia
- 15.1.8 Phillipes
- 15.1.9 Singapore
- 15.1.10 Thailandc
- 15.1.11 Rest of Asia Pacific
- 16. South America OSAT Market Analysis, Insights and Forecast, 2019-2031
- 16.1. Market Analysis, Insights and Forecast - By Country/Sub-region
- 16.1.1 Brazil
- 16.1.2 Argentina
- 16.1.3 Peru
- 16.1.4 Chile
- 16.1.5 Colombia
- 16.1.6 Ecuador
- 16.1.7 Venezuela
- 16.1.8 Rest of South America
- 17. North America OSAT Market Analysis, Insights and Forecast, 2019-2031
- 17.1. Market Analysis, Insights and Forecast - By Country/Sub-region
- 17.1.1 United States
- 17.1.2 Canada
- 17.1.3 Mexico
- 18. MEA OSAT Market Analysis, Insights and Forecast, 2019-2031
- 18.1. Market Analysis, Insights and Forecast - By Country/Sub-region
- 18.1.1 United Arab Emirates
- 18.1.2 Saudi Arabia
- 18.1.3 South Africa
- 18.1.4 Rest of Middle East and Africa
- 19. Competitive Analysis
- 19.1. Global Market Share Analysis 2024
- 19.2. Company Profiles
- 19.2.1 Integrated Micro-electronics Inc
- 19.2.1.1. Overview
- 19.2.1.2. Products
- 19.2.1.3. SWOT Analysis
- 19.2.1.4. Recent Developments
- 19.2.1.5. Financials (Based on Availability)
- 19.2.2 Hana Micron Inc
- 19.2.2.1. Overview
- 19.2.2.2. Products
- 19.2.2.3. SWOT Analysis
- 19.2.2.4. Recent Developments
- 19.2.2.5. Financials (Based on Availability)
- 19.2.3 ASE Technology Holding Co Ltd
- 19.2.3.1. Overview
- 19.2.3.2. Products
- 19.2.3.3. SWOT Analysis
- 19.2.3.4. Recent Developments
- 19.2.3.5. Financials (Based on Availability)
- 19.2.4 King Yuan Electronics Co Ltd
- 19.2.4.1. Overview
- 19.2.4.2. Products
- 19.2.4.3. SWOT Analysis
- 19.2.4.4. Recent Developments
- 19.2.4.5. Financials (Based on Availability)
- 19.2.5 Tongfu Microelectronics Co
- 19.2.5.1. Overview
- 19.2.5.2. Products
- 19.2.5.3. SWOT Analysis
- 19.2.5.4. Recent Developments
- 19.2.5.5. Financials (Based on Availability)
- 19.2.6 Jiangsu Changjiang Electronics Technology Co Ltd
- 19.2.6.1. Overview
- 19.2.6.2. Products
- 19.2.6.3. SWOT Analysis
- 19.2.6.4. Recent Developments
- 19.2.6.5. Financials (Based on Availability)
- 19.2.7 Formosa Advanced Technologies Co Ltd
- 19.2.7.1. Overview
- 19.2.7.2. Products
- 19.2.7.3. SWOT Analysis
- 19.2.7.4. Recent Developments
- 19.2.7.5. Financials (Based on Availability)
- 19.2.8 Chipbond Technology Corporation
- 19.2.8.1. Overview
- 19.2.8.2. Products
- 19.2.8.3. SWOT Analysis
- 19.2.8.4. Recent Developments
- 19.2.8.5. Financials (Based on Availability)
- 19.2.9 Powertech Technology Inc
- 19.2.9.1. Overview
- 19.2.9.2. Products
- 19.2.9.3. SWOT Analysis
- 19.2.9.4. Recent Developments
- 19.2.9.5. Financials (Based on Availability)
- 19.2.10 Tianshui Huatian Technology Co Ltd7 2 Vendor Share Analysi
- 19.2.10.1. Overview
- 19.2.10.2. Products
- 19.2.10.3. SWOT Analysis
- 19.2.10.4. Recent Developments
- 19.2.10.5. Financials (Based on Availability)
- 19.2.11 Lingsen Precision Industries Ltd
- 19.2.11.1. Overview
- 19.2.11.2. Products
- 19.2.11.3. SWOT Analysis
- 19.2.11.4. Recent Developments
- 19.2.11.5. Financials (Based on Availability)
- 19.2.12 Amkor Technology Inc
- 19.2.12.1. Overview
- 19.2.12.2. Products
- 19.2.12.3. SWOT Analysis
- 19.2.12.4. Recent Developments
- 19.2.12.5. Financials (Based on Availability)
- 19.2.13 UTAC Holdings Ltd
- 19.2.13.1. Overview
- 19.2.13.2. Products
- 19.2.13.3. SWOT Analysis
- 19.2.13.4. Recent Developments
- 19.2.13.5. Financials (Based on Availability)
- 19.2.14 ChipMOS Technologies Inc
- 19.2.14.1. Overview
- 19.2.14.2. Products
- 19.2.14.3. SWOT Analysis
- 19.2.14.4. Recent Developments
- 19.2.14.5. Financials (Based on Availability)
- 19.2.1 Integrated Micro-electronics Inc
List of Figures
- Figure 1: Global OSAT Market Revenue Breakdown (Million, %) by Region 2024 & 2032
- Figure 2: Global OSAT Market Volume Breakdown (K Unit, %) by Region 2024 & 2032
- Figure 3: North America OSAT Market Revenue (Million), by Country 2024 & 2032
- Figure 4: North America OSAT Market Volume (K Unit), by Country 2024 & 2032
- Figure 5: North America OSAT Market Revenue Share (%), by Country 2024 & 2032
- Figure 6: North America OSAT Market Volume Share (%), by Country 2024 & 2032
- Figure 7: Europe OSAT Market Revenue (Million), by Country 2024 & 2032
- Figure 8: Europe OSAT Market Volume (K Unit), by Country 2024 & 2032
- Figure 9: Europe OSAT Market Revenue Share (%), by Country 2024 & 2032
- Figure 10: Europe OSAT Market Volume Share (%), by Country 2024 & 2032
- Figure 11: Asia Pacific OSAT Market Revenue (Million), by Country 2024 & 2032
- Figure 12: Asia Pacific OSAT Market Volume (K Unit), by Country 2024 & 2032
- Figure 13: Asia Pacific OSAT Market Revenue Share (%), by Country 2024 & 2032
- Figure 14: Asia Pacific OSAT Market Volume Share (%), by Country 2024 & 2032
- Figure 15: South America OSAT Market Revenue (Million), by Country 2024 & 2032
- Figure 16: South America OSAT Market Volume (K Unit), by Country 2024 & 2032
- Figure 17: South America OSAT Market Revenue Share (%), by Country 2024 & 2032
- Figure 18: South America OSAT Market Volume Share (%), by Country 2024 & 2032
- Figure 19: North America OSAT Market Revenue (Million), by Country 2024 & 2032
- Figure 20: North America OSAT Market Volume (K Unit), by Country 2024 & 2032
- Figure 21: North America OSAT Market Revenue Share (%), by Country 2024 & 2032
- Figure 22: North America OSAT Market Volume Share (%), by Country 2024 & 2032
- Figure 23: MEA OSAT Market Revenue (Million), by Country 2024 & 2032
- Figure 24: MEA OSAT Market Volume (K Unit), by Country 2024 & 2032
- Figure 25: MEA OSAT Market Revenue Share (%), by Country 2024 & 2032
- Figure 26: MEA OSAT Market Volume Share (%), by Country 2024 & 2032
- Figure 27: United States OSAT Market Revenue (Million), by Service Type 2024 & 2032
- Figure 28: United States OSAT Market Volume (K Unit), by Service Type 2024 & 2032
- Figure 29: United States OSAT Market Revenue Share (%), by Service Type 2024 & 2032
- Figure 30: United States OSAT Market Volume Share (%), by Service Type 2024 & 2032
- Figure 31: United States OSAT Market Revenue (Million), by Type of Packaging 2024 & 2032
- Figure 32: United States OSAT Market Volume (K Unit), by Type of Packaging 2024 & 2032
- Figure 33: United States OSAT Market Revenue Share (%), by Type of Packaging 2024 & 2032
- Figure 34: United States OSAT Market Volume Share (%), by Type of Packaging 2024 & 2032
- Figure 35: United States OSAT Market Revenue (Million), by Application 2024 & 2032
- Figure 36: United States OSAT Market Volume (K Unit), by Application 2024 & 2032
- Figure 37: United States OSAT Market Revenue Share (%), by Application 2024 & 2032
- Figure 38: United States OSAT Market Volume Share (%), by Application 2024 & 2032
- Figure 39: United States OSAT Market Revenue (Million), by Country 2024 & 2032
- Figure 40: United States OSAT Market Volume (K Unit), by Country 2024 & 2032
- Figure 41: United States OSAT Market Revenue Share (%), by Country 2024 & 2032
- Figure 42: United States OSAT Market Volume Share (%), by Country 2024 & 2032
- Figure 43: China OSAT Market Revenue (Million), by Service Type 2024 & 2032
- Figure 44: China OSAT Market Volume (K Unit), by Service Type 2024 & 2032
- Figure 45: China OSAT Market Revenue Share (%), by Service Type 2024 & 2032
- Figure 46: China OSAT Market Volume Share (%), by Service Type 2024 & 2032
- Figure 47: China OSAT Market Revenue (Million), by Type of Packaging 2024 & 2032
- Figure 48: China OSAT Market Volume (K Unit), by Type of Packaging 2024 & 2032
- Figure 49: China OSAT Market Revenue Share (%), by Type of Packaging 2024 & 2032
- Figure 50: China OSAT Market Volume Share (%), by Type of Packaging 2024 & 2032
- Figure 51: China OSAT Market Revenue (Million), by Application 2024 & 2032
- Figure 52: China OSAT Market Volume (K Unit), by Application 2024 & 2032
- Figure 53: China OSAT Market Revenue Share (%), by Application 2024 & 2032
- Figure 54: China OSAT Market Volume Share (%), by Application 2024 & 2032
- Figure 55: China OSAT Market Revenue (Million), by Country 2024 & 2032
- Figure 56: China OSAT Market Volume (K Unit), by Country 2024 & 2032
- Figure 57: China OSAT Market Revenue Share (%), by Country 2024 & 2032
- Figure 58: China OSAT Market Volume Share (%), by Country 2024 & 2032
- Figure 59: Taiwan OSAT Market Revenue (Million), by Service Type 2024 & 2032
- Figure 60: Taiwan OSAT Market Volume (K Unit), by Service Type 2024 & 2032
- Figure 61: Taiwan OSAT Market Revenue Share (%), by Service Type 2024 & 2032
- Figure 62: Taiwan OSAT Market Volume Share (%), by Service Type 2024 & 2032
- Figure 63: Taiwan OSAT Market Revenue (Million), by Type of Packaging 2024 & 2032
- Figure 64: Taiwan OSAT Market Volume (K Unit), by Type of Packaging 2024 & 2032
- Figure 65: Taiwan OSAT Market Revenue Share (%), by Type of Packaging 2024 & 2032
- Figure 66: Taiwan OSAT Market Volume Share (%), by Type of Packaging 2024 & 2032
- Figure 67: Taiwan OSAT Market Revenue (Million), by Application 2024 & 2032
- Figure 68: Taiwan OSAT Market Volume (K Unit), by Application 2024 & 2032
- Figure 69: Taiwan OSAT Market Revenue Share (%), by Application 2024 & 2032
- Figure 70: Taiwan OSAT Market Volume Share (%), by Application 2024 & 2032
- Figure 71: Taiwan OSAT Market Revenue (Million), by Country 2024 & 2032
- Figure 72: Taiwan OSAT Market Volume (K Unit), by Country 2024 & 2032
- Figure 73: Taiwan OSAT Market Revenue Share (%), by Country 2024 & 2032
- Figure 74: Taiwan OSAT Market Volume Share (%), by Country 2024 & 2032
- Figure 75: South Korea OSAT Market Revenue (Million), by Service Type 2024 & 2032
- Figure 76: South Korea OSAT Market Volume (K Unit), by Service Type 2024 & 2032
- Figure 77: South Korea OSAT Market Revenue Share (%), by Service Type 2024 & 2032
- Figure 78: South Korea OSAT Market Volume Share (%), by Service Type 2024 & 2032
- Figure 79: South Korea OSAT Market Revenue (Million), by Type of Packaging 2024 & 2032
- Figure 80: South Korea OSAT Market Volume (K Unit), by Type of Packaging 2024 & 2032
- Figure 81: South Korea OSAT Market Revenue Share (%), by Type of Packaging 2024 & 2032
- Figure 82: South Korea OSAT Market Volume Share (%), by Type of Packaging 2024 & 2032
- Figure 83: South Korea OSAT Market Revenue (Million), by Application 2024 & 2032
- Figure 84: South Korea OSAT Market Volume (K Unit), by Application 2024 & 2032
- Figure 85: South Korea OSAT Market Revenue Share (%), by Application 2024 & 2032
- Figure 86: South Korea OSAT Market Volume Share (%), by Application 2024 & 2032
- Figure 87: South Korea OSAT Market Revenue (Million), by Country 2024 & 2032
- Figure 88: South Korea OSAT Market Volume (K Unit), by Country 2024 & 2032
- Figure 89: South Korea OSAT Market Revenue Share (%), by Country 2024 & 2032
- Figure 90: South Korea OSAT Market Volume Share (%), by Country 2024 & 2032
- Figure 91: Malaysia OSAT Market Revenue (Million), by Service Type 2024 & 2032
- Figure 92: Malaysia OSAT Market Volume (K Unit), by Service Type 2024 & 2032
- Figure 93: Malaysia OSAT Market Revenue Share (%), by Service Type 2024 & 2032
- Figure 94: Malaysia OSAT Market Volume Share (%), by Service Type 2024 & 2032
- Figure 95: Malaysia OSAT Market Revenue (Million), by Type of Packaging 2024 & 2032
- Figure 96: Malaysia OSAT Market Volume (K Unit), by Type of Packaging 2024 & 2032
- Figure 97: Malaysia OSAT Market Revenue Share (%), by Type of Packaging 2024 & 2032
- Figure 98: Malaysia OSAT Market Volume Share (%), by Type of Packaging 2024 & 2032
- Figure 99: Malaysia OSAT Market Revenue (Million), by Application 2024 & 2032
- Figure 100: Malaysia OSAT Market Volume (K Unit), by Application 2024 & 2032
- Figure 101: Malaysia OSAT Market Revenue Share (%), by Application 2024 & 2032
- Figure 102: Malaysia OSAT Market Volume Share (%), by Application 2024 & 2032
- Figure 103: Malaysia OSAT Market Revenue (Million), by Country 2024 & 2032
- Figure 104: Malaysia OSAT Market Volume (K Unit), by Country 2024 & 2032
- Figure 105: Malaysia OSAT Market Revenue Share (%), by Country 2024 & 2032
- Figure 106: Malaysia OSAT Market Volume Share (%), by Country 2024 & 2032
- Figure 107: Singapore OSAT Market Revenue (Million), by Service Type 2024 & 2032
- Figure 108: Singapore OSAT Market Volume (K Unit), by Service Type 2024 & 2032
- Figure 109: Singapore OSAT Market Revenue Share (%), by Service Type 2024 & 2032
- Figure 110: Singapore OSAT Market Volume Share (%), by Service Type 2024 & 2032
- Figure 111: Singapore OSAT Market Revenue (Million), by Type of Packaging 2024 & 2032
- Figure 112: Singapore OSAT Market Volume (K Unit), by Type of Packaging 2024 & 2032
- Figure 113: Singapore OSAT Market Revenue Share (%), by Type of Packaging 2024 & 2032
- Figure 114: Singapore OSAT Market Volume Share (%), by Type of Packaging 2024 & 2032
- Figure 115: Singapore OSAT Market Revenue (Million), by Application 2024 & 2032
- Figure 116: Singapore OSAT Market Volume (K Unit), by Application 2024 & 2032
- Figure 117: Singapore OSAT Market Revenue Share (%), by Application 2024 & 2032
- Figure 118: Singapore OSAT Market Volume Share (%), by Application 2024 & 2032
- Figure 119: Singapore OSAT Market Revenue (Million), by Country 2024 & 2032
- Figure 120: Singapore OSAT Market Volume (K Unit), by Country 2024 & 2032
- Figure 121: Singapore OSAT Market Revenue Share (%), by Country 2024 & 2032
- Figure 122: Singapore OSAT Market Volume Share (%), by Country 2024 & 2032
- Figure 123: Japan OSAT Market Revenue (Million), by Service Type 2024 & 2032
- Figure 124: Japan OSAT Market Volume (K Unit), by Service Type 2024 & 2032
- Figure 125: Japan OSAT Market Revenue Share (%), by Service Type 2024 & 2032
- Figure 126: Japan OSAT Market Volume Share (%), by Service Type 2024 & 2032
- Figure 127: Japan OSAT Market Revenue (Million), by Type of Packaging 2024 & 2032
- Figure 128: Japan OSAT Market Volume (K Unit), by Type of Packaging 2024 & 2032
- Figure 129: Japan OSAT Market Revenue Share (%), by Type of Packaging 2024 & 2032
- Figure 130: Japan OSAT Market Volume Share (%), by Type of Packaging 2024 & 2032
- Figure 131: Japan OSAT Market Revenue (Million), by Application 2024 & 2032
- Figure 132: Japan OSAT Market Volume (K Unit), by Application 2024 & 2032
- Figure 133: Japan OSAT Market Revenue Share (%), by Application 2024 & 2032
- Figure 134: Japan OSAT Market Volume Share (%), by Application 2024 & 2032
- Figure 135: Japan OSAT Market Revenue (Million), by Country 2024 & 2032
- Figure 136: Japan OSAT Market Volume (K Unit), by Country 2024 & 2032
- Figure 137: Japan OSAT Market Revenue Share (%), by Country 2024 & 2032
- Figure 138: Japan OSAT Market Volume Share (%), by Country 2024 & 2032
List of Tables
- Table 1: Global OSAT Market Revenue Million Forecast, by Region 2019 & 2032
- Table 2: Global OSAT Market Volume K Unit Forecast, by Region 2019 & 2032
- Table 3: Global OSAT Market Revenue Million Forecast, by Service Type 2019 & 2032
- Table 4: Global OSAT Market Volume K Unit Forecast, by Service Type 2019 & 2032
- Table 5: Global OSAT Market Revenue Million Forecast, by Type of Packaging 2019 & 2032
- Table 6: Global OSAT Market Volume K Unit Forecast, by Type of Packaging 2019 & 2032
- Table 7: Global OSAT Market Revenue Million Forecast, by Application 2019 & 2032
- Table 8: Global OSAT Market Volume K Unit Forecast, by Application 2019 & 2032
- Table 9: Global OSAT Market Revenue Million Forecast, by Region 2019 & 2032
- Table 10: Global OSAT Market Volume K Unit Forecast, by Region 2019 & 2032
- Table 11: Global OSAT Market Revenue Million Forecast, by Country 2019 & 2032
- Table 12: Global OSAT Market Volume K Unit Forecast, by Country 2019 & 2032
- Table 13: United States OSAT Market Revenue (Million) Forecast, by Application 2019 & 2032
- Table 14: United States OSAT Market Volume (K Unit) Forecast, by Application 2019 & 2032
- Table 15: Canada OSAT Market Revenue (Million) Forecast, by Application 2019 & 2032
- Table 16: Canada OSAT Market Volume (K Unit) Forecast, by Application 2019 & 2032
- Table 17: Mexico OSAT Market Revenue (Million) Forecast, by Application 2019 & 2032
- Table 18: Mexico OSAT Market Volume (K Unit) Forecast, by Application 2019 & 2032
- Table 19: Global OSAT Market Revenue Million Forecast, by Country 2019 & 2032
- Table 20: Global OSAT Market Volume K Unit Forecast, by Country 2019 & 2032
- Table 21: Germany OSAT Market Revenue (Million) Forecast, by Application 2019 & 2032
- Table 22: Germany OSAT Market Volume (K Unit) Forecast, by Application 2019 & 2032
- Table 23: United Kingdom OSAT Market Revenue (Million) Forecast, by Application 2019 & 2032
- Table 24: United Kingdom OSAT Market Volume (K Unit) Forecast, by Application 2019 & 2032
- Table 25: France OSAT Market Revenue (Million) Forecast, by Application 2019 & 2032
- Table 26: France OSAT Market Volume (K Unit) Forecast, by Application 2019 & 2032
- Table 27: Spain OSAT Market Revenue (Million) Forecast, by Application 2019 & 2032
- Table 28: Spain OSAT Market Volume (K Unit) Forecast, by Application 2019 & 2032
- Table 29: Italy OSAT Market Revenue (Million) Forecast, by Application 2019 & 2032
- Table 30: Italy OSAT Market Volume (K Unit) Forecast, by Application 2019 & 2032
- Table 31: Spain OSAT Market Revenue (Million) Forecast, by Application 2019 & 2032
- Table 32: Spain OSAT Market Volume (K Unit) Forecast, by Application 2019 & 2032
- Table 33: Belgium OSAT Market Revenue (Million) Forecast, by Application 2019 & 2032
- Table 34: Belgium OSAT Market Volume (K Unit) Forecast, by Application 2019 & 2032
- Table 35: Netherland OSAT Market Revenue (Million) Forecast, by Application 2019 & 2032
- Table 36: Netherland OSAT Market Volume (K Unit) Forecast, by Application 2019 & 2032
- Table 37: Nordics OSAT Market Revenue (Million) Forecast, by Application 2019 & 2032
- Table 38: Nordics OSAT Market Volume (K Unit) Forecast, by Application 2019 & 2032
- Table 39: Rest of Europe OSAT Market Revenue (Million) Forecast, by Application 2019 & 2032
- Table 40: Rest of Europe OSAT Market Volume (K Unit) Forecast, by Application 2019 & 2032
- Table 41: Global OSAT Market Revenue Million Forecast, by Country 2019 & 2032
- Table 42: Global OSAT Market Volume K Unit Forecast, by Country 2019 & 2032
- Table 43: China OSAT Market Revenue (Million) Forecast, by Application 2019 & 2032
- Table 44: China OSAT Market Volume (K Unit) Forecast, by Application 2019 & 2032
- Table 45: Japan OSAT Market Revenue (Million) Forecast, by Application 2019 & 2032
- Table 46: Japan OSAT Market Volume (K Unit) Forecast, by Application 2019 & 2032
- Table 47: India OSAT Market Revenue (Million) Forecast, by Application 2019 & 2032
- Table 48: India OSAT Market Volume (K Unit) Forecast, by Application 2019 & 2032
- Table 49: South Korea OSAT Market Revenue (Million) Forecast, by Application 2019 & 2032
- Table 50: South Korea OSAT Market Volume (K Unit) Forecast, by Application 2019 & 2032
- Table 51: Southeast Asia OSAT Market Revenue (Million) Forecast, by Application 2019 & 2032
- Table 52: Southeast Asia OSAT Market Volume (K Unit) Forecast, by Application 2019 & 2032
- Table 53: Australia OSAT Market Revenue (Million) Forecast, by Application 2019 & 2032
- Table 54: Australia OSAT Market Volume (K Unit) Forecast, by Application 2019 & 2032
- Table 55: Indonesia OSAT Market Revenue (Million) Forecast, by Application 2019 & 2032
- Table 56: Indonesia OSAT Market Volume (K Unit) Forecast, by Application 2019 & 2032
- Table 57: Phillipes OSAT Market Revenue (Million) Forecast, by Application 2019 & 2032
- Table 58: Phillipes OSAT Market Volume (K Unit) Forecast, by Application 2019 & 2032
- Table 59: Singapore OSAT Market Revenue (Million) Forecast, by Application 2019 & 2032
- Table 60: Singapore OSAT Market Volume (K Unit) Forecast, by Application 2019 & 2032
- Table 61: Thailandc OSAT Market Revenue (Million) Forecast, by Application 2019 & 2032
- Table 62: Thailandc OSAT Market Volume (K Unit) Forecast, by Application 2019 & 2032
- Table 63: Rest of Asia Pacific OSAT Market Revenue (Million) Forecast, by Application 2019 & 2032
- Table 64: Rest of Asia Pacific OSAT Market Volume (K Unit) Forecast, by Application 2019 & 2032
- Table 65: Global OSAT Market Revenue Million Forecast, by Country 2019 & 2032
- Table 66: Global OSAT Market Volume K Unit Forecast, by Country 2019 & 2032
- Table 67: Brazil OSAT Market Revenue (Million) Forecast, by Application 2019 & 2032
- Table 68: Brazil OSAT Market Volume (K Unit) Forecast, by Application 2019 & 2032
- Table 69: Argentina OSAT Market Revenue (Million) Forecast, by Application 2019 & 2032
- Table 70: Argentina OSAT Market Volume (K Unit) Forecast, by Application 2019 & 2032
- Table 71: Peru OSAT Market Revenue (Million) Forecast, by Application 2019 & 2032
- Table 72: Peru OSAT Market Volume (K Unit) Forecast, by Application 2019 & 2032
- Table 73: Chile OSAT Market Revenue (Million) Forecast, by Application 2019 & 2032
- Table 74: Chile OSAT Market Volume (K Unit) Forecast, by Application 2019 & 2032
- Table 75: Colombia OSAT Market Revenue (Million) Forecast, by Application 2019 & 2032
- Table 76: Colombia OSAT Market Volume (K Unit) Forecast, by Application 2019 & 2032
- Table 77: Ecuador OSAT Market Revenue (Million) Forecast, by Application 2019 & 2032
- Table 78: Ecuador OSAT Market Volume (K Unit) Forecast, by Application 2019 & 2032
- Table 79: Venezuela OSAT Market Revenue (Million) Forecast, by Application 2019 & 2032
- Table 80: Venezuela OSAT Market Volume (K Unit) Forecast, by Application 2019 & 2032
- Table 81: Rest of South America OSAT Market Revenue (Million) Forecast, by Application 2019 & 2032
- Table 82: Rest of South America OSAT Market Volume (K Unit) Forecast, by Application 2019 & 2032
- Table 83: Global OSAT Market Revenue Million Forecast, by Country 2019 & 2032
- Table 84: Global OSAT Market Volume K Unit Forecast, by Country 2019 & 2032
- Table 85: United States OSAT Market Revenue (Million) Forecast, by Application 2019 & 2032
- Table 86: United States OSAT Market Volume (K Unit) Forecast, by Application 2019 & 2032
- Table 87: Canada OSAT Market Revenue (Million) Forecast, by Application 2019 & 2032
- Table 88: Canada OSAT Market Volume (K Unit) Forecast, by Application 2019 & 2032
- Table 89: Mexico OSAT Market Revenue (Million) Forecast, by Application 2019 & 2032
- Table 90: Mexico OSAT Market Volume (K Unit) Forecast, by Application 2019 & 2032
- Table 91: Global OSAT Market Revenue Million Forecast, by Country 2019 & 2032
- Table 92: Global OSAT Market Volume K Unit Forecast, by Country 2019 & 2032
- Table 93: United Arab Emirates OSAT Market Revenue (Million) Forecast, by Application 2019 & 2032
- Table 94: United Arab Emirates OSAT Market Volume (K Unit) Forecast, by Application 2019 & 2032
- Table 95: Saudi Arabia OSAT Market Revenue (Million) Forecast, by Application 2019 & 2032
- Table 96: Saudi Arabia OSAT Market Volume (K Unit) Forecast, by Application 2019 & 2032
- Table 97: South Africa OSAT Market Revenue (Million) Forecast, by Application 2019 & 2032
- Table 98: South Africa OSAT Market Volume (K Unit) Forecast, by Application 2019 & 2032
- Table 99: Rest of Middle East and Africa OSAT Market Revenue (Million) Forecast, by Application 2019 & 2032
- Table 100: Rest of Middle East and Africa OSAT Market Volume (K Unit) Forecast, by Application 2019 & 2032
- Table 101: Global OSAT Market Revenue Million Forecast, by Service Type 2019 & 2032
- Table 102: Global OSAT Market Volume K Unit Forecast, by Service Type 2019 & 2032
- Table 103: Global OSAT Market Revenue Million Forecast, by Type of Packaging 2019 & 2032
- Table 104: Global OSAT Market Volume K Unit Forecast, by Type of Packaging 2019 & 2032
- Table 105: Global OSAT Market Revenue Million Forecast, by Application 2019 & 2032
- Table 106: Global OSAT Market Volume K Unit Forecast, by Application 2019 & 2032
- Table 107: Global OSAT Market Revenue Million Forecast, by Country 2019 & 2032
- Table 108: Global OSAT Market Volume K Unit Forecast, by Country 2019 & 2032
- Table 109: Global OSAT Market Revenue Million Forecast, by Service Type 2019 & 2032
- Table 110: Global OSAT Market Volume K Unit Forecast, by Service Type 2019 & 2032
- Table 111: Global OSAT Market Revenue Million Forecast, by Type of Packaging 2019 & 2032
- Table 112: Global OSAT Market Volume K Unit Forecast, by Type of Packaging 2019 & 2032
- Table 113: Global OSAT Market Revenue Million Forecast, by Application 2019 & 2032
- Table 114: Global OSAT Market Volume K Unit Forecast, by Application 2019 & 2032
- Table 115: Global OSAT Market Revenue Million Forecast, by Country 2019 & 2032
- Table 116: Global OSAT Market Volume K Unit Forecast, by Country 2019 & 2032
- Table 117: Global OSAT Market Revenue Million Forecast, by Service Type 2019 & 2032
- Table 118: Global OSAT Market Volume K Unit Forecast, by Service Type 2019 & 2032
- Table 119: Global OSAT Market Revenue Million Forecast, by Type of Packaging 2019 & 2032
- Table 120: Global OSAT Market Volume K Unit Forecast, by Type of Packaging 2019 & 2032
- Table 121: Global OSAT Market Revenue Million Forecast, by Application 2019 & 2032
- Table 122: Global OSAT Market Volume K Unit Forecast, by Application 2019 & 2032
- Table 123: Global OSAT Market Revenue Million Forecast, by Country 2019 & 2032
- Table 124: Global OSAT Market Volume K Unit Forecast, by Country 2019 & 2032
- Table 125: Global OSAT Market Revenue Million Forecast, by Service Type 2019 & 2032
- Table 126: Global OSAT Market Volume K Unit Forecast, by Service Type 2019 & 2032
- Table 127: Global OSAT Market Revenue Million Forecast, by Type of Packaging 2019 & 2032
- Table 128: Global OSAT Market Volume K Unit Forecast, by Type of Packaging 2019 & 2032
- Table 129: Global OSAT Market Revenue Million Forecast, by Application 2019 & 2032
- Table 130: Global OSAT Market Volume K Unit Forecast, by Application 2019 & 2032
- Table 131: Global OSAT Market Revenue Million Forecast, by Country 2019 & 2032
- Table 132: Global OSAT Market Volume K Unit Forecast, by Country 2019 & 2032
- Table 133: Global OSAT Market Revenue Million Forecast, by Service Type 2019 & 2032
- Table 134: Global OSAT Market Volume K Unit Forecast, by Service Type 2019 & 2032
- Table 135: Global OSAT Market Revenue Million Forecast, by Type of Packaging 2019 & 2032
- Table 136: Global OSAT Market Volume K Unit Forecast, by Type of Packaging 2019 & 2032
- Table 137: Global OSAT Market Revenue Million Forecast, by Application 2019 & 2032
- Table 138: Global OSAT Market Volume K Unit Forecast, by Application 2019 & 2032
- Table 139: Global OSAT Market Revenue Million Forecast, by Country 2019 & 2032
- Table 140: Global OSAT Market Volume K Unit Forecast, by Country 2019 & 2032
- Table 141: Global OSAT Market Revenue Million Forecast, by Service Type 2019 & 2032
- Table 142: Global OSAT Market Volume K Unit Forecast, by Service Type 2019 & 2032
- Table 143: Global OSAT Market Revenue Million Forecast, by Type of Packaging 2019 & 2032
- Table 144: Global OSAT Market Volume K Unit Forecast, by Type of Packaging 2019 & 2032
- Table 145: Global OSAT Market Revenue Million Forecast, by Application 2019 & 2032
- Table 146: Global OSAT Market Volume K Unit Forecast, by Application 2019 & 2032
- Table 147: Global OSAT Market Revenue Million Forecast, by Country 2019 & 2032
- Table 148: Global OSAT Market Volume K Unit Forecast, by Country 2019 & 2032
- Table 149: Global OSAT Market Revenue Million Forecast, by Service Type 2019 & 2032
- Table 150: Global OSAT Market Volume K Unit Forecast, by Service Type 2019 & 2032
- Table 151: Global OSAT Market Revenue Million Forecast, by Type of Packaging 2019 & 2032
- Table 152: Global OSAT Market Volume K Unit Forecast, by Type of Packaging 2019 & 2032
- Table 153: Global OSAT Market Revenue Million Forecast, by Application 2019 & 2032
- Table 154: Global OSAT Market Volume K Unit Forecast, by Application 2019 & 2032
- Table 155: Global OSAT Market Revenue Million Forecast, by Country 2019 & 2032
- Table 156: Global OSAT Market Volume K Unit Forecast, by Country 2019 & 2032
Frequently Asked Questions
1. What is the projected Compound Annual Growth Rate (CAGR) of the OSAT Market?
The projected CAGR is approximately 8.62%.
2. Which companies are prominent players in the OSAT Market?
Key companies in the market include Integrated Micro-electronics Inc, Hana Micron Inc, ASE Technology Holding Co Ltd, King Yuan Electronics Co Ltd, Tongfu Microelectronics Co, Jiangsu Changjiang Electronics Technology Co Ltd, Formosa Advanced Technologies Co Ltd, Chipbond Technology Corporation, Powertech Technology Inc, Tianshui Huatian Technology Co Ltd7 2 Vendor Share Analysi, Lingsen Precision Industries Ltd, Amkor Technology Inc, UTAC Holdings Ltd, ChipMOS Technologies Inc.
3. What are the main segments of the OSAT Market?
The market segments include Service Type, Type of Packaging, Application.
4. Can you provide details about the market size?
The market size is estimated to be USD 43.36 Million as of 2022.
5. What are some drivers contributing to market growth?
Increased Applications of Semiconductors in Automotive; Advancement in Semiconductor Packaging Due to Trends like 5G.
6. What are the notable trends driving market growth?
Communication to be the Largest Application Segment.
7. Are there any restraints impacting market growth?
Vertical Integration is One of the Significant Concerns of OSAT Players.
8. Can you provide examples of recent developments in the market?
December 2023 - Sahasra Electronics, a Noida-based company, revealed its intention to allocate approximately INR 350 crore (USD 42.2 million) over the next three years. The investment will be directed toward establishing a semiconductor packaging facility and expanding manufacturing operations as part of the 'Make in India' initiative. The company plans to acquire electronic assembly machines, resulting in an investment exceeding INR 150 crore (USD 18.1 million) for the plant, while an additional INR 50 crore (USD 6 million) will be dedicated to the interior of the building. Such investments in boosting the semiconductor packaging and assembly services are expected to increase the market’s potential.
9. What pricing options are available for accessing the report?
Pricing options include single-user, multi-user, and enterprise licenses priced at USD 4750, USD 5250, and USD 8750 respectively.
10. Is the market size provided in terms of value or volume?
The market size is provided in terms of value, measured in Million and volume, measured in K Unit.
11. Are there any specific market keywords associated with the report?
Yes, the market keyword associated with the report is "OSAT Market," which aids in identifying and referencing the specific market segment covered.
12. How do I determine which pricing option suits my needs best?
The pricing options vary based on user requirements and access needs. Individual users may opt for single-user licenses, while businesses requiring broader access may choose multi-user or enterprise licenses for cost-effective access to the report.
13. Are there any additional resources or data provided in the OSAT Market report?
While the report offers comprehensive insights, it's advisable to review the specific contents or supplementary materials provided to ascertain if additional resources or data are available.
14. How can I stay updated on further developments or reports in the OSAT Market?
To stay informed about further developments, trends, and reports in the OSAT Market, consider subscribing to industry newsletters, following relevant companies and organizations, or regularly checking reputable industry news sources and publications.
Methodology
Step 1 - Identification of Relevant Samples Size from Population Database


Step 2 - Approaches for Defining Global Market Size (Value, Volume* & Price*)

Note*: In applicable scenarios
Step 3 - Data Sources
Primary Research
- Web Analytics
- Survey Reports
- Research Institute
- Latest Research Reports
- Opinion Leaders
Secondary Research
- Annual Reports
- White Paper
- Latest Press Release
- Industry Association
- Paid Database
- Investor Presentations

Step 4 - Data Triangulation
Involves using different sources of information in order to increase the validity of a study
These sources are likely to be stakeholders in a program - participants, other researchers, program staff, other community members, and so on.
Then we put all data in single framework & apply various statistical tools to find out the dynamic on the market.
During the analysis stage, feedback from the stakeholder groups would be compared to determine areas of agreement as well as areas of divergence


