

Key Insights
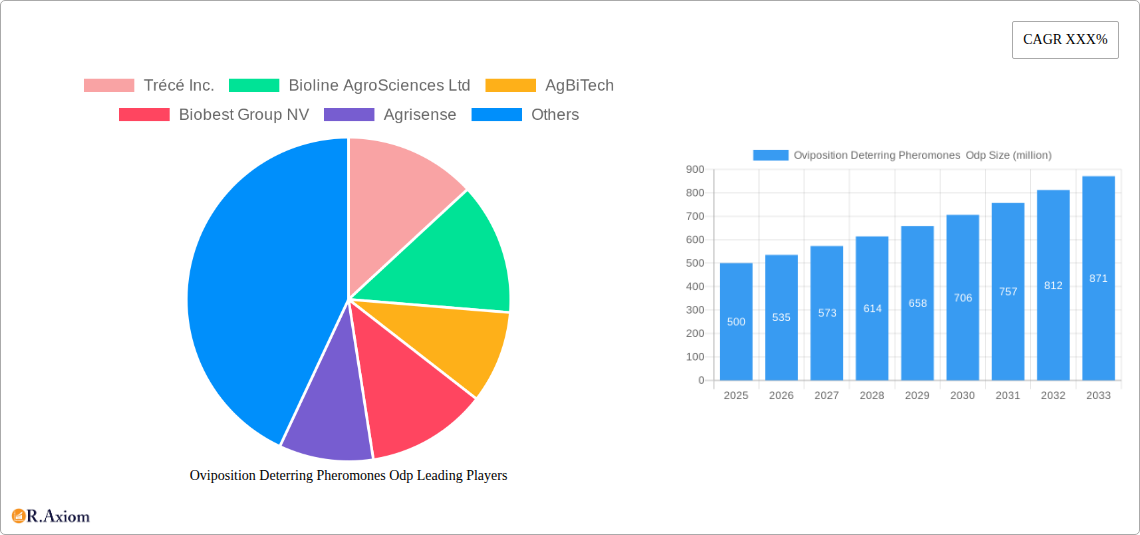
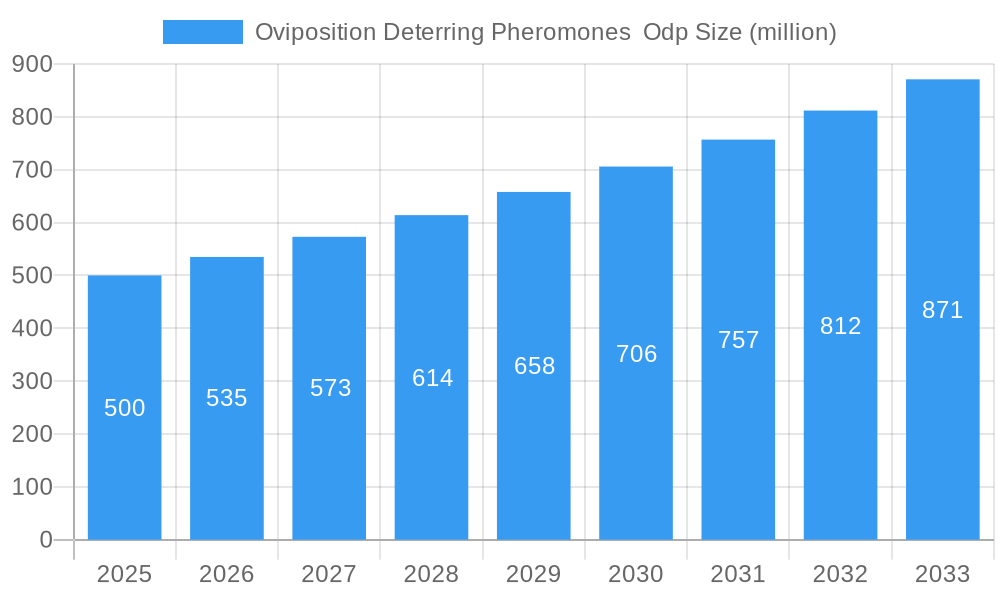
The Oviposition Deterring Pheromones (ODP) market is experiencing robust growth, driven by the increasing demand for eco-friendly pest control solutions in agriculture and horticulture. The global market, estimated at $500 million in 2025, is projected to expand significantly over the forecast period (2025-2033), fueled by a Compound Annual Growth Rate (CAGR) of 7%. This growth is primarily attributed to the rising awareness of the harmful effects of synthetic pesticides and the increasing adoption of integrated pest management (IPM) strategies. Consumers are increasingly demanding pesticide-free produce, pushing farmers and growers to adopt sustainable alternatives like ODPs. Furthermore, stringent government regulations on synthetic pesticides in several regions are creating a favorable environment for the growth of the ODP market. Key players such as Trécé Inc., Bioline AgroSciences Ltd, and BASF are actively contributing to this expansion through continuous innovation and strategic partnerships.
Oviposition Deterring Pheromones Odp Market Size (In Million)
The market segmentation reveals significant opportunities across various crop types and geographical regions. North America and Europe currently dominate the market, but Asia-Pacific is expected to witness substantial growth in the coming years due to the increasing adoption of sustainable agricultural practices and rising awareness of IPM strategies in this region. However, factors like high initial investment costs associated with ODP implementation and the need for specialized application techniques present challenges to wider market adoption. Ongoing research and development efforts focused on improving ODP efficacy and reducing production costs are expected to address these restraints and further stimulate market expansion. The development of novel pheromone blends targeting specific pest species and the expansion of distribution networks will be key factors influencing future growth.
Oviposition Deterring Pheromones Odp Company Market Share
Oviposition Deterring Pheromones (ODP) Market Report: 2019-2033
This comprehensive report provides an in-depth analysis of the global Oviposition Deterring Pheromones (ODP) market, offering a detailed assessment of market dynamics, growth drivers, challenges, and opportunities from 2019 to 2033. The study covers market size and projections, competitive landscape, technological advancements, regulatory frameworks, and key industry trends. With a focus on actionable insights, this report is an invaluable resource for industry stakeholders, investors, and researchers seeking to understand and capitalize on the growth potential within the Oviposition Deterring Pheromone market. The report utilizes data from the historical period (2019-2024), base year (2025), and estimated year (2025), providing a robust forecast for the period 2025-2033.
Oviposition Deterring Pheromones ODP Market Concentration & Innovation
The Oviposition Deterring Pheromones (ODP) market exhibits a moderately consolidated structure, with several key players vying for market share. While precise market share figures for individual companies remain proprietary, the market is estimated to be valued at $XX million in 2025. Trécé Inc., Bioline AgroSciences Ltd, and Syngenta Crop Protection AG are among the leading players, holding a combined estimated market share of approximately 35% in 2025. Innovation in the ODP market is driven by the need for more effective and environmentally friendly pest control solutions. This has led to significant R&D investments in enhancing pheromone formulation, delivery systems, and target specificity. The regulatory landscape, particularly concerning the registration and approval of biopesticides, significantly influences market dynamics. Stringent regulations in some regions can impede market entry and expansion. Furthermore, the development of novel ODP products with improved efficacy and longevity is a key area of focus. Competition in the market is intense, with companies pursuing strategies such as product differentiation, strategic partnerships, and acquisitions to gain a competitive edge. M&A activity in the sector has been moderate, with deal values ranging from $XX million to $XX million in recent years.
- Market Concentration: Moderately Consolidated
- Top 3 Players Estimated Market Share (2025): 35%
- Innovation Drivers: Enhanced efficacy, environmental friendliness, target specificity.
- Regulatory Impact: Stringent regulations in some regions.
- M&A Activity: Moderate, with deal values between $XX million and $XX million.
- Competitive Strategies: Product differentiation, strategic partnerships, acquisitions.
Oviposition Deterring Pheromones ODP Industry Trends & Insights
The global Oviposition Deterring Pheromones (ODP) market is experiencing robust growth, driven by several factors. The increasing global demand for sustainable and eco-friendly pest control solutions is a major catalyst. This aligns with growing consumer awareness of the potential health and environmental risks associated with traditional chemical pesticides. The market is projected to witness a Compound Annual Growth Rate (CAGR) of XX% during the forecast period (2025-2033), reaching an estimated value of $XX million by 2033. Market penetration of ODPs remains relatively low in many regions, indicating substantial untapped potential. Technological advancements, such as the development of more effective pheromone blends and improved delivery systems, are further fueling market expansion. Consumer preference for organically produced crops is bolstering the adoption of ODPs, as they are compatible with integrated pest management (IPM) strategies. The competitive landscape is characterized by intense rivalry among established players and emerging companies, leading to continuous innovation and product improvement.
Dominant Markets & Segments in Oviposition Deterring Pheromones ODP
The North American market currently holds the largest share of the global ODP market, driven by factors such as strong regulatory support for biopesticides, high adoption rates in the agricultural sector, and increased consumer demand for organic produce.
- Key Drivers in North America:
- Strong regulatory support for biopesticides.
- High adoption rates in agriculture.
- Increased consumer demand for organic produce.
- Well-established distribution networks.
- Dominance Analysis: North America's dominance stems from a combination of factors, including a mature agricultural sector, robust regulatory frameworks that favor biopesticides, and a growing consumer preference for sustainably produced food. The region's established distribution networks and the presence of major ODP manufacturers also contribute to its market leadership.
Oviposition Deterring Pheromones ODP Product Developments
Recent product innovations in the ODP market include the development of more potent and longer-lasting pheromone formulations, as well as innovative delivery systems that improve efficacy and reduce environmental impact. These advancements are expanding the application of ODPs across various crops and pest species. Improved dispensers, such as microcapsules and controlled-release devices, are enhancing the longevity and effectiveness of pheromones. The competitive advantage lies in developing products with superior performance, cost-effectiveness, and ease of use. Technological advancements are focusing on improving pheromone stability, optimizing attractant blends, and developing targeted delivery systems.
Report Scope & Segmentation Analysis
This report segments the ODP market based on various factors, including type of pheromone, target pest, crop type, application method, and geography. Each segment offers a unique market opportunity, with varying growth projections and competitive dynamics. Growth rates vary significantly across segments, reflecting differences in adoption rates, pest pressure, and regulatory environments. The market is further segmented geographically, with regional variations in market size and growth trajectory.
Key Drivers of Oviposition Deterring Pheromones ODP Growth
The growth of the Oviposition Deterring Pheromones market is propelled by several key factors: increasing consumer demand for organic and sustainably produced food, stringent regulations against harmful chemical pesticides, a growing awareness of the environmental impact of conventional pest control methods, and continuous innovation in pheromone technology leading to improved product efficacy and cost-effectiveness. Government initiatives promoting sustainable agriculture and biopesticide adoption are also significant contributors.
Challenges in the Oviposition Deterring Pheromones ODP Sector
The Oviposition Deterring Pheromones market faces certain challenges, including the high cost of R&D and production, potential for resistance development in target pests, regulatory hurdles in certain regions, and inconsistent efficacy across different environmental conditions. The complexity of pheromone synthesis and the need for precise formulation can also hinder market expansion.
Emerging Opportunities in Oviposition Deterring Pheromones ODP
The ODP market presents numerous emerging opportunities. Expansion into new geographic markets with high pest pressure, the development of novel pheromone blends targeting specific pests, and the integration of ODPs with other pest management strategies (IPM) offer significant growth potential. Moreover, the increasing adoption of precision agriculture techniques opens doors for targeted ODP applications.
Leading Players in the Oviposition Deterring Pheromones ODP Market
- Trécé Inc.
- Bioline AgroSciences Ltd
- AgBiTech
- Biobest Group NV
- Agrisense
- Laboratorio Agrochem
- Rovensa Next
- Novagrica
- Russell IPM Ltd
- Hercon Environmental
- Syngenta Crop Protection AG
- Semios
- International Pheromone Systems
- Pacific Biocontrol Corporation
- Shin-Etsu Chemical Co., Ltd.
- BASF
- Koppert
- Andermatt Group AG
Key Developments in Oviposition Deterring Pheromones ODP Industry
- 2022: Trécé Inc. launched a new line of ODP products for fruit orchards.
- 2023: Bioline AgroSciences Ltd. secured a significant investment for R&D in advanced pheromone formulations.
- 2024: Syngenta Crop Protection AG acquired a smaller ODP company, expanding its product portfolio.
- (Further developments will be detailed within the full report.)
Strategic Outlook for Oviposition Deterring Pheromones ODP Market
The future of the Oviposition Deterring Pheromones market is promising, driven by sustained growth in demand for sustainable pest control solutions, ongoing technological advancements, and supportive government policies. The market is poised for significant expansion, particularly in developing countries with high agricultural output and growing awareness of sustainable practices. The focus on product innovation, strategic partnerships, and market diversification will be key for companies seeking to succeed in this dynamic market.
Oviposition Deterring Pheromones Odp Segmentation
-
1. Application
- 1.1. Insect Monitoring
- 1.2. Insect Population Control
- 1.3. Crops Protection
-
2. Type
- 2.1. Traps
- 2.2. Dispensers
- 2.3. Sprays
Oviposition Deterring Pheromones Odp Segmentation By Geography
-
1. North America
- 1.1. United States
- 1.2. Canada
- 1.3. Mexico
-
2. South America
- 2.1. Brazil
- 2.2. Argentina
- 2.3. Rest of South America
-
3. Europe
- 3.1. United Kingdom
- 3.2. Germany
- 3.3. France
- 3.4. Italy
- 3.5. Spain
- 3.6. Russia
- 3.7. Benelux
- 3.8. Nordics
- 3.9. Rest of Europe
-
4. Middle East & Africa
- 4.1. Turkey
- 4.2. Israel
- 4.3. GCC
- 4.4. North Africa
- 4.5. South Africa
- 4.6. Rest of Middle East & Africa
-
5. Asia Pacific
- 5.1. China
- 5.2. India
- 5.3. Japan
- 5.4. South Korea
- 5.5. ASEAN
- 5.6. Oceania
- 5.7. Rest of Asia Pacific

Oviposition Deterring Pheromones Odp Regional Market Share
Geographic Coverage of Oviposition Deterring Pheromones Odp
Oviposition Deterring Pheromones Odp REPORT HIGHLIGHTS
| Aspects | Details |
|---|---|
| Study Period | 2020-2034 |
| Base Year | 2025 |
| Estimated Year | 2026 |
| Forecast Period | 2026-2034 |
| Historical Period | 2020-2025 |
| Growth Rate | CAGR of XXX% from 2020-2034 |
| Segmentation |
|
Table of Contents
- 1. Introduction
- 1.1. Research Scope
- 1.2. Market Segmentation
- 1.3. Research Objective
- 1.4. Definitions and Assumptions
- 2. Executive Summary
- 2.1. Market Snapshot
- 3. Market Dynamics
- 3.1. Market Drivers
- 3.2. Market Restrains
- 3.3. Market Trends
- 3.4. Market Opportunities
- 4. Market Factor Analysis
- 4.1. Porters Five Forces
- 4.1.1. Bargaining Power of Suppliers
- 4.1.2. Bargaining Power of Buyers
- 4.1.3. Threat of New Entrants
- 4.1.4. Threat of Substitutes
- 4.1.5. Competitive Rivalry
- 4.2. PESTEL analysis
- 4.3. BCG Analysis
- 4.3.1. Stars (High Growth, High Market Share)
- 4.3.2. Cash Cows (Low Growth, High Market Share)
- 4.3.3. Question Mark (High Growth, Low Market Share)
- 4.3.4. Dogs (Low Growth, Low Market Share)
- 4.4. Ansoff Matrix Analysis
- 4.5. Supply Chain Analysis
- 4.6. Regulatory Landscape
- 4.7. Current Market Potential and Opportunity Assessment (TAM–SAM–SOM Framework)
- 4.8. RAX Analyst Note
- 4.1. Porters Five Forces
- 5. Market Analysis, Insights and Forecast 2021-2033
- 5.1. Market Analysis, Insights and Forecast - by Application
- 5.1.1. Insect Monitoring
- 5.1.2. Insect Population Control
- 5.1.3. Crops Protection
- 5.2. Market Analysis, Insights and Forecast - by Type
- 5.2.1. Traps
- 5.2.2. Dispensers
- 5.2.3. Sprays
- 5.3. Market Analysis, Insights and Forecast - by Region
- 5.3.1. North America
- 5.3.2. South America
- 5.3.3. Europe
- 5.3.4. Middle East & Africa
- 5.3.5. Asia Pacific
- 5.1. Market Analysis, Insights and Forecast - by Application
- 6. Global Oviposition Deterring Pheromones Odp Analysis, Insights and Forecast, 2021-2033
- 6.1. Market Analysis, Insights and Forecast - by Application
- 6.1.1. Insect Monitoring
- 6.1.2. Insect Population Control
- 6.1.3. Crops Protection
- 6.2. Market Analysis, Insights and Forecast - by Type
- 6.2.1. Traps
- 6.2.2. Dispensers
- 6.2.3. Sprays
- 6.1. Market Analysis, Insights and Forecast - by Application
- 7. North America Oviposition Deterring Pheromones Odp Analysis, Insights and Forecast, 2020-2032
- 7.1. Market Analysis, Insights and Forecast - by Application
- 7.1.1. Insect Monitoring
- 7.1.2. Insect Population Control
- 7.1.3. Crops Protection
- 7.2. Market Analysis, Insights and Forecast - by Type
- 7.2.1. Traps
- 7.2.2. Dispensers
- 7.2.3. Sprays
- 7.1. Market Analysis, Insights and Forecast - by Application
- 8. South America Oviposition Deterring Pheromones Odp Analysis, Insights and Forecast, 2020-2032
- 8.1. Market Analysis, Insights and Forecast - by Application
- 8.1.1. Insect Monitoring
- 8.1.2. Insect Population Control
- 8.1.3. Crops Protection
- 8.2. Market Analysis, Insights and Forecast - by Type
- 8.2.1. Traps
- 8.2.2. Dispensers
- 8.2.3. Sprays
- 8.1. Market Analysis, Insights and Forecast - by Application
- 9. Europe Oviposition Deterring Pheromones Odp Analysis, Insights and Forecast, 2020-2032
- 9.1. Market Analysis, Insights and Forecast - by Application
- 9.1.1. Insect Monitoring
- 9.1.2. Insect Population Control
- 9.1.3. Crops Protection
- 9.2. Market Analysis, Insights and Forecast - by Type
- 9.2.1. Traps
- 9.2.2. Dispensers
- 9.2.3. Sprays
- 9.1. Market Analysis, Insights and Forecast - by Application
- 10. Middle East & Africa Oviposition Deterring Pheromones Odp Analysis, Insights and Forecast, 2020-2032
- 10.1. Market Analysis, Insights and Forecast - by Application
- 10.1.1. Insect Monitoring
- 10.1.2. Insect Population Control
- 10.1.3. Crops Protection
- 10.2. Market Analysis, Insights and Forecast - by Type
- 10.2.1. Traps
- 10.2.2. Dispensers
- 10.2.3. Sprays
- 10.1. Market Analysis, Insights and Forecast - by Application
- 11. Asia Pacific Oviposition Deterring Pheromones Odp Analysis, Insights and Forecast, 2020-2032
- 11.1. Market Analysis, Insights and Forecast - by Application
- 11.1.1. Insect Monitoring
- 11.1.2. Insect Population Control
- 11.1.3. Crops Protection
- 11.2. Market Analysis, Insights and Forecast - by Type
- 11.2.1. Traps
- 11.2.2. Dispensers
- 11.2.3. Sprays
- 11.1. Market Analysis, Insights and Forecast - by Application
- 12. Competitive Analysis
- 12.1. Company Profiles
- 12.1.1 Trécé Inc.
- 12.1.1.1. Company Overview
- 12.1.1.2. Products
- 12.1.1.3. Company Financials
- 12.1.1.4. SWOT Analysis
- 12.1.2 Bioline AgroSciences Ltd
- 12.1.2.1. Company Overview
- 12.1.2.2. Products
- 12.1.2.3. Company Financials
- 12.1.2.4. SWOT Analysis
- 12.1.3 AgBiTech
- 12.1.3.1. Company Overview
- 12.1.3.2. Products
- 12.1.3.3. Company Financials
- 12.1.3.4. SWOT Analysis
- 12.1.4 Biobest Group NV
- 12.1.4.1. Company Overview
- 12.1.4.2. Products
- 12.1.4.3. Company Financials
- 12.1.4.4. SWOT Analysis
- 12.1.5 Agrisense
- 12.1.5.1. Company Overview
- 12.1.5.2. Products
- 12.1.5.3. Company Financials
- 12.1.5.4. SWOT Analysis
- 12.1.6 Laboratorio Agrochem
- 12.1.6.1. Company Overview
- 12.1.6.2. Products
- 12.1.6.3. Company Financials
- 12.1.6.4. SWOT Analysis
- 12.1.7 Rovensa Next
- 12.1.7.1. Company Overview
- 12.1.7.2. Products
- 12.1.7.3. Company Financials
- 12.1.7.4. SWOT Analysis
- 12.1.8 Novagrica
- 12.1.8.1. Company Overview
- 12.1.8.2. Products
- 12.1.8.3. Company Financials
- 12.1.8.4. SWOT Analysis
- 12.1.9 Russell IPM Ltd
- 12.1.9.1. Company Overview
- 12.1.9.2. Products
- 12.1.9.3. Company Financials
- 12.1.9.4. SWOT Analysis
- 12.1.10 Hercon Environmental
- 12.1.10.1. Company Overview
- 12.1.10.2. Products
- 12.1.10.3. Company Financials
- 12.1.10.4. SWOT Analysis
- 12.1.11 Syngenta Crop Protection AG
- 12.1.11.1. Company Overview
- 12.1.11.2. Products
- 12.1.11.3. Company Financials
- 12.1.11.4. SWOT Analysis
- 12.1.12 Semios
- 12.1.12.1. Company Overview
- 12.1.12.2. Products
- 12.1.12.3. Company Financials
- 12.1.12.4. SWOT Analysis
- 12.1.13 International Pheromone Systems
- 12.1.13.1. Company Overview
- 12.1.13.2. Products
- 12.1.13.3. Company Financials
- 12.1.13.4. SWOT Analysis
- 12.1.14 Pacific Biocontrol Corporation
- 12.1.14.1. Company Overview
- 12.1.14.2. Products
- 12.1.14.3. Company Financials
- 12.1.14.4. SWOT Analysis
- 12.1.15 Shin-Etsu Chemical Co. Ltd.
- 12.1.15.1. Company Overview
- 12.1.15.2. Products
- 12.1.15.3. Company Financials
- 12.1.15.4. SWOT Analysis
- 12.1.16 BASF
- 12.1.16.1. Company Overview
- 12.1.16.2. Products
- 12.1.16.3. Company Financials
- 12.1.16.4. SWOT Analysis
- 12.1.17 Koppert
- 12.1.17.1. Company Overview
- 12.1.17.2. Products
- 12.1.17.3. Company Financials
- 12.1.17.4. SWOT Analysis
- 12.1.18 Andermatt Group AG
- 12.1.18.1. Company Overview
- 12.1.18.2. Products
- 12.1.18.3. Company Financials
- 12.1.18.4. SWOT Analysis
- 12.1.1 Trécé Inc.
- 12.2. Market Entropy
- 12.2.1 Company's Key Areas Served
- 12.2.2 Recent Developments
- 12.3. Company Market Share Analysis 2025
- 12.3.1 Top 5 Companies Market Share Analysis
- 12.3.2 Top 3 Companies Market Share Analysis
- 12.4. List of Potential Customers
- 13. Research Methodology
List of Figures
- Figure 1: Global Oviposition Deterring Pheromones Odp Revenue Breakdown (million, %) by Region 2025 & 2033
- Figure 2: Global Oviposition Deterring Pheromones Odp Volume Breakdown (K, %) by Region 2025 & 2033
- Figure 3: North America Oviposition Deterring Pheromones Odp Revenue (million), by Application 2025 & 2033
- Figure 4: North America Oviposition Deterring Pheromones Odp Volume (K), by Application 2025 & 2033
- Figure 5: North America Oviposition Deterring Pheromones Odp Revenue Share (%), by Application 2025 & 2033
- Figure 6: North America Oviposition Deterring Pheromones Odp Volume Share (%), by Application 2025 & 2033
- Figure 7: North America Oviposition Deterring Pheromones Odp Revenue (million), by Type 2025 & 2033
- Figure 8: North America Oviposition Deterring Pheromones Odp Volume (K), by Type 2025 & 2033
- Figure 9: North America Oviposition Deterring Pheromones Odp Revenue Share (%), by Type 2025 & 2033
- Figure 10: North America Oviposition Deterring Pheromones Odp Volume Share (%), by Type 2025 & 2033
- Figure 11: North America Oviposition Deterring Pheromones Odp Revenue (million), by Country 2025 & 2033
- Figure 12: North America Oviposition Deterring Pheromones Odp Volume (K), by Country 2025 & 2033
- Figure 13: North America Oviposition Deterring Pheromones Odp Revenue Share (%), by Country 2025 & 2033
- Figure 14: North America Oviposition Deterring Pheromones Odp Volume Share (%), by Country 2025 & 2033
- Figure 15: South America Oviposition Deterring Pheromones Odp Revenue (million), by Application 2025 & 2033
- Figure 16: South America Oviposition Deterring Pheromones Odp Volume (K), by Application 2025 & 2033
- Figure 17: South America Oviposition Deterring Pheromones Odp Revenue Share (%), by Application 2025 & 2033
- Figure 18: South America Oviposition Deterring Pheromones Odp Volume Share (%), by Application 2025 & 2033
- Figure 19: South America Oviposition Deterring Pheromones Odp Revenue (million), by Type 2025 & 2033
- Figure 20: South America Oviposition Deterring Pheromones Odp Volume (K), by Type 2025 & 2033
- Figure 21: South America Oviposition Deterring Pheromones Odp Revenue Share (%), by Type 2025 & 2033
- Figure 22: South America Oviposition Deterring Pheromones Odp Volume Share (%), by Type 2025 & 2033
- Figure 23: South America Oviposition Deterring Pheromones Odp Revenue (million), by Country 2025 & 2033
- Figure 24: South America Oviposition Deterring Pheromones Odp Volume (K), by Country 2025 & 2033
- Figure 25: South America Oviposition Deterring Pheromones Odp Revenue Share (%), by Country 2025 & 2033
- Figure 26: South America Oviposition Deterring Pheromones Odp Volume Share (%), by Country 2025 & 2033
- Figure 27: Europe Oviposition Deterring Pheromones Odp Revenue (million), by Application 2025 & 2033
- Figure 28: Europe Oviposition Deterring Pheromones Odp Volume (K), by Application 2025 & 2033
- Figure 29: Europe Oviposition Deterring Pheromones Odp Revenue Share (%), by Application 2025 & 2033
- Figure 30: Europe Oviposition Deterring Pheromones Odp Volume Share (%), by Application 2025 & 2033
- Figure 31: Europe Oviposition Deterring Pheromones Odp Revenue (million), by Type 2025 & 2033
- Figure 32: Europe Oviposition Deterring Pheromones Odp Volume (K), by Type 2025 & 2033
- Figure 33: Europe Oviposition Deterring Pheromones Odp Revenue Share (%), by Type 2025 & 2033
- Figure 34: Europe Oviposition Deterring Pheromones Odp Volume Share (%), by Type 2025 & 2033
- Figure 35: Europe Oviposition Deterring Pheromones Odp Revenue (million), by Country 2025 & 2033
- Figure 36: Europe Oviposition Deterring Pheromones Odp Volume (K), by Country 2025 & 2033
- Figure 37: Europe Oviposition Deterring Pheromones Odp Revenue Share (%), by Country 2025 & 2033
- Figure 38: Europe Oviposition Deterring Pheromones Odp Volume Share (%), by Country 2025 & 2033
- Figure 39: Middle East & Africa Oviposition Deterring Pheromones Odp Revenue (million), by Application 2025 & 2033
- Figure 40: Middle East & Africa Oviposition Deterring Pheromones Odp Volume (K), by Application 2025 & 2033
- Figure 41: Middle East & Africa Oviposition Deterring Pheromones Odp Revenue Share (%), by Application 2025 & 2033
- Figure 42: Middle East & Africa Oviposition Deterring Pheromones Odp Volume Share (%), by Application 2025 & 2033
- Figure 43: Middle East & Africa Oviposition Deterring Pheromones Odp Revenue (million), by Type 2025 & 2033
- Figure 44: Middle East & Africa Oviposition Deterring Pheromones Odp Volume (K), by Type 2025 & 2033
- Figure 45: Middle East & Africa Oviposition Deterring Pheromones Odp Revenue Share (%), by Type 2025 & 2033
- Figure 46: Middle East & Africa Oviposition Deterring Pheromones Odp Volume Share (%), by Type 2025 & 2033
- Figure 47: Middle East & Africa Oviposition Deterring Pheromones Odp Revenue (million), by Country 2025 & 2033
- Figure 48: Middle East & Africa Oviposition Deterring Pheromones Odp Volume (K), by Country 2025 & 2033
- Figure 49: Middle East & Africa Oviposition Deterring Pheromones Odp Revenue Share (%), by Country 2025 & 2033
- Figure 50: Middle East & Africa Oviposition Deterring Pheromones Odp Volume Share (%), by Country 2025 & 2033
- Figure 51: Asia Pacific Oviposition Deterring Pheromones Odp Revenue (million), by Application 2025 & 2033
- Figure 52: Asia Pacific Oviposition Deterring Pheromones Odp Volume (K), by Application 2025 & 2033
- Figure 53: Asia Pacific Oviposition Deterring Pheromones Odp Revenue Share (%), by Application 2025 & 2033
- Figure 54: Asia Pacific Oviposition Deterring Pheromones Odp Volume Share (%), by Application 2025 & 2033
- Figure 55: Asia Pacific Oviposition Deterring Pheromones Odp Revenue (million), by Type 2025 & 2033
- Figure 56: Asia Pacific Oviposition Deterring Pheromones Odp Volume (K), by Type 2025 & 2033
- Figure 57: Asia Pacific Oviposition Deterring Pheromones Odp Revenue Share (%), by Type 2025 & 2033
- Figure 58: Asia Pacific Oviposition Deterring Pheromones Odp Volume Share (%), by Type 2025 & 2033
- Figure 59: Asia Pacific Oviposition Deterring Pheromones Odp Revenue (million), by Country 2025 & 2033
- Figure 60: Asia Pacific Oviposition Deterring Pheromones Odp Volume (K), by Country 2025 & 2033
- Figure 61: Asia Pacific Oviposition Deterring Pheromones Odp Revenue Share (%), by Country 2025 & 2033
- Figure 62: Asia Pacific Oviposition Deterring Pheromones Odp Volume Share (%), by Country 2025 & 2033
List of Tables
- Table 1: Global Oviposition Deterring Pheromones Odp Revenue million Forecast, by Application 2020 & 2033
- Table 2: Global Oviposition Deterring Pheromones Odp Volume K Forecast, by Application 2020 & 2033
- Table 3: Global Oviposition Deterring Pheromones Odp Revenue million Forecast, by Type 2020 & 2033
- Table 4: Global Oviposition Deterring Pheromones Odp Volume K Forecast, by Type 2020 & 2033
- Table 5: Global Oviposition Deterring Pheromones Odp Revenue million Forecast, by Region 2020 & 2033
- Table 6: Global Oviposition Deterring Pheromones Odp Volume K Forecast, by Region 2020 & 2033
- Table 7: Global Oviposition Deterring Pheromones Odp Revenue million Forecast, by Application 2020 & 2033
- Table 8: Global Oviposition Deterring Pheromones Odp Volume K Forecast, by Application 2020 & 2033
- Table 9: Global Oviposition Deterring Pheromones Odp Revenue million Forecast, by Type 2020 & 2033
- Table 10: Global Oviposition Deterring Pheromones Odp Volume K Forecast, by Type 2020 & 2033
- Table 11: Global Oviposition Deterring Pheromones Odp Revenue million Forecast, by Country 2020 & 2033
- Table 12: Global Oviposition Deterring Pheromones Odp Volume K Forecast, by Country 2020 & 2033
- Table 13: United States Oviposition Deterring Pheromones Odp Revenue (million) Forecast, by Application 2020 & 2033
- Table 14: United States Oviposition Deterring Pheromones Odp Volume (K) Forecast, by Application 2020 & 2033
- Table 15: Canada Oviposition Deterring Pheromones Odp Revenue (million) Forecast, by Application 2020 & 2033
- Table 16: Canada Oviposition Deterring Pheromones Odp Volume (K) Forecast, by Application 2020 & 2033
- Table 17: Mexico Oviposition Deterring Pheromones Odp Revenue (million) Forecast, by Application 2020 & 2033
- Table 18: Mexico Oviposition Deterring Pheromones Odp Volume (K) Forecast, by Application 2020 & 2033
- Table 19: Global Oviposition Deterring Pheromones Odp Revenue million Forecast, by Application 2020 & 2033
- Table 20: Global Oviposition Deterring Pheromones Odp Volume K Forecast, by Application 2020 & 2033
- Table 21: Global Oviposition Deterring Pheromones Odp Revenue million Forecast, by Type 2020 & 2033
- Table 22: Global Oviposition Deterring Pheromones Odp Volume K Forecast, by Type 2020 & 2033
- Table 23: Global Oviposition Deterring Pheromones Odp Revenue million Forecast, by Country 2020 & 2033
- Table 24: Global Oviposition Deterring Pheromones Odp Volume K Forecast, by Country 2020 & 2033
- Table 25: Brazil Oviposition Deterring Pheromones Odp Revenue (million) Forecast, by Application 2020 & 2033
- Table 26: Brazil Oviposition Deterring Pheromones Odp Volume (K) Forecast, by Application 2020 & 2033
- Table 27: Argentina Oviposition Deterring Pheromones Odp Revenue (million) Forecast, by Application 2020 & 2033
- Table 28: Argentina Oviposition Deterring Pheromones Odp Volume (K) Forecast, by Application 2020 & 2033
- Table 29: Rest of South America Oviposition Deterring Pheromones Odp Revenue (million) Forecast, by Application 2020 & 2033
- Table 30: Rest of South America Oviposition Deterring Pheromones Odp Volume (K) Forecast, by Application 2020 & 2033
- Table 31: Global Oviposition Deterring Pheromones Odp Revenue million Forecast, by Application 2020 & 2033
- Table 32: Global Oviposition Deterring Pheromones Odp Volume K Forecast, by Application 2020 & 2033
- Table 33: Global Oviposition Deterring Pheromones Odp Revenue million Forecast, by Type 2020 & 2033
- Table 34: Global Oviposition Deterring Pheromones Odp Volume K Forecast, by Type 2020 & 2033
- Table 35: Global Oviposition Deterring Pheromones Odp Revenue million Forecast, by Country 2020 & 2033
- Table 36: Global Oviposition Deterring Pheromones Odp Volume K Forecast, by Country 2020 & 2033
- Table 37: United Kingdom Oviposition Deterring Pheromones Odp Revenue (million) Forecast, by Application 2020 & 2033
- Table 38: United Kingdom Oviposition Deterring Pheromones Odp Volume (K) Forecast, by Application 2020 & 2033
- Table 39: Germany Oviposition Deterring Pheromones Odp Revenue (million) Forecast, by Application 2020 & 2033
- Table 40: Germany Oviposition Deterring Pheromones Odp Volume (K) Forecast, by Application 2020 & 2033
- Table 41: France Oviposition Deterring Pheromones Odp Revenue (million) Forecast, by Application 2020 & 2033
- Table 42: France Oviposition Deterring Pheromones Odp Volume (K) Forecast, by Application 2020 & 2033
- Table 43: Italy Oviposition Deterring Pheromones Odp Revenue (million) Forecast, by Application 2020 & 2033
- Table 44: Italy Oviposition Deterring Pheromones Odp Volume (K) Forecast, by Application 2020 & 2033
- Table 45: Spain Oviposition Deterring Pheromones Odp Revenue (million) Forecast, by Application 2020 & 2033
- Table 46: Spain Oviposition Deterring Pheromones Odp Volume (K) Forecast, by Application 2020 & 2033
- Table 47: Russia Oviposition Deterring Pheromones Odp Revenue (million) Forecast, by Application 2020 & 2033
- Table 48: Russia Oviposition Deterring Pheromones Odp Volume (K) Forecast, by Application 2020 & 2033
- Table 49: Benelux Oviposition Deterring Pheromones Odp Revenue (million) Forecast, by Application 2020 & 2033
- Table 50: Benelux Oviposition Deterring Pheromones Odp Volume (K) Forecast, by Application 2020 & 2033
- Table 51: Nordics Oviposition Deterring Pheromones Odp Revenue (million) Forecast, by Application 2020 & 2033
- Table 52: Nordics Oviposition Deterring Pheromones Odp Volume (K) Forecast, by Application 2020 & 2033
- Table 53: Rest of Europe Oviposition Deterring Pheromones Odp Revenue (million) Forecast, by Application 2020 & 2033
- Table 54: Rest of Europe Oviposition Deterring Pheromones Odp Volume (K) Forecast, by Application 2020 & 2033
- Table 55: Global Oviposition Deterring Pheromones Odp Revenue million Forecast, by Application 2020 & 2033
- Table 56: Global Oviposition Deterring Pheromones Odp Volume K Forecast, by Application 2020 & 2033
- Table 57: Global Oviposition Deterring Pheromones Odp Revenue million Forecast, by Type 2020 & 2033
- Table 58: Global Oviposition Deterring Pheromones Odp Volume K Forecast, by Type 2020 & 2033
- Table 59: Global Oviposition Deterring Pheromones Odp Revenue million Forecast, by Country 2020 & 2033
- Table 60: Global Oviposition Deterring Pheromones Odp Volume K Forecast, by Country 2020 & 2033
- Table 61: Turkey Oviposition Deterring Pheromones Odp Revenue (million) Forecast, by Application 2020 & 2033
- Table 62: Turkey Oviposition Deterring Pheromones Odp Volume (K) Forecast, by Application 2020 & 2033
- Table 63: Israel Oviposition Deterring Pheromones Odp Revenue (million) Forecast, by Application 2020 & 2033
- Table 64: Israel Oviposition Deterring Pheromones Odp Volume (K) Forecast, by Application 2020 & 2033
- Table 65: GCC Oviposition Deterring Pheromones Odp Revenue (million) Forecast, by Application 2020 & 2033
- Table 66: GCC Oviposition Deterring Pheromones Odp Volume (K) Forecast, by Application 2020 & 2033
- Table 67: North Africa Oviposition Deterring Pheromones Odp Revenue (million) Forecast, by Application 2020 & 2033
- Table 68: North Africa Oviposition Deterring Pheromones Odp Volume (K) Forecast, by Application 2020 & 2033
- Table 69: South Africa Oviposition Deterring Pheromones Odp Revenue (million) Forecast, by Application 2020 & 2033
- Table 70: South Africa Oviposition Deterring Pheromones Odp Volume (K) Forecast, by Application 2020 & 2033
- Table 71: Rest of Middle East & Africa Oviposition Deterring Pheromones Odp Revenue (million) Forecast, by Application 2020 & 2033
- Table 72: Rest of Middle East & Africa Oviposition Deterring Pheromones Odp Volume (K) Forecast, by Application 2020 & 2033
- Table 73: Global Oviposition Deterring Pheromones Odp Revenue million Forecast, by Application 2020 & 2033
- Table 74: Global Oviposition Deterring Pheromones Odp Volume K Forecast, by Application 2020 & 2033
- Table 75: Global Oviposition Deterring Pheromones Odp Revenue million Forecast, by Type 2020 & 2033
- Table 76: Global Oviposition Deterring Pheromones Odp Volume K Forecast, by Type 2020 & 2033
- Table 77: Global Oviposition Deterring Pheromones Odp Revenue million Forecast, by Country 2020 & 2033
- Table 78: Global Oviposition Deterring Pheromones Odp Volume K Forecast, by Country 2020 & 2033
- Table 79: China Oviposition Deterring Pheromones Odp Revenue (million) Forecast, by Application 2020 & 2033
- Table 80: China Oviposition Deterring Pheromones Odp Volume (K) Forecast, by Application 2020 & 2033
- Table 81: India Oviposition Deterring Pheromones Odp Revenue (million) Forecast, by Application 2020 & 2033
- Table 82: India Oviposition Deterring Pheromones Odp Volume (K) Forecast, by Application 2020 & 2033
- Table 83: Japan Oviposition Deterring Pheromones Odp Revenue (million) Forecast, by Application 2020 & 2033
- Table 84: Japan Oviposition Deterring Pheromones Odp Volume (K) Forecast, by Application 2020 & 2033
- Table 85: South Korea Oviposition Deterring Pheromones Odp Revenue (million) Forecast, by Application 2020 & 2033
- Table 86: South Korea Oviposition Deterring Pheromones Odp Volume (K) Forecast, by Application 2020 & 2033
- Table 87: ASEAN Oviposition Deterring Pheromones Odp Revenue (million) Forecast, by Application 2020 & 2033
- Table 88: ASEAN Oviposition Deterring Pheromones Odp Volume (K) Forecast, by Application 2020 & 2033
- Table 89: Oceania Oviposition Deterring Pheromones Odp Revenue (million) Forecast, by Application 2020 & 2033
- Table 90: Oceania Oviposition Deterring Pheromones Odp Volume (K) Forecast, by Application 2020 & 2033
- Table 91: Rest of Asia Pacific Oviposition Deterring Pheromones Odp Revenue (million) Forecast, by Application 2020 & 2033
- Table 92: Rest of Asia Pacific Oviposition Deterring Pheromones Odp Volume (K) Forecast, by Application 2020 & 2033
Frequently Asked Questions
1. What is the projected Compound Annual Growth Rate (CAGR) of the Oviposition Deterring Pheromones Odp?
The projected CAGR is approximately XXX%.
2. Which companies are prominent players in the Oviposition Deterring Pheromones Odp?
Key companies in the market include Trécé Inc., Bioline AgroSciences Ltd, AgBiTech, Biobest Group NV, Agrisense, Laboratorio Agrochem, Rovensa Next, Novagrica, Russell IPM Ltd, Hercon Environmental, Syngenta Crop Protection AG, Semios, International Pheromone Systems, Pacific Biocontrol Corporation, Shin-Etsu Chemical Co., Ltd., BASF, Koppert, Andermatt Group AG.
3. What are the main segments of the Oviposition Deterring Pheromones Odp?
The market segments include Application, Type.
4. Can you provide details about the market size?
The market size is estimated to be USD XXX million as of 2022.
5. What are some drivers contributing to market growth?
N/A
6. What are the notable trends driving market growth?
N/A
7. Are there any restraints impacting market growth?
N/A
8. Can you provide examples of recent developments in the market?
N/A
9. What pricing options are available for accessing the report?
Pricing options include single-user, multi-user, and enterprise licenses priced at USD 3950.00, USD 5925.00, and USD 7900.00 respectively.
10. Is the market size provided in terms of value or volume?
The market size is provided in terms of value, measured in million and volume, measured in K.
11. Are there any specific market keywords associated with the report?
Yes, the market keyword associated with the report is "Oviposition Deterring Pheromones Odp," which aids in identifying and referencing the specific market segment covered.
12. How do I determine which pricing option suits my needs best?
The pricing options vary based on user requirements and access needs. Individual users may opt for single-user licenses, while businesses requiring broader access may choose multi-user or enterprise licenses for cost-effective access to the report.
13. Are there any additional resources or data provided in the Oviposition Deterring Pheromones Odp report?
While the report offers comprehensive insights, it's advisable to review the specific contents or supplementary materials provided to ascertain if additional resources or data are available.
14. How can I stay updated on further developments or reports in the Oviposition Deterring Pheromones Odp?
To stay informed about further developments, trends, and reports in the Oviposition Deterring Pheromones Odp, consider subscribing to industry newsletters, following relevant companies and organizations, or regularly checking reputable industry news sources and publications.
Methodology
Step 1 - Identification of Relevant Samples Size from Population Database


Step 2 - Approaches for Defining Global Market Size (Value, Volume* & Price*)

Note*: In applicable scenarios
Step 3 - Data Sources
Primary Research
- Web Analytics
- Survey Reports
- Research Institute
- Latest Research Reports
- Opinion Leaders
Secondary Research
- Annual Reports
- White Paper
- Latest Press Release
- Industry Association
- Paid Database
- Investor Presentations

Step 4 - Data Triangulation
Involves using different sources of information in order to increase the validity of a study
These sources are likely to be stakeholders in a program - participants, other researchers, program staff, other community members, and so on.
Then we put all data in single framework & apply various statistical tools to find out the dynamic on the market.
During the analysis stage, feedback from the stakeholder groups would be compared to determine areas of agreement as well as areas of divergence