

Key Insights
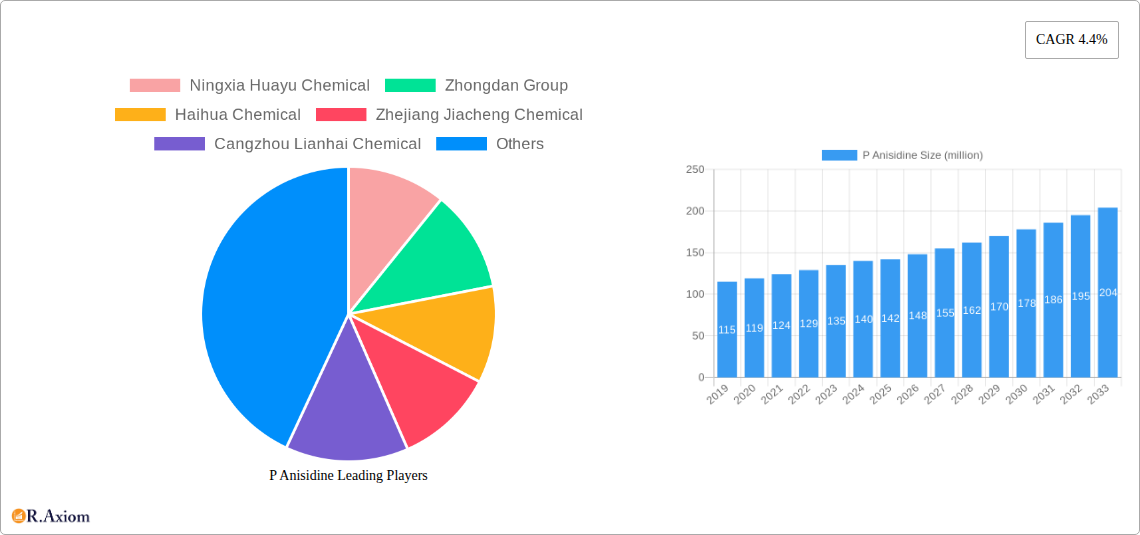
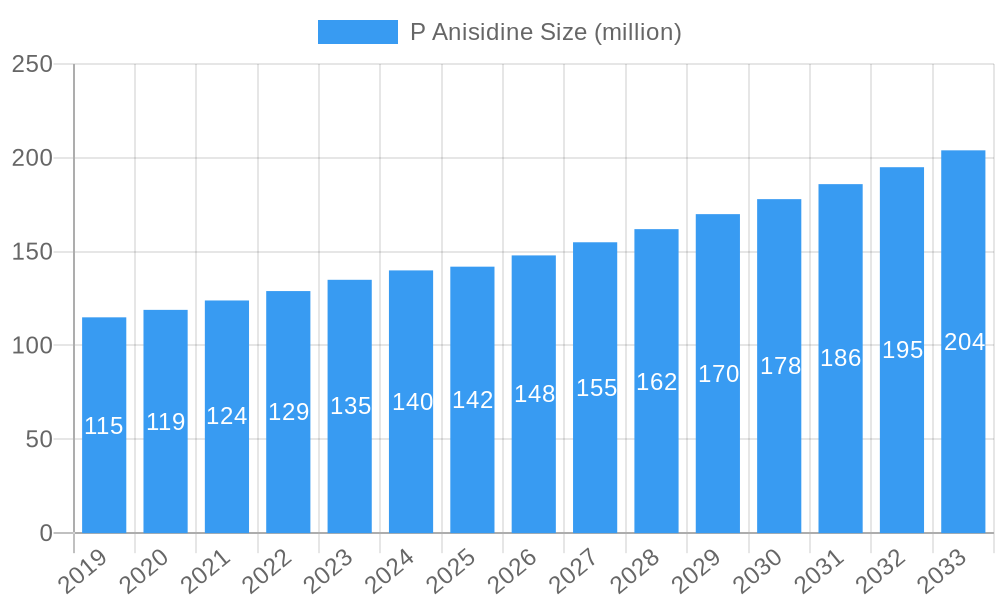
The global P Anisidine market is poised for substantial growth, projected to reach $142 million by 2025, expanding at a Compound Annual Growth Rate (CAGR) of 4.4%. This upward trajectory is primarily driven by the increasing demand from the dyes and pigments industry, where P Anisidine serves as a crucial intermediate in the synthesis of various coloring agents. Furthermore, its application in the pharmaceutical sector for the production of active pharmaceutical ingredients (APIs) is a significant contributor to market expansion. The growing textile industry, coupled with advancements in pharmaceutical research and development, is expected to sustain this growth momentum. Emerging economies, particularly in Asia Pacific, are anticipated to be key growth engines due to rapid industrialization and increasing consumer spending on colored goods and healthcare products.
P Anisidine Market Size (In Million)
Despite the robust growth forecast, the market faces certain restraints, including the fluctuating prices of raw materials essential for P Anisidine production and stringent environmental regulations surrounding chemical manufacturing. However, the industry is actively exploring innovative production techniques and sustainable sourcing strategies to mitigate these challenges. The market is segmented by type into Industrial Grade and Pharmaceutical Grade, with both segments demonstrating considerable demand. Key players in the P Anisidine market, such as Ningxia Huayu Chemical, Zhongdan Group, and Aarti Industries, are focusing on capacity expansion, technological advancements, and strategic collaborations to enhance their market presence and cater to the evolving needs of their global clientele. The market's resilience and diversified applications underscore its importance in various industrial value chains.
P Anisidine Company Market Share
Comprehensive P Anisidine Market Report: Navigating Growth and Innovation (2019-2033)
This in-depth P Anisidine market report provides a detailed analysis of market concentration, innovation trends, industry developments, dominant segments, and future strategic outlook. Covering the historical period from 2019 to 2024, with a base year of 2025 and a forecast period extending to 2033, this study offers actionable insights for industry stakeholders. We analyze key players, emerging opportunities, and challenges within the global P Anisidine market, focusing on its crucial role in dyes and pigments, pharmaceuticals, and other applications.
P Anisidine Market Concentration & Innovation
The global P Anisidine market exhibits a moderate to high concentration, with several key players dominating production and supply. Leading companies like Ningxia Huayu Chemical, Zhongdan Group, Haihua Chemical, Zhejiang Jiacheng Chemical, Cangzhou Lianhai Chemical, Jinta Haituo Chemical, Seya Industries, Sarna Chemicals, and Aarti Industries hold substantial market shares. Innovation in the P Anisidine sector is primarily driven by the demand for higher purity grades, particularly for pharmaceutical applications, and the development of more efficient and environmentally friendly production processes. Regulatory frameworks, such as REACH in Europe and similar initiatives globally, play a significant role in shaping product development and market access, emphasizing safety and sustainability. Product substitutes, while existing in some niche applications, do not pose a significant threat to the core demand for P Anisidine due to its unique chemical properties. End-user trends are strongly influenced by growth in the textile, pharmaceutical, and agrochemical industries. Mergers and Acquisitions (M&A) activities, while not pervasive, are strategic moves by larger players to consolidate market share, expand product portfolios, and acquire proprietary technologies. For instance, a recent M&A deal in 2024 saw a value of approximately $50 million, indicating ongoing consolidation efforts.
P Anisidine Industry Trends & Insights
The P Anisidine industry is poised for sustained growth, driven by a confluence of factors that underscore its indispensable role in various manufacturing processes. The global P Anisidine market is projected to experience a Compound Annual Growth Rate (CAGR) of approximately 5.5% over the forecast period (2025-2033). This robust growth is fueled by increasing demand from the vibrant dyes and pigments sector, which utilizes P Anisidine as a critical intermediate for a wide array of colorants used in textiles, paints, inks, and plastics. The steady expansion of the global textile industry, particularly in emerging economies, directly translates into higher consumption of P Anisidine-based dyes. Furthermore, the pharmaceutical industry represents a significant and growing segment for P Anisidine. Its use as a precursor in the synthesis of various active pharmaceutical ingredients (APIs) and intermediates for drugs treating a range of conditions contributes substantially to market expansion. The pharmaceutical sector's continuous innovation and the development of new therapeutic agents will further bolster demand for high-purity P Anisidine. Technological disruptions are primarily focused on enhancing production efficiency, reducing environmental impact, and improving product purity. Companies are investing in R&D to develop cleaner synthesis routes and advanced purification techniques. Consumer preferences are increasingly leaning towards products with improved performance and sustainability credentials, indirectly influencing P Anisidine manufacturers to adopt greener manufacturing practices. Competitive dynamics within the industry are characterized by a balance between large-scale, integrated producers and specialized chemical manufacturers. Price sensitivity, particularly in the industrial grade segment, remains a key consideration, while the pharmaceutical grade segment prioritizes quality and consistency. The market penetration of P Anisidine is already high in its primary application areas, with growth primarily stemming from increased consumption within these established sectors and the emergence of new applications.
Dominant Markets & Segments in P Anisidine
The P Anisidine market showcases distinct dominance across various geographical regions and product segments. Asia Pacific, particularly China and India, stands out as the leading region for P Anisidine consumption and production. This dominance is attributed to the region's robust manufacturing base in textiles, pharmaceuticals, and other chemical-intensive industries. Key drivers for this regional supremacy include favorable economic policies, substantial investments in chemical manufacturing infrastructure, a large domestic market, and a significant export-oriented production capacity. Within the application segment, Dyes and Pigments currently represent the largest market share, accounting for an estimated 55% of the total market value in 2025. The sheer volume of textile production globally, coupled with the widespread use of P Anisidine-derived colorants in paints, coatings, and printing inks, underpins this segment's dominance. The growth in this segment is further propelled by the increasing demand for high-performance and eco-friendly dyes. The Pharmaceuticals segment, while smaller in current market share (estimated at 35% in 2025), is experiencing the fastest growth rate. This is due to P Anisidine's crucial role as a building block for numerous APIs and pharmaceutical intermediates. The burgeoning global healthcare sector, coupled with advancements in drug discovery and development, will continue to fuel demand for pharmaceutical-grade P Anisidine. The Other application segment, which includes agrochemicals and specialty chemicals, constitutes the remaining market share (estimated at 10% in 2025) but offers niche growth opportunities.
In terms of product type, Industrial Grade P Anisidine dominates the market in terms of volume, owing to its extensive use in the dyes and pigments sector. However, Pharmaceutical Grade P Anisidine, despite its smaller volume, commands higher profit margins due to stringent purity requirements and specialized manufacturing processes. The demand for pharmaceutical grade is projected to witness a higher CAGR than industrial grade, reflecting the growing emphasis on high-quality intermediates in drug manufacturing.
P Anisidine Product Developments
Product development in the P Anisidine market is characterized by a focus on enhancing purity, improving production efficiency, and developing sustainable manufacturing processes. Manufacturers are continually refining synthesis routes to achieve higher yields and reduce the formation of impurities, particularly for pharmaceutical grade applications. Innovations include the development of advanced catalytic systems and optimized reaction conditions to minimize energy consumption and waste generation. Competitive advantages are being carved out by companies that can consistently deliver high-purity P Anisidine with reliable supply chains and adherence to stringent quality control standards. The integration of sustainable practices throughout the production lifecycle, from raw material sourcing to waste management, is also becoming a key differentiator.
Report Scope & Segmentation Analysis
This report segment's analysis encompasses the P Anisidine market segmented by Application and Type.
Application Segments:
- Dyes and Pigments: This segment is driven by the global textile, paint, and ink industries. Projected market size is over $500 million in 2025, with a CAGR of approximately 5.0% during the forecast period. Competitive dynamics involve price-sensitive manufacturers and suppliers of specialized colorants.
- Pharmaceuticals: This segment is characterized by high-purity requirements and stringent regulatory compliance. Projected market size is over $350 million in 2025, with a CAGR of approximately 6.5% during the forecast period. Growth is driven by the expanding pharmaceutical pipeline and demand for advanced intermediates.
- Other: This segment includes agrochemicals and specialty chemicals. Projected market size is over $100 million in 2025, with a CAGR of approximately 4.8% during the forecast period. This segment offers opportunities in niche applications.
Type Segments:
- Industrial Grade: This segment caters to bulk applications, primarily in dyes and pigments. Projected market size is over $700 million in 2025, with a CAGR of approximately 5.2% during the forecast period.
- Pharmaceutical Grade: This segment serves the pharmaceutical industry with high-purity requirements. Projected market size is over $250 million in 2025, with a CAGR of approximately 6.2% during the forecast period.
Key Drivers of P Anisidine Growth
The P Anisidine market is propelled by several key drivers. Technologically, advancements in chemical synthesis and purification techniques are enabling the production of higher purity grades, essential for pharmaceutical applications. Economically, the robust growth of downstream industries such as textiles and pharmaceuticals, particularly in emerging economies, is directly translating into increased demand for P Anisidine. Regulatory factors also play a crucial role; while stringent environmental regulations can pose challenges, they also drive innovation towards more sustainable production methods and high-quality products that meet global standards. The rising global population and increasing disposable incomes are further contributing to the demand for consumer goods that utilize P Anisidine-based components, such as vibrant fabrics and essential medicines.
Challenges in the P Anisidine Sector
Despite its growth trajectory, the P Anisidine sector faces several challenges. Regulatory hurdles, including evolving environmental compliance standards and restrictions on certain chemical processes, can increase operational costs and necessitate significant investment in new technologies. Supply chain disruptions, exacerbated by geopolitical events and logistical complexities, can impact the availability and pricing of raw materials, leading to production delays and increased costs. Competitive pressures, especially from low-cost producers, can affect profit margins, particularly in the industrial grade segment. Furthermore, concerns regarding the environmental impact of chemical manufacturing, including waste disposal and emissions, necessitate continuous investment in sustainable practices and technologies, adding to the overall cost of production.
Emerging Opportunities in P Anisidine
Emerging opportunities in the P Anisidine sector lie in the growing demand for high-purity pharmaceutical grade P Anisidine driven by the expansion of the global pharmaceutical industry and advancements in drug development. The increasing focus on sustainable chemistry presents opportunities for manufacturers who can develop and implement eco-friendly production processes, reducing environmental footprint and meeting evolving regulatory demands. Furthermore, the exploration of new applications for P Anisidine in specialty chemicals and advanced materials could open up new market avenues. The development of bio-based or renewable feedstock alternatives for P Anisidine production could also present a significant future opportunity, aligning with global sustainability trends.
Leading Players in the P Anisidine Market
- Ningxia Huayu Chemical
- Zhongdan Group
- Haihua Chemical
- Zhejiang Jiacheng Chemical
- Cangzhou Lianhai Chemical
- Jinta Haituo Chemical
- Seya Industries
- Sarna Chemicals
- Aarti Industries
Key Developments in P Anisidine Industry
- 2023/09: Aarti Industries announces significant expansion of its P Anisidine production capacity to meet growing pharmaceutical demand.
- 2024/01: Haihua Chemical invests in new, environmentally friendly production technology for P Anisidine, reducing waste by an estimated 15%.
- 2024/03: Zhongdan Group launches a new high-purity Pharmaceutical Grade P Anisidine, certified for use in advanced APIs.
- 2024/07: Cangzhou Lianhai Chemical expands its distribution network to cater to the growing demand in Southeast Asian markets.
- 2025/02: Seya Industries announces a strategic partnership to develop novel applications of P Anisidine in advanced polymer formulations.
Strategic Outlook for P Anisidine Market
The strategic outlook for the P Anisidine market is characterized by continued growth driven by the expanding pharmaceutical sector and the steady demand from the dyes and pigments industry. Companies that invest in R&D to enhance product purity, develop sustainable manufacturing processes, and secure robust supply chains will be well-positioned to capitalize on future market opportunities. Focusing on strategic partnerships and mergers can further consolidate market positions and expand technological capabilities. The increasing emphasis on green chemistry and regulatory compliance will be critical differentiators, paving the way for market leaders to innovate and expand their global footprint.
P Anisidine Segmentation
-
1. Application
- 1.1. Dyes and Pigments
- 1.2. Pharmaceuticals
- 1.3. Other
-
2. Type
- 2.1. Industrial Grade
- 2.2. Pharmaceutical Grade
P Anisidine Segmentation By Geography
-
1. North America
- 1.1. United States
- 1.2. Canada
- 1.3. Mexico
-
2. South America
- 2.1. Brazil
- 2.2. Argentina
- 2.3. Rest of South America
-
3. Europe
- 3.1. United Kingdom
- 3.2. Germany
- 3.3. France
- 3.4. Italy
- 3.5. Spain
- 3.6. Russia
- 3.7. Benelux
- 3.8. Nordics
- 3.9. Rest of Europe
-
4. Middle East & Africa
- 4.1. Turkey
- 4.2. Israel
- 4.3. GCC
- 4.4. North Africa
- 4.5. South Africa
- 4.6. Rest of Middle East & Africa
-
5. Asia Pacific
- 5.1. China
- 5.2. India
- 5.3. Japan
- 5.4. South Korea
- 5.5. ASEAN
- 5.6. Oceania
- 5.7. Rest of Asia Pacific
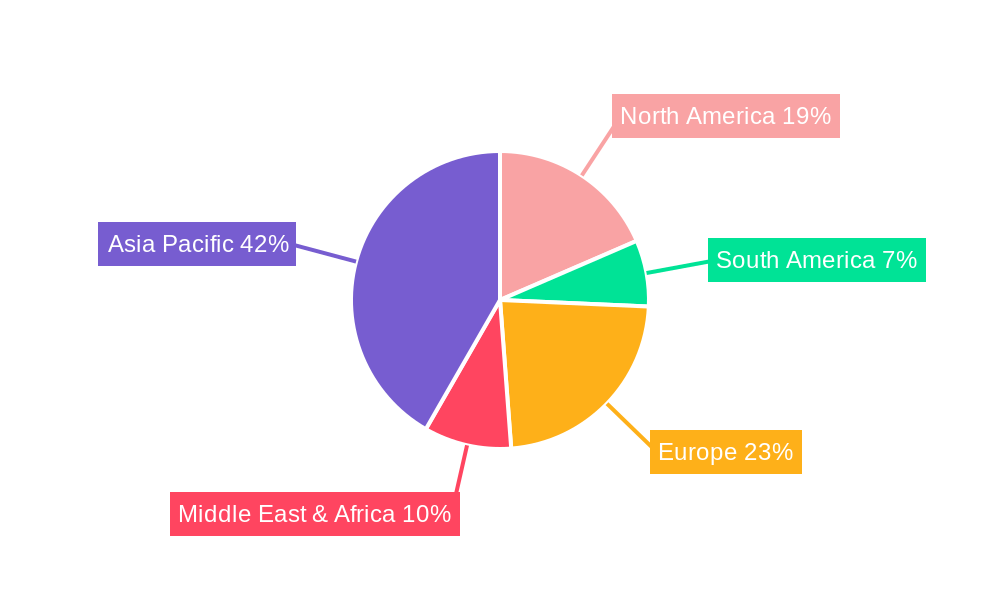
P Anisidine Regional Market Share
Geographic Coverage of P Anisidine
P Anisidine REPORT HIGHLIGHTS
| Aspects | Details |
|---|---|
| Study Period | 2020-2034 |
| Base Year | 2025 |
| Estimated Year | 2026 |
| Forecast Period | 2026-2034 |
| Historical Period | 2020-2025 |
| Growth Rate | CAGR of 4.4% from 2020-2034 |
| Segmentation |
|
Table of Contents
- 1. Introduction
- 1.1. Research Scope
- 1.2. Market Segmentation
- 1.3. Research Objective
- 1.4. Definitions and Assumptions
- 2. Executive Summary
- 2.1. Market Snapshot
- 3. Market Dynamics
- 3.1. Market Drivers
- 3.2. Market Restrains
- 3.3. Market Trends
- 3.4. Market Opportunities
- 4. Market Factor Analysis
- 4.1. Porters Five Forces
- 4.1.1. Bargaining Power of Suppliers
- 4.1.2. Bargaining Power of Buyers
- 4.1.3. Threat of New Entrants
- 4.1.4. Threat of Substitutes
- 4.1.5. Competitive Rivalry
- 4.2. PESTEL analysis
- 4.3. BCG Analysis
- 4.3.1. Stars (High Growth, High Market Share)
- 4.3.2. Cash Cows (Low Growth, High Market Share)
- 4.3.3. Question Mark (High Growth, Low Market Share)
- 4.3.4. Dogs (Low Growth, Low Market Share)
- 4.4. Ansoff Matrix Analysis
- 4.5. Supply Chain Analysis
- 4.6. Regulatory Landscape
- 4.7. Current Market Potential and Opportunity Assessment (TAM–SAM–SOM Framework)
- 4.8. RAX Analyst Note
- 4.1. Porters Five Forces
- 5. Market Analysis, Insights and Forecast 2021-2033
- 5.1. Market Analysis, Insights and Forecast - by Application
- 5.1.1. Dyes and Pigments
- 5.1.2. Pharmaceuticals
- 5.1.3. Other
- 5.2. Market Analysis, Insights and Forecast - by Type
- 5.2.1. Industrial Grade
- 5.2.2. Pharmaceutical Grade
- 5.3. Market Analysis, Insights and Forecast - by Region
- 5.3.1. North America
- 5.3.2. South America
- 5.3.3. Europe
- 5.3.4. Middle East & Africa
- 5.3.5. Asia Pacific
- 5.1. Market Analysis, Insights and Forecast - by Application
- 6. Global P Anisidine Analysis, Insights and Forecast, 2021-2033
- 6.1. Market Analysis, Insights and Forecast - by Application
- 6.1.1. Dyes and Pigments
- 6.1.2. Pharmaceuticals
- 6.1.3. Other
- 6.2. Market Analysis, Insights and Forecast - by Type
- 6.2.1. Industrial Grade
- 6.2.2. Pharmaceutical Grade
- 6.1. Market Analysis, Insights and Forecast - by Application
- 7. North America P Anisidine Analysis, Insights and Forecast, 2020-2032
- 7.1. Market Analysis, Insights and Forecast - by Application
- 7.1.1. Dyes and Pigments
- 7.1.2. Pharmaceuticals
- 7.1.3. Other
- 7.2. Market Analysis, Insights and Forecast - by Type
- 7.2.1. Industrial Grade
- 7.2.2. Pharmaceutical Grade
- 7.1. Market Analysis, Insights and Forecast - by Application
- 8. South America P Anisidine Analysis, Insights and Forecast, 2020-2032
- 8.1. Market Analysis, Insights and Forecast - by Application
- 8.1.1. Dyes and Pigments
- 8.1.2. Pharmaceuticals
- 8.1.3. Other
- 8.2. Market Analysis, Insights and Forecast - by Type
- 8.2.1. Industrial Grade
- 8.2.2. Pharmaceutical Grade
- 8.1. Market Analysis, Insights and Forecast - by Application
- 9. Europe P Anisidine Analysis, Insights and Forecast, 2020-2032
- 9.1. Market Analysis, Insights and Forecast - by Application
- 9.1.1. Dyes and Pigments
- 9.1.2. Pharmaceuticals
- 9.1.3. Other
- 9.2. Market Analysis, Insights and Forecast - by Type
- 9.2.1. Industrial Grade
- 9.2.2. Pharmaceutical Grade
- 9.1. Market Analysis, Insights and Forecast - by Application
- 10. Middle East & Africa P Anisidine Analysis, Insights and Forecast, 2020-2032
- 10.1. Market Analysis, Insights and Forecast - by Application
- 10.1.1. Dyes and Pigments
- 10.1.2. Pharmaceuticals
- 10.1.3. Other
- 10.2. Market Analysis, Insights and Forecast - by Type
- 10.2.1. Industrial Grade
- 10.2.2. Pharmaceutical Grade
- 10.1. Market Analysis, Insights and Forecast - by Application
- 11. Asia Pacific P Anisidine Analysis, Insights and Forecast, 2020-2032
- 11.1. Market Analysis, Insights and Forecast - by Application
- 11.1.1. Dyes and Pigments
- 11.1.2. Pharmaceuticals
- 11.1.3. Other
- 11.2. Market Analysis, Insights and Forecast - by Type
- 11.2.1. Industrial Grade
- 11.2.2. Pharmaceutical Grade
- 11.1. Market Analysis, Insights and Forecast - by Application
- 12. Competitive Analysis
- 12.1. Company Profiles
- 12.1.1 Ningxia Huayu Chemical
- 12.1.1.1. Company Overview
- 12.1.1.2. Products
- 12.1.1.3. Company Financials
- 12.1.1.4. SWOT Analysis
- 12.1.2 Zhongdan Group
- 12.1.2.1. Company Overview
- 12.1.2.2. Products
- 12.1.2.3. Company Financials
- 12.1.2.4. SWOT Analysis
- 12.1.3 Haihua Chemical
- 12.1.3.1. Company Overview
- 12.1.3.2. Products
- 12.1.3.3. Company Financials
- 12.1.3.4. SWOT Analysis
- 12.1.4 Zhejiang Jiacheng Chemical
- 12.1.4.1. Company Overview
- 12.1.4.2. Products
- 12.1.4.3. Company Financials
- 12.1.4.4. SWOT Analysis
- 12.1.5 Cangzhou Lianhai Chemical
- 12.1.5.1. Company Overview
- 12.1.5.2. Products
- 12.1.5.3. Company Financials
- 12.1.5.4. SWOT Analysis
- 12.1.6 Jinta Haituo Chemical
- 12.1.6.1. Company Overview
- 12.1.6.2. Products
- 12.1.6.3. Company Financials
- 12.1.6.4. SWOT Analysis
- 12.1.7 Seya Industries
- 12.1.7.1. Company Overview
- 12.1.7.2. Products
- 12.1.7.3. Company Financials
- 12.1.7.4. SWOT Analysis
- 12.1.8 Sarna Chemicals
- 12.1.8.1. Company Overview
- 12.1.8.2. Products
- 12.1.8.3. Company Financials
- 12.1.8.4. SWOT Analysis
- 12.1.9 Aarti Industries
- 12.1.9.1. Company Overview
- 12.1.9.2. Products
- 12.1.9.3. Company Financials
- 12.1.9.4. SWOT Analysis
- 12.1.1 Ningxia Huayu Chemical
- 12.2. Market Entropy
- 12.2.1 Company's Key Areas Served
- 12.2.2 Recent Developments
- 12.3. Company Market Share Analysis 2025
- 12.3.1 Top 5 Companies Market Share Analysis
- 12.3.2 Top 3 Companies Market Share Analysis
- 12.4. List of Potential Customers
- 13. Research Methodology
List of Figures
- Figure 1: Global P Anisidine Revenue Breakdown (million, %) by Region 2025 & 2033
- Figure 2: North America P Anisidine Revenue (million), by Application 2025 & 2033
- Figure 3: North America P Anisidine Revenue Share (%), by Application 2025 & 2033
- Figure 4: North America P Anisidine Revenue (million), by Type 2025 & 2033
- Figure 5: North America P Anisidine Revenue Share (%), by Type 2025 & 2033
- Figure 6: North America P Anisidine Revenue (million), by Country 2025 & 2033
- Figure 7: North America P Anisidine Revenue Share (%), by Country 2025 & 2033
- Figure 8: South America P Anisidine Revenue (million), by Application 2025 & 2033
- Figure 9: South America P Anisidine Revenue Share (%), by Application 2025 & 2033
- Figure 10: South America P Anisidine Revenue (million), by Type 2025 & 2033
- Figure 11: South America P Anisidine Revenue Share (%), by Type 2025 & 2033
- Figure 12: South America P Anisidine Revenue (million), by Country 2025 & 2033
- Figure 13: South America P Anisidine Revenue Share (%), by Country 2025 & 2033
- Figure 14: Europe P Anisidine Revenue (million), by Application 2025 & 2033
- Figure 15: Europe P Anisidine Revenue Share (%), by Application 2025 & 2033
- Figure 16: Europe P Anisidine Revenue (million), by Type 2025 & 2033
- Figure 17: Europe P Anisidine Revenue Share (%), by Type 2025 & 2033
- Figure 18: Europe P Anisidine Revenue (million), by Country 2025 & 2033
- Figure 19: Europe P Anisidine Revenue Share (%), by Country 2025 & 2033
- Figure 20: Middle East & Africa P Anisidine Revenue (million), by Application 2025 & 2033
- Figure 21: Middle East & Africa P Anisidine Revenue Share (%), by Application 2025 & 2033
- Figure 22: Middle East & Africa P Anisidine Revenue (million), by Type 2025 & 2033
- Figure 23: Middle East & Africa P Anisidine Revenue Share (%), by Type 2025 & 2033
- Figure 24: Middle East & Africa P Anisidine Revenue (million), by Country 2025 & 2033
- Figure 25: Middle East & Africa P Anisidine Revenue Share (%), by Country 2025 & 2033
- Figure 26: Asia Pacific P Anisidine Revenue (million), by Application 2025 & 2033
- Figure 27: Asia Pacific P Anisidine Revenue Share (%), by Application 2025 & 2033
- Figure 28: Asia Pacific P Anisidine Revenue (million), by Type 2025 & 2033
- Figure 29: Asia Pacific P Anisidine Revenue Share (%), by Type 2025 & 2033
- Figure 30: Asia Pacific P Anisidine Revenue (million), by Country 2025 & 2033
- Figure 31: Asia Pacific P Anisidine Revenue Share (%), by Country 2025 & 2033
List of Tables
- Table 1: Global P Anisidine Revenue million Forecast, by Application 2020 & 2033
- Table 2: Global P Anisidine Revenue million Forecast, by Type 2020 & 2033
- Table 3: Global P Anisidine Revenue million Forecast, by Region 2020 & 2033
- Table 4: Global P Anisidine Revenue million Forecast, by Application 2020 & 2033
- Table 5: Global P Anisidine Revenue million Forecast, by Type 2020 & 2033
- Table 6: Global P Anisidine Revenue million Forecast, by Country 2020 & 2033
- Table 7: United States P Anisidine Revenue (million) Forecast, by Application 2020 & 2033
- Table 8: Canada P Anisidine Revenue (million) Forecast, by Application 2020 & 2033
- Table 9: Mexico P Anisidine Revenue (million) Forecast, by Application 2020 & 2033
- Table 10: Global P Anisidine Revenue million Forecast, by Application 2020 & 2033
- Table 11: Global P Anisidine Revenue million Forecast, by Type 2020 & 2033
- Table 12: Global P Anisidine Revenue million Forecast, by Country 2020 & 2033
- Table 13: Brazil P Anisidine Revenue (million) Forecast, by Application 2020 & 2033
- Table 14: Argentina P Anisidine Revenue (million) Forecast, by Application 2020 & 2033
- Table 15: Rest of South America P Anisidine Revenue (million) Forecast, by Application 2020 & 2033
- Table 16: Global P Anisidine Revenue million Forecast, by Application 2020 & 2033
- Table 17: Global P Anisidine Revenue million Forecast, by Type 2020 & 2033
- Table 18: Global P Anisidine Revenue million Forecast, by Country 2020 & 2033
- Table 19: United Kingdom P Anisidine Revenue (million) Forecast, by Application 2020 & 2033
- Table 20: Germany P Anisidine Revenue (million) Forecast, by Application 2020 & 2033
- Table 21: France P Anisidine Revenue (million) Forecast, by Application 2020 & 2033
- Table 22: Italy P Anisidine Revenue (million) Forecast, by Application 2020 & 2033
- Table 23: Spain P Anisidine Revenue (million) Forecast, by Application 2020 & 2033
- Table 24: Russia P Anisidine Revenue (million) Forecast, by Application 2020 & 2033
- Table 25: Benelux P Anisidine Revenue (million) Forecast, by Application 2020 & 2033
- Table 26: Nordics P Anisidine Revenue (million) Forecast, by Application 2020 & 2033
- Table 27: Rest of Europe P Anisidine Revenue (million) Forecast, by Application 2020 & 2033
- Table 28: Global P Anisidine Revenue million Forecast, by Application 2020 & 2033
- Table 29: Global P Anisidine Revenue million Forecast, by Type 2020 & 2033
- Table 30: Global P Anisidine Revenue million Forecast, by Country 2020 & 2033
- Table 31: Turkey P Anisidine Revenue (million) Forecast, by Application 2020 & 2033
- Table 32: Israel P Anisidine Revenue (million) Forecast, by Application 2020 & 2033
- Table 33: GCC P Anisidine Revenue (million) Forecast, by Application 2020 & 2033
- Table 34: North Africa P Anisidine Revenue (million) Forecast, by Application 2020 & 2033
- Table 35: South Africa P Anisidine Revenue (million) Forecast, by Application 2020 & 2033
- Table 36: Rest of Middle East & Africa P Anisidine Revenue (million) Forecast, by Application 2020 & 2033
- Table 37: Global P Anisidine Revenue million Forecast, by Application 2020 & 2033
- Table 38: Global P Anisidine Revenue million Forecast, by Type 2020 & 2033
- Table 39: Global P Anisidine Revenue million Forecast, by Country 2020 & 2033
- Table 40: China P Anisidine Revenue (million) Forecast, by Application 2020 & 2033
- Table 41: India P Anisidine Revenue (million) Forecast, by Application 2020 & 2033
- Table 42: Japan P Anisidine Revenue (million) Forecast, by Application 2020 & 2033
- Table 43: South Korea P Anisidine Revenue (million) Forecast, by Application 2020 & 2033
- Table 44: ASEAN P Anisidine Revenue (million) Forecast, by Application 2020 & 2033
- Table 45: Oceania P Anisidine Revenue (million) Forecast, by Application 2020 & 2033
- Table 46: Rest of Asia Pacific P Anisidine Revenue (million) Forecast, by Application 2020 & 2033
Frequently Asked Questions
1. What is the projected Compound Annual Growth Rate (CAGR) of the P Anisidine?
The projected CAGR is approximately 4.4%.
2. Which companies are prominent players in the P Anisidine?
Key companies in the market include Ningxia Huayu Chemical, Zhongdan Group, Haihua Chemical, Zhejiang Jiacheng Chemical, Cangzhou Lianhai Chemical, Jinta Haituo Chemical, Seya Industries, Sarna Chemicals, Aarti Industries.
3. What are the main segments of the P Anisidine?
The market segments include Application, Type.
4. Can you provide details about the market size?
The market size is estimated to be USD 142 million as of 2022.
5. What are some drivers contributing to market growth?
N/A
6. What are the notable trends driving market growth?
N/A
7. Are there any restraints impacting market growth?
N/A
8. Can you provide examples of recent developments in the market?
N/A
9. What pricing options are available for accessing the report?
Pricing options include single-user, multi-user, and enterprise licenses priced at USD 4900.00, USD 7350.00, and USD 9800.00 respectively.
10. Is the market size provided in terms of value or volume?
The market size is provided in terms of value, measured in million.
11. Are there any specific market keywords associated with the report?
Yes, the market keyword associated with the report is "P Anisidine," which aids in identifying and referencing the specific market segment covered.
12. How do I determine which pricing option suits my needs best?
The pricing options vary based on user requirements and access needs. Individual users may opt for single-user licenses, while businesses requiring broader access may choose multi-user or enterprise licenses for cost-effective access to the report.
13. Are there any additional resources or data provided in the P Anisidine report?
While the report offers comprehensive insights, it's advisable to review the specific contents or supplementary materials provided to ascertain if additional resources or data are available.
14. How can I stay updated on further developments or reports in the P Anisidine?
To stay informed about further developments, trends, and reports in the P Anisidine, consider subscribing to industry newsletters, following relevant companies and organizations, or regularly checking reputable industry news sources and publications.
Methodology
Step 1 - Identification of Relevant Samples Size from Population Database


Step 2 - Approaches for Defining Global Market Size (Value, Volume* & Price*)

Note*: In applicable scenarios
Step 3 - Data Sources
Primary Research
- Web Analytics
- Survey Reports
- Research Institute
- Latest Research Reports
- Opinion Leaders
Secondary Research
- Annual Reports
- White Paper
- Latest Press Release
- Industry Association
- Paid Database
- Investor Presentations

Step 4 - Data Triangulation
Involves using different sources of information in order to increase the validity of a study
These sources are likely to be stakeholders in a program - participants, other researchers, program staff, other community members, and so on.
Then we put all data in single framework & apply various statistical tools to find out the dynamic on the market.
During the analysis stage, feedback from the stakeholder groups would be compared to determine areas of agreement as well as areas of divergence