
Key Insights
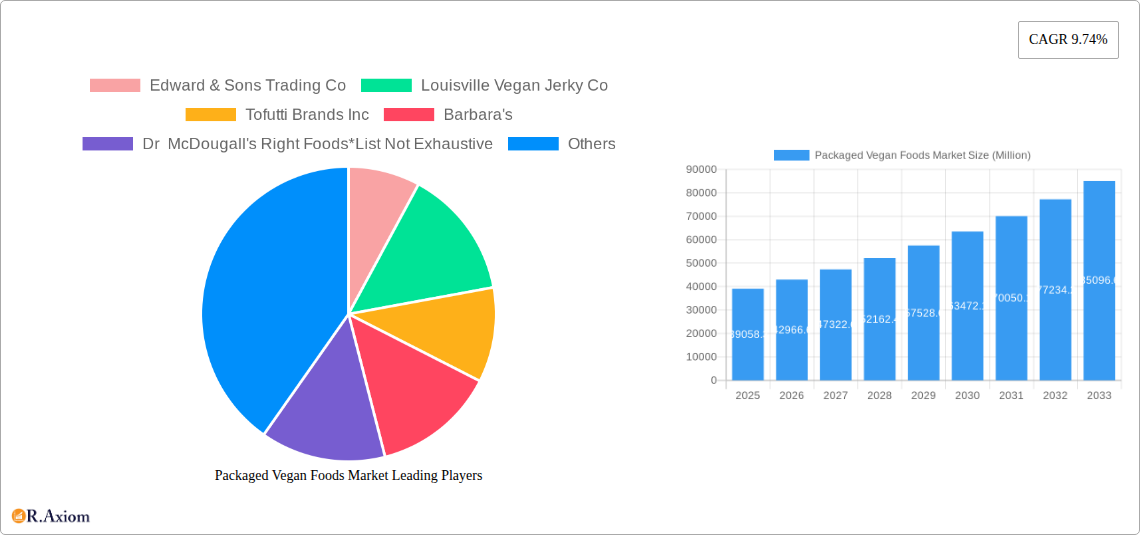
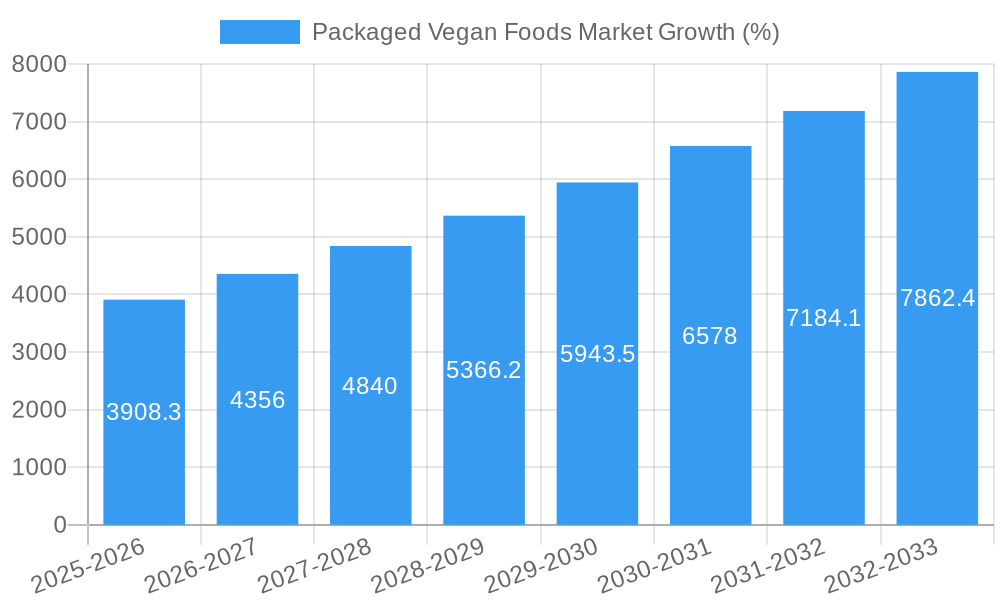
The global packaged vegan foods market, valued at $39,058.3 million in 2025, is projected to experience robust growth, driven by the increasing adoption of vegan and plant-based diets. This surge is fueled by growing consumer awareness of health benefits associated with plant-based foods, rising concerns about animal welfare, and the environmental impact of meat production. Key product segments like dairy alternatives (including plant-based milk, yogurt, and cheese), meat alternatives (vegan burgers, sausages, and jerky), and vegan bakery & confectionery items are experiencing particularly strong demand. The convenience factor offered by pre-packaged vegan foods is also a significant driver, catering to busy lifestyles and increasing demand for ready-to-eat meals. Supermarkets and hypermarkets remain the dominant distribution channels, although online sales are experiencing significant growth, reflecting the increasing popularity of online grocery shopping. Leading companies like Beyond Meat, Danone, and Amy's Kitchen are continuously innovating to meet this escalating demand, introducing new products and expanding their distribution networks. The market's growth trajectory is further reinforced by supportive government regulations promoting sustainable food systems and the increasing availability of vegan products in mainstream retail outlets.
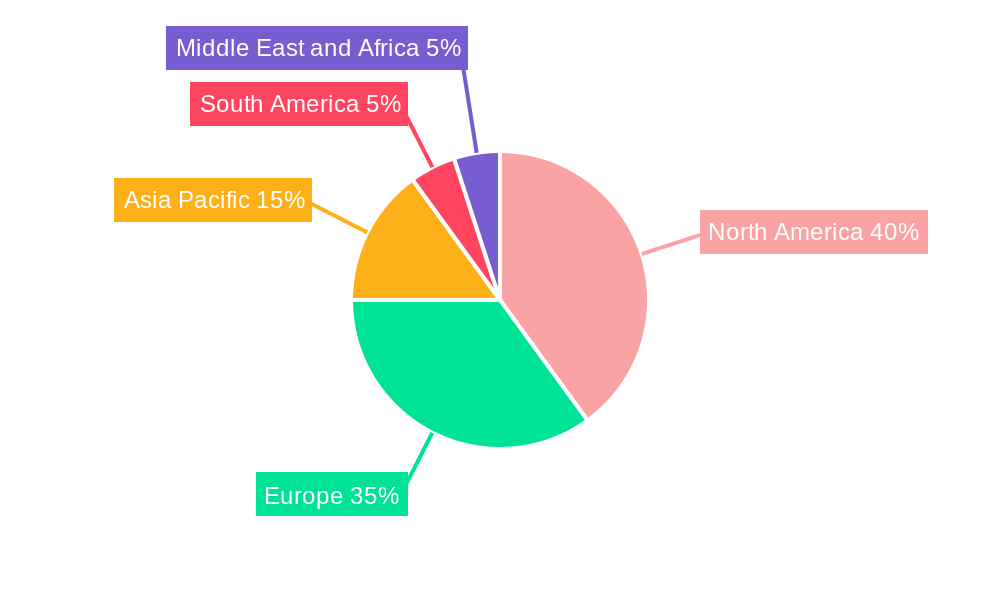
Geographic distribution reveals a substantial market presence in North America and Europe, with significant potential for expansion in the Asia-Pacific region, driven by increasing disposable incomes and changing dietary preferences. However, challenges remain, including the perception of higher prices for vegan products compared to conventional alternatives and overcoming certain taste and texture limitations. Continued research and development efforts focused on improving the taste, texture, and affordability of vegan products are crucial to further penetrating the market and expanding its reach to a broader consumer base. The market’s continued expansion hinges on successful innovation, effective marketing strategies that address consumer concerns, and the establishment of robust supply chains to support increasing demand. This balanced approach will be key to fulfilling the substantial growth potential of the packaged vegan foods market in the coming years.
Packaged Vegan Foods Market: A Comprehensive Market Report (2019-2033)
This comprehensive report provides an in-depth analysis of the Packaged Vegan Foods Market, offering invaluable insights for industry stakeholders, investors, and businesses seeking to capitalize on this rapidly expanding sector. The study period covers 2019-2033, with 2025 as the base and estimated year, and a forecast period of 2025-2033. The historical period analyzed is 2019-2024. The report utilizes a robust methodology to project a market size of xx Million by 2033, exhibiting a CAGR of xx% during the forecast period. Key players like Edward & Sons Trading Co, Louisville Vegan Jerky Co, Tofutti Brands Inc, Barbara's, Dr McDougall's Right Foods, Follow Your Heart, Danone S.A, Annie's Homegrown Inc, Beyond Meat, and Amy's Kitchen Inc are analyzed, though the list is not exhaustive.
Packaged Vegan Foods Market Concentration & Innovation
The Packaged Vegan Foods Market exhibits a moderately consolidated structure, with key players holding significant market share. Market share data for 2024 reveals that the top five players collectively account for approximately xx% of the market. However, the market is also characterized by a high level of innovation, driven by consumer demand for diverse, healthy, and sustainable food options.
- Innovation Drivers: The rising popularity of veganism, coupled with advancements in food technology (e.g., plant-based meat alternatives mimicking texture and taste of animal products), fuels significant product innovation.
- Regulatory Frameworks: Government regulations regarding labeling, food safety, and sustainability standards influence market dynamics and create opportunities for compliant and ethically sourced products.
- Product Substitutes: The market faces competition from traditional food products, but the growing appeal of veganism offsets this challenge.
- End-User Trends: Health-conscious consumers, environmental concerns, and ethical considerations contribute to the increased demand for packaged vegan foods.
- M&A Activities: The market has witnessed several mergers and acquisitions in recent years, with deal values ranging from xx Million to xx Million. These activities reflect the increasing strategic importance of the sector and its growth potential. Consolidation amongst key players is expected to continue.
Packaged Vegan Foods Market Industry Trends & Insights
The Packaged Vegan Foods Market is experiencing robust growth, propelled by several key factors. The rising adoption of vegan and vegetarian lifestyles globally is a primary driver, along with increasing health consciousness and awareness of environmental sustainability. Technological advancements have significantly improved the taste, texture, and nutritional profile of vegan products, further boosting market appeal. This is reflected in the impressive market penetration of vegan products across various categories, estimated at xx% in 2024.
The market is further shaped by evolving consumer preferences, with demand for convenient, ready-to-eat meals and snacks growing steadily. Competitive dynamics are intense, with established food companies and new entrants vying for market share through product differentiation, branding, and strategic partnerships. The market's CAGR from 2025 to 2033 is projected to be xx%, showcasing substantial growth potential. The increasing availability of vegan products in diverse retail channels also contributes to this growth, as does the rise of online grocery shopping.
Dominant Markets & Segments in Packaged Vegan Foods Market
The North American market currently holds the leading position in the Packaged Vegan Foods Market, followed by Europe and Asia-Pacific. Within North America, the United States exhibits the highest consumption.
By Product Type:
- Meat alternatives & packaged vegan meals: This segment dominates the market due to the increasing demand for convenient and protein-rich alternatives to meat-based products.
- Dairy alternatives: This segment exhibits strong growth driven by the rising popularity of plant-based milk, yogurt, and cheese alternatives.
- Vegan bakery & confectionery products: This segment shows significant potential with increasing demand for vegan cakes, cookies, and chocolates.
By Distribution Channel:
- Supermarket/Hypermarkets: This channel remains dominant due to its widespread reach and established distribution networks.
- Online Stores: The online segment exhibits rapid growth, reflecting the increasing adoption of e-commerce for grocery shopping.
Key Drivers for Market Dominance:
- Strong consumer base: High awareness of veganism, health consciousness, and environmental concerns.
- Established infrastructure: Well-developed retail networks and logistics systems.
- Supportive government policies: Regulations encouraging plant-based options and sustainable food production.
Packaged Vegan Foods Market Product Developments
Recent product innovations focus on enhancing the taste, texture, and nutritional value of vegan products to match or exceed those of their conventional counterparts. Technological advancements in plant-based protein sources, improved processing techniques, and the use of natural flavorings are key aspects of this. These innovations cater to evolving consumer preferences for healthier, more convenient, and sustainable food options, creating a competitive advantage for companies offering superior products.
Report Scope & Segmentation Analysis
This report segments the Packaged Vegan Foods Market by product type (dairy alternatives, meat alternatives & packaged vegan meals, vegan bakery & confectionery products, others) and distribution channel (supermarket/hypermarkets, convenience stores, online stores, others). Each segment's growth projections, market size, and competitive dynamics are analyzed. The market size for each segment is projected to grow significantly during the forecast period, with meat alternatives and dairy alternatives leading the growth, followed by vegan bakery products. The online distribution channel is experiencing the highest growth rate.
Key Drivers of Packaged Vegan Foods Market Growth
The Packaged Vegan Foods Market's growth is propelled by several key factors:
- Rising Veganism: Growing consumer adoption of vegan and vegetarian lifestyles.
- Health Consciousness: Increased awareness of the health benefits of plant-based diets.
- Environmental Concerns: Growing preference for sustainable and environmentally friendly food choices.
- Technological Advancements: Innovations in plant-based protein sources and food processing techniques.
Challenges in the Packaged Vegan Foods Market Sector
The Packaged Vegan Foods Market faces certain challenges:
- Price Competitiveness: Vegan products can sometimes be more expensive than conventional options.
- Taste and Texture: Matching the taste and texture of traditional animal products remains a challenge for some vegan food items.
- Supply Chain Issues: Securing consistent supply of raw materials can be a logistical challenge.
Emerging Opportunities in Packaged Vegan Foods Market
Emerging opportunities include:
- Expansion into New Markets: Untapped potential exists in developing countries with growing middle classes.
- Product Diversification: Innovative product development in areas like vegan seafood and ready-to-eat meals.
- Sustainable Packaging: Increased demand for environmentally friendly packaging options.
Leading Players in the Packaged Vegan Foods Market Market
- Edward & Sons Trading Co
- Louisville Vegan Jerky Co
- Tofutti Brands Inc
- Barbara's
- Dr McDougall's Right Foods
- Follow Your Heart
- Danone S.A
- Annie's Homegrown Inc
- Beyond Meat
- Amy's Kitchen Inc
Key Developments in Packaged Vegan Foods Market Industry
- Jan 2023: Beyond Meat launches a new line of plant-based sausages.
- Apr 2024: Danone acquires a leading vegan yogurt producer.
- Oct 2024: Amy's Kitchen introduces a new range of organic vegan meals.
Strategic Outlook for Packaged Vegan Foods Market Market
The Packaged Vegan Foods Market is poised for continued expansion, driven by strong growth catalysts such as increasing consumer demand for plant-based products and continuous innovation in food technology. Expanding into new geographic markets and developing innovative products tailored to specific consumer preferences will be key strategies for success. The market's potential is vast, and businesses with a strong focus on sustainability, quality, and innovation are well-positioned to capitalize on the growing opportunities.
Packaged Vegan Foods Market Segmentation
-
1. Product Type
- 1.1. Dairy alternatives
- 1.2. Meat alternatives & packaged vegan meals
- 1.3. Vegan bakery & confectionery products
- 1.4. Others
-
2. Distribution Channel
- 2.1. Supermarket/ Hypermarkets
- 2.2. Convenience Stores
- 2.3. Online Stores
- 2.4. Others
Packaged Vegan Foods Market Segmentation By Geography
-
1. North America
- 1.1. United States
- 1.2. Canada
- 1.3. Mexico
- 1.4. Rest of North America
-
2. Europe
- 2.1. Spain
- 2.2. United Kingdom
- 2.3. Germany
- 2.4. France
- 2.5. Italy
- 2.6. Russia
- 2.7. Rest of Europe
-
3. Asia Pacific
- 3.1. China
- 3.2. Japan
- 3.3. India
- 3.4. Australia
- 3.5. Rest of Asia Pacific
-
4. South America
- 4.1. Brazil
- 4.2. Argentina
- 4.3. Rest of South America
-
5. Middle East and Africa
- 5.1. South Africa
- 5.2. Saudi Arabia
- 5.3. Rest of Middle East and Africa
Packaged Vegan Foods Market REPORT HIGHLIGHTS
| Aspects | Details |
|---|---|
| Study Period | 2019-2033 |
| Base Year | 2024 |
| Estimated Year | 2025 |
| Forecast Period | 2025-2033 |
| Historical Period | 2019-2024 |
| Growth Rate | CAGR of 9.74% from 2019-2033 |
| Segmentation |
|
Table of Contents
- 1. Introduction
- 1.1. Research Scope
- 1.2. Market Segmentation
- 1.3. Research Methodology
- 1.4. Definitions and Assumptions
- 2. Executive Summary
- 2.1. Introduction
- 3. Market Dynamics
- 3.1. Introduction
- 3.2. Market Drivers
- 3.2.1. Growing Demand for Nutricosmetics Among Millennials; Growing Beauty and Wellness Trend
- 3.3. Market Restrains
- 3.3.1. Stringent Government Regulations and Product Guidelines
- 3.4. Market Trends
- 3.4.1. Plant-based Meat Substitutes are Gaining Significance
- 4. Market Factor Analysis
- 4.1. Porters Five Forces
- 4.2. Supply/Value Chain
- 4.3. PESTEL analysis
- 4.4. Market Entropy
- 4.5. Patent/Trademark Analysis
- 5. Global Packaged Vegan Foods Market Analysis, Insights and Forecast, 2019-2031
- 5.1. Market Analysis, Insights and Forecast - by Product Type
- 5.1.1. Dairy alternatives
- 5.1.2. Meat alternatives & packaged vegan meals
- 5.1.3. Vegan bakery & confectionery products
- 5.1.4. Others
- 5.2. Market Analysis, Insights and Forecast - by Distribution Channel
- 5.2.1. Supermarket/ Hypermarkets
- 5.2.2. Convenience Stores
- 5.2.3. Online Stores
- 5.2.4. Others
- 5.3. Market Analysis, Insights and Forecast - by Region
- 5.3.1. North America
- 5.3.2. Europe
- 5.3.3. Asia Pacific
- 5.3.4. South America
- 5.3.5. Middle East and Africa
- 5.1. Market Analysis, Insights and Forecast - by Product Type
- 6. North America Packaged Vegan Foods Market Analysis, Insights and Forecast, 2019-2031
- 6.1. Market Analysis, Insights and Forecast - by Product Type
- 6.1.1. Dairy alternatives
- 6.1.2. Meat alternatives & packaged vegan meals
- 6.1.3. Vegan bakery & confectionery products
- 6.1.4. Others
- 6.2. Market Analysis, Insights and Forecast - by Distribution Channel
- 6.2.1. Supermarket/ Hypermarkets
- 6.2.2. Convenience Stores
- 6.2.3. Online Stores
- 6.2.4. Others
- 6.1. Market Analysis, Insights and Forecast - by Product Type
- 7. Europe Packaged Vegan Foods Market Analysis, Insights and Forecast, 2019-2031
- 7.1. Market Analysis, Insights and Forecast - by Product Type
- 7.1.1. Dairy alternatives
- 7.1.2. Meat alternatives & packaged vegan meals
- 7.1.3. Vegan bakery & confectionery products
- 7.1.4. Others
- 7.2. Market Analysis, Insights and Forecast - by Distribution Channel
- 7.2.1. Supermarket/ Hypermarkets
- 7.2.2. Convenience Stores
- 7.2.3. Online Stores
- 7.2.4. Others
- 7.1. Market Analysis, Insights and Forecast - by Product Type
- 8. Asia Pacific Packaged Vegan Foods Market Analysis, Insights and Forecast, 2019-2031
- 8.1. Market Analysis, Insights and Forecast - by Product Type
- 8.1.1. Dairy alternatives
- 8.1.2. Meat alternatives & packaged vegan meals
- 8.1.3. Vegan bakery & confectionery products
- 8.1.4. Others
- 8.2. Market Analysis, Insights and Forecast - by Distribution Channel
- 8.2.1. Supermarket/ Hypermarkets
- 8.2.2. Convenience Stores
- 8.2.3. Online Stores
- 8.2.4. Others
- 8.1. Market Analysis, Insights and Forecast - by Product Type
- 9. South America Packaged Vegan Foods Market Analysis, Insights and Forecast, 2019-2031
- 9.1. Market Analysis, Insights and Forecast - by Product Type
- 9.1.1. Dairy alternatives
- 9.1.2. Meat alternatives & packaged vegan meals
- 9.1.3. Vegan bakery & confectionery products
- 9.1.4. Others
- 9.2. Market Analysis, Insights and Forecast - by Distribution Channel
- 9.2.1. Supermarket/ Hypermarkets
- 9.2.2. Convenience Stores
- 9.2.3. Online Stores
- 9.2.4. Others
- 9.1. Market Analysis, Insights and Forecast - by Product Type
- 10. Middle East and Africa Packaged Vegan Foods Market Analysis, Insights and Forecast, 2019-2031
- 10.1. Market Analysis, Insights and Forecast - by Product Type
- 10.1.1. Dairy alternatives
- 10.1.2. Meat alternatives & packaged vegan meals
- 10.1.3. Vegan bakery & confectionery products
- 10.1.4. Others
- 10.2. Market Analysis, Insights and Forecast - by Distribution Channel
- 10.2.1. Supermarket/ Hypermarkets
- 10.2.2. Convenience Stores
- 10.2.3. Online Stores
- 10.2.4. Others
- 10.1. Market Analysis, Insights and Forecast - by Product Type
- 11. North America Packaged Vegan Foods Market Analysis, Insights and Forecast, 2019-2031
- 11.1. Market Analysis, Insights and Forecast - By Country/Sub-region
- 11.1.1 United States
- 11.1.2 Canada
- 11.1.3 Mexico
- 11.1.4 Rest of North America
- 12. Europe Packaged Vegan Foods Market Analysis, Insights and Forecast, 2019-2031
- 12.1. Market Analysis, Insights and Forecast - By Country/Sub-region
- 12.1.1 Spain
- 12.1.2 United Kingdom
- 12.1.3 Germany
- 12.1.4 France
- 12.1.5 Italy
- 12.1.6 Russia
- 12.1.7 Rest of Europe
- 13. Asia Pacific Packaged Vegan Foods Market Analysis, Insights and Forecast, 2019-2031
- 13.1. Market Analysis, Insights and Forecast - By Country/Sub-region
- 13.1.1 China
- 13.1.2 Japan
- 13.1.3 India
- 13.1.4 Australia
- 13.1.5 Rest of Asia Pacific
- 14. South America Packaged Vegan Foods Market Analysis, Insights and Forecast, 2019-2031
- 14.1. Market Analysis, Insights and Forecast - By Country/Sub-region
- 14.1.1 Brazil
- 14.1.2 Argentina
- 14.1.3 Rest of South America
- 15. Middle East and Africa Packaged Vegan Foods Market Analysis, Insights and Forecast, 2019-2031
- 15.1. Market Analysis, Insights and Forecast - By Country/Sub-region
- 15.1.1 South Africa
- 15.1.2 Saudi Arabia
- 15.1.3 Rest of Middle East and Africa
- 16. Competitive Analysis
- 16.1. Global Market Share Analysis 2024
- 16.2. Company Profiles
- 16.2.1 Edward & Sons Trading Co
- 16.2.1.1. Overview
- 16.2.1.2. Products
- 16.2.1.3. SWOT Analysis
- 16.2.1.4. Recent Developments
- 16.2.1.5. Financials (Based on Availability)
- 16.2.2 Louisville Vegan Jerky Co
- 16.2.2.1. Overview
- 16.2.2.2. Products
- 16.2.2.3. SWOT Analysis
- 16.2.2.4. Recent Developments
- 16.2.2.5. Financials (Based on Availability)
- 16.2.3 Tofutti Brands Inc
- 16.2.3.1. Overview
- 16.2.3.2. Products
- 16.2.3.3. SWOT Analysis
- 16.2.3.4. Recent Developments
- 16.2.3.5. Financials (Based on Availability)
- 16.2.4 Barbara's
- 16.2.4.1. Overview
- 16.2.4.2. Products
- 16.2.4.3. SWOT Analysis
- 16.2.4.4. Recent Developments
- 16.2.4.5. Financials (Based on Availability)
- 16.2.5 Dr McDougall's Right Foods*List Not Exhaustive
- 16.2.5.1. Overview
- 16.2.5.2. Products
- 16.2.5.3. SWOT Analysis
- 16.2.5.4. Recent Developments
- 16.2.5.5. Financials (Based on Availability)
- 16.2.6 Follow Your Heart
- 16.2.6.1. Overview
- 16.2.6.2. Products
- 16.2.6.3. SWOT Analysis
- 16.2.6.4. Recent Developments
- 16.2.6.5. Financials (Based on Availability)
- 16.2.7 Danone S A
- 16.2.7.1. Overview
- 16.2.7.2. Products
- 16.2.7.3. SWOT Analysis
- 16.2.7.4. Recent Developments
- 16.2.7.5. Financials (Based on Availability)
- 16.2.8 Annie's Homegrown Inc
- 16.2.8.1. Overview
- 16.2.8.2. Products
- 16.2.8.3. SWOT Analysis
- 16.2.8.4. Recent Developments
- 16.2.8.5. Financials (Based on Availability)
- 16.2.9 Beyond Meat
- 16.2.9.1. Overview
- 16.2.9.2. Products
- 16.2.9.3. SWOT Analysis
- 16.2.9.4. Recent Developments
- 16.2.9.5. Financials (Based on Availability)
- 16.2.10 Amy's Kitchen Inc
- 16.2.10.1. Overview
- 16.2.10.2. Products
- 16.2.10.3. SWOT Analysis
- 16.2.10.4. Recent Developments
- 16.2.10.5. Financials (Based on Availability)
- 16.2.1 Edward & Sons Trading Co
List of Figures
- Figure 1: Global Packaged Vegan Foods Market Revenue Breakdown (Million, %) by Region 2024 & 2032
- Figure 2: Global Packaged Vegan Foods Market Volume Breakdown (K Units, %) by Region 2024 & 2032
- Figure 3: North America Packaged Vegan Foods Market Revenue (Million), by Country 2024 & 2032
- Figure 4: North America Packaged Vegan Foods Market Volume (K Units), by Country 2024 & 2032
- Figure 5: North America Packaged Vegan Foods Market Revenue Share (%), by Country 2024 & 2032
- Figure 6: North America Packaged Vegan Foods Market Volume Share (%), by Country 2024 & 2032
- Figure 7: Europe Packaged Vegan Foods Market Revenue (Million), by Country 2024 & 2032
- Figure 8: Europe Packaged Vegan Foods Market Volume (K Units), by Country 2024 & 2032
- Figure 9: Europe Packaged Vegan Foods Market Revenue Share (%), by Country 2024 & 2032
- Figure 10: Europe Packaged Vegan Foods Market Volume Share (%), by Country 2024 & 2032
- Figure 11: Asia Pacific Packaged Vegan Foods Market Revenue (Million), by Country 2024 & 2032
- Figure 12: Asia Pacific Packaged Vegan Foods Market Volume (K Units), by Country 2024 & 2032
- Figure 13: Asia Pacific Packaged Vegan Foods Market Revenue Share (%), by Country 2024 & 2032
- Figure 14: Asia Pacific Packaged Vegan Foods Market Volume Share (%), by Country 2024 & 2032
- Figure 15: South America Packaged Vegan Foods Market Revenue (Million), by Country 2024 & 2032
- Figure 16: South America Packaged Vegan Foods Market Volume (K Units), by Country 2024 & 2032
- Figure 17: South America Packaged Vegan Foods Market Revenue Share (%), by Country 2024 & 2032
- Figure 18: South America Packaged Vegan Foods Market Volume Share (%), by Country 2024 & 2032
- Figure 19: Middle East and Africa Packaged Vegan Foods Market Revenue (Million), by Country 2024 & 2032
- Figure 20: Middle East and Africa Packaged Vegan Foods Market Volume (K Units), by Country 2024 & 2032
- Figure 21: Middle East and Africa Packaged Vegan Foods Market Revenue Share (%), by Country 2024 & 2032
- Figure 22: Middle East and Africa Packaged Vegan Foods Market Volume Share (%), by Country 2024 & 2032
- Figure 23: North America Packaged Vegan Foods Market Revenue (Million), by Product Type 2024 & 2032
- Figure 24: North America Packaged Vegan Foods Market Volume (K Units), by Product Type 2024 & 2032
- Figure 25: North America Packaged Vegan Foods Market Revenue Share (%), by Product Type 2024 & 2032
- Figure 26: North America Packaged Vegan Foods Market Volume Share (%), by Product Type 2024 & 2032
- Figure 27: North America Packaged Vegan Foods Market Revenue (Million), by Distribution Channel 2024 & 2032
- Figure 28: North America Packaged Vegan Foods Market Volume (K Units), by Distribution Channel 2024 & 2032
- Figure 29: North America Packaged Vegan Foods Market Revenue Share (%), by Distribution Channel 2024 & 2032
- Figure 30: North America Packaged Vegan Foods Market Volume Share (%), by Distribution Channel 2024 & 2032
- Figure 31: North America Packaged Vegan Foods Market Revenue (Million), by Country 2024 & 2032
- Figure 32: North America Packaged Vegan Foods Market Volume (K Units), by Country 2024 & 2032
- Figure 33: North America Packaged Vegan Foods Market Revenue Share (%), by Country 2024 & 2032
- Figure 34: North America Packaged Vegan Foods Market Volume Share (%), by Country 2024 & 2032
- Figure 35: Europe Packaged Vegan Foods Market Revenue (Million), by Product Type 2024 & 2032
- Figure 36: Europe Packaged Vegan Foods Market Volume (K Units), by Product Type 2024 & 2032
- Figure 37: Europe Packaged Vegan Foods Market Revenue Share (%), by Product Type 2024 & 2032
- Figure 38: Europe Packaged Vegan Foods Market Volume Share (%), by Product Type 2024 & 2032
- Figure 39: Europe Packaged Vegan Foods Market Revenue (Million), by Distribution Channel 2024 & 2032
- Figure 40: Europe Packaged Vegan Foods Market Volume (K Units), by Distribution Channel 2024 & 2032
- Figure 41: Europe Packaged Vegan Foods Market Revenue Share (%), by Distribution Channel 2024 & 2032
- Figure 42: Europe Packaged Vegan Foods Market Volume Share (%), by Distribution Channel 2024 & 2032
- Figure 43: Europe Packaged Vegan Foods Market Revenue (Million), by Country 2024 & 2032
- Figure 44: Europe Packaged Vegan Foods Market Volume (K Units), by Country 2024 & 2032
- Figure 45: Europe Packaged Vegan Foods Market Revenue Share (%), by Country 2024 & 2032
- Figure 46: Europe Packaged Vegan Foods Market Volume Share (%), by Country 2024 & 2032
- Figure 47: Asia Pacific Packaged Vegan Foods Market Revenue (Million), by Product Type 2024 & 2032
- Figure 48: Asia Pacific Packaged Vegan Foods Market Volume (K Units), by Product Type 2024 & 2032
- Figure 49: Asia Pacific Packaged Vegan Foods Market Revenue Share (%), by Product Type 2024 & 2032
- Figure 50: Asia Pacific Packaged Vegan Foods Market Volume Share (%), by Product Type 2024 & 2032
- Figure 51: Asia Pacific Packaged Vegan Foods Market Revenue (Million), by Distribution Channel 2024 & 2032
- Figure 52: Asia Pacific Packaged Vegan Foods Market Volume (K Units), by Distribution Channel 2024 & 2032
- Figure 53: Asia Pacific Packaged Vegan Foods Market Revenue Share (%), by Distribution Channel 2024 & 2032
- Figure 54: Asia Pacific Packaged Vegan Foods Market Volume Share (%), by Distribution Channel 2024 & 2032
- Figure 55: Asia Pacific Packaged Vegan Foods Market Revenue (Million), by Country 2024 & 2032
- Figure 56: Asia Pacific Packaged Vegan Foods Market Volume (K Units), by Country 2024 & 2032
- Figure 57: Asia Pacific Packaged Vegan Foods Market Revenue Share (%), by Country 2024 & 2032
- Figure 58: Asia Pacific Packaged Vegan Foods Market Volume Share (%), by Country 2024 & 2032
- Figure 59: South America Packaged Vegan Foods Market Revenue (Million), by Product Type 2024 & 2032
- Figure 60: South America Packaged Vegan Foods Market Volume (K Units), by Product Type 2024 & 2032
- Figure 61: South America Packaged Vegan Foods Market Revenue Share (%), by Product Type 2024 & 2032
- Figure 62: South America Packaged Vegan Foods Market Volume Share (%), by Product Type 2024 & 2032
- Figure 63: South America Packaged Vegan Foods Market Revenue (Million), by Distribution Channel 2024 & 2032
- Figure 64: South America Packaged Vegan Foods Market Volume (K Units), by Distribution Channel 2024 & 2032
- Figure 65: South America Packaged Vegan Foods Market Revenue Share (%), by Distribution Channel 2024 & 2032
- Figure 66: South America Packaged Vegan Foods Market Volume Share (%), by Distribution Channel 2024 & 2032
- Figure 67: South America Packaged Vegan Foods Market Revenue (Million), by Country 2024 & 2032
- Figure 68: South America Packaged Vegan Foods Market Volume (K Units), by Country 2024 & 2032
- Figure 69: South America Packaged Vegan Foods Market Revenue Share (%), by Country 2024 & 2032
- Figure 70: South America Packaged Vegan Foods Market Volume Share (%), by Country 2024 & 2032
- Figure 71: Middle East and Africa Packaged Vegan Foods Market Revenue (Million), by Product Type 2024 & 2032
- Figure 72: Middle East and Africa Packaged Vegan Foods Market Volume (K Units), by Product Type 2024 & 2032
- Figure 73: Middle East and Africa Packaged Vegan Foods Market Revenue Share (%), by Product Type 2024 & 2032
- Figure 74: Middle East and Africa Packaged Vegan Foods Market Volume Share (%), by Product Type 2024 & 2032
- Figure 75: Middle East and Africa Packaged Vegan Foods Market Revenue (Million), by Distribution Channel 2024 & 2032
- Figure 76: Middle East and Africa Packaged Vegan Foods Market Volume (K Units), by Distribution Channel 2024 & 2032
- Figure 77: Middle East and Africa Packaged Vegan Foods Market Revenue Share (%), by Distribution Channel 2024 & 2032
- Figure 78: Middle East and Africa Packaged Vegan Foods Market Volume Share (%), by Distribution Channel 2024 & 2032
- Figure 79: Middle East and Africa Packaged Vegan Foods Market Revenue (Million), by Country 2024 & 2032
- Figure 80: Middle East and Africa Packaged Vegan Foods Market Volume (K Units), by Country 2024 & 2032
- Figure 81: Middle East and Africa Packaged Vegan Foods Market Revenue Share (%), by Country 2024 & 2032
- Figure 82: Middle East and Africa Packaged Vegan Foods Market Volume Share (%), by Country 2024 & 2032
List of Tables
- Table 1: Global Packaged Vegan Foods Market Revenue Million Forecast, by Region 2019 & 2032
- Table 2: Global Packaged Vegan Foods Market Volume K Units Forecast, by Region 2019 & 2032
- Table 3: Global Packaged Vegan Foods Market Revenue Million Forecast, by Product Type 2019 & 2032
- Table 4: Global Packaged Vegan Foods Market Volume K Units Forecast, by Product Type 2019 & 2032
- Table 5: Global Packaged Vegan Foods Market Revenue Million Forecast, by Distribution Channel 2019 & 2032
- Table 6: Global Packaged Vegan Foods Market Volume K Units Forecast, by Distribution Channel 2019 & 2032
- Table 7: Global Packaged Vegan Foods Market Revenue Million Forecast, by Region 2019 & 2032
- Table 8: Global Packaged Vegan Foods Market Volume K Units Forecast, by Region 2019 & 2032
- Table 9: Global Packaged Vegan Foods Market Revenue Million Forecast, by Country 2019 & 2032
- Table 10: Global Packaged Vegan Foods Market Volume K Units Forecast, by Country 2019 & 2032
- Table 11: United States Packaged Vegan Foods Market Revenue (Million) Forecast, by Application 2019 & 2032
- Table 12: United States Packaged Vegan Foods Market Volume (K Units) Forecast, by Application 2019 & 2032
- Table 13: Canada Packaged Vegan Foods Market Revenue (Million) Forecast, by Application 2019 & 2032
- Table 14: Canada Packaged Vegan Foods Market Volume (K Units) Forecast, by Application 2019 & 2032
- Table 15: Mexico Packaged Vegan Foods Market Revenue (Million) Forecast, by Application 2019 & 2032
- Table 16: Mexico Packaged Vegan Foods Market Volume (K Units) Forecast, by Application 2019 & 2032
- Table 17: Rest of North America Packaged Vegan Foods Market Revenue (Million) Forecast, by Application 2019 & 2032
- Table 18: Rest of North America Packaged Vegan Foods Market Volume (K Units) Forecast, by Application 2019 & 2032
- Table 19: Global Packaged Vegan Foods Market Revenue Million Forecast, by Country 2019 & 2032
- Table 20: Global Packaged Vegan Foods Market Volume K Units Forecast, by Country 2019 & 2032
- Table 21: Spain Packaged Vegan Foods Market Revenue (Million) Forecast, by Application 2019 & 2032
- Table 22: Spain Packaged Vegan Foods Market Volume (K Units) Forecast, by Application 2019 & 2032
- Table 23: United Kingdom Packaged Vegan Foods Market Revenue (Million) Forecast, by Application 2019 & 2032
- Table 24: United Kingdom Packaged Vegan Foods Market Volume (K Units) Forecast, by Application 2019 & 2032
- Table 25: Germany Packaged Vegan Foods Market Revenue (Million) Forecast, by Application 2019 & 2032
- Table 26: Germany Packaged Vegan Foods Market Volume (K Units) Forecast, by Application 2019 & 2032
- Table 27: France Packaged Vegan Foods Market Revenue (Million) Forecast, by Application 2019 & 2032
- Table 28: France Packaged Vegan Foods Market Volume (K Units) Forecast, by Application 2019 & 2032
- Table 29: Italy Packaged Vegan Foods Market Revenue (Million) Forecast, by Application 2019 & 2032
- Table 30: Italy Packaged Vegan Foods Market Volume (K Units) Forecast, by Application 2019 & 2032
- Table 31: Russia Packaged Vegan Foods Market Revenue (Million) Forecast, by Application 2019 & 2032
- Table 32: Russia Packaged Vegan Foods Market Volume (K Units) Forecast, by Application 2019 & 2032
- Table 33: Rest of Europe Packaged Vegan Foods Market Revenue (Million) Forecast, by Application 2019 & 2032
- Table 34: Rest of Europe Packaged Vegan Foods Market Volume (K Units) Forecast, by Application 2019 & 2032
- Table 35: Global Packaged Vegan Foods Market Revenue Million Forecast, by Country 2019 & 2032
- Table 36: Global Packaged Vegan Foods Market Volume K Units Forecast, by Country 2019 & 2032
- Table 37: China Packaged Vegan Foods Market Revenue (Million) Forecast, by Application 2019 & 2032
- Table 38: China Packaged Vegan Foods Market Volume (K Units) Forecast, by Application 2019 & 2032
- Table 39: Japan Packaged Vegan Foods Market Revenue (Million) Forecast, by Application 2019 & 2032
- Table 40: Japan Packaged Vegan Foods Market Volume (K Units) Forecast, by Application 2019 & 2032
- Table 41: India Packaged Vegan Foods Market Revenue (Million) Forecast, by Application 2019 & 2032
- Table 42: India Packaged Vegan Foods Market Volume (K Units) Forecast, by Application 2019 & 2032
- Table 43: Australia Packaged Vegan Foods Market Revenue (Million) Forecast, by Application 2019 & 2032
- Table 44: Australia Packaged Vegan Foods Market Volume (K Units) Forecast, by Application 2019 & 2032
- Table 45: Rest of Asia Pacific Packaged Vegan Foods Market Revenue (Million) Forecast, by Application 2019 & 2032
- Table 46: Rest of Asia Pacific Packaged Vegan Foods Market Volume (K Units) Forecast, by Application 2019 & 2032
- Table 47: Global Packaged Vegan Foods Market Revenue Million Forecast, by Country 2019 & 2032
- Table 48: Global Packaged Vegan Foods Market Volume K Units Forecast, by Country 2019 & 2032
- Table 49: Brazil Packaged Vegan Foods Market Revenue (Million) Forecast, by Application 2019 & 2032
- Table 50: Brazil Packaged Vegan Foods Market Volume (K Units) Forecast, by Application 2019 & 2032
- Table 51: Argentina Packaged Vegan Foods Market Revenue (Million) Forecast, by Application 2019 & 2032
- Table 52: Argentina Packaged Vegan Foods Market Volume (K Units) Forecast, by Application 2019 & 2032
- Table 53: Rest of South America Packaged Vegan Foods Market Revenue (Million) Forecast, by Application 2019 & 2032
- Table 54: Rest of South America Packaged Vegan Foods Market Volume (K Units) Forecast, by Application 2019 & 2032
- Table 55: Global Packaged Vegan Foods Market Revenue Million Forecast, by Country 2019 & 2032
- Table 56: Global Packaged Vegan Foods Market Volume K Units Forecast, by Country 2019 & 2032
- Table 57: South Africa Packaged Vegan Foods Market Revenue (Million) Forecast, by Application 2019 & 2032
- Table 58: South Africa Packaged Vegan Foods Market Volume (K Units) Forecast, by Application 2019 & 2032
- Table 59: Saudi Arabia Packaged Vegan Foods Market Revenue (Million) Forecast, by Application 2019 & 2032
- Table 60: Saudi Arabia Packaged Vegan Foods Market Volume (K Units) Forecast, by Application 2019 & 2032
- Table 61: Rest of Middle East and Africa Packaged Vegan Foods Market Revenue (Million) Forecast, by Application 2019 & 2032
- Table 62: Rest of Middle East and Africa Packaged Vegan Foods Market Volume (K Units) Forecast, by Application 2019 & 2032
- Table 63: Global Packaged Vegan Foods Market Revenue Million Forecast, by Product Type 2019 & 2032
- Table 64: Global Packaged Vegan Foods Market Volume K Units Forecast, by Product Type 2019 & 2032
- Table 65: Global Packaged Vegan Foods Market Revenue Million Forecast, by Distribution Channel 2019 & 2032
- Table 66: Global Packaged Vegan Foods Market Volume K Units Forecast, by Distribution Channel 2019 & 2032
- Table 67: Global Packaged Vegan Foods Market Revenue Million Forecast, by Country 2019 & 2032
- Table 68: Global Packaged Vegan Foods Market Volume K Units Forecast, by Country 2019 & 2032
- Table 69: United States Packaged Vegan Foods Market Revenue (Million) Forecast, by Application 2019 & 2032
- Table 70: United States Packaged Vegan Foods Market Volume (K Units) Forecast, by Application 2019 & 2032
- Table 71: Canada Packaged Vegan Foods Market Revenue (Million) Forecast, by Application 2019 & 2032
- Table 72: Canada Packaged Vegan Foods Market Volume (K Units) Forecast, by Application 2019 & 2032
- Table 73: Mexico Packaged Vegan Foods Market Revenue (Million) Forecast, by Application 2019 & 2032
- Table 74: Mexico Packaged Vegan Foods Market Volume (K Units) Forecast, by Application 2019 & 2032
- Table 75: Rest of North America Packaged Vegan Foods Market Revenue (Million) Forecast, by Application 2019 & 2032
- Table 76: Rest of North America Packaged Vegan Foods Market Volume (K Units) Forecast, by Application 2019 & 2032
- Table 77: Global Packaged Vegan Foods Market Revenue Million Forecast, by Product Type 2019 & 2032
- Table 78: Global Packaged Vegan Foods Market Volume K Units Forecast, by Product Type 2019 & 2032
- Table 79: Global Packaged Vegan Foods Market Revenue Million Forecast, by Distribution Channel 2019 & 2032
- Table 80: Global Packaged Vegan Foods Market Volume K Units Forecast, by Distribution Channel 2019 & 2032
- Table 81: Global Packaged Vegan Foods Market Revenue Million Forecast, by Country 2019 & 2032
- Table 82: Global Packaged Vegan Foods Market Volume K Units Forecast, by Country 2019 & 2032
- Table 83: Spain Packaged Vegan Foods Market Revenue (Million) Forecast, by Application 2019 & 2032
- Table 84: Spain Packaged Vegan Foods Market Volume (K Units) Forecast, by Application 2019 & 2032
- Table 85: United Kingdom Packaged Vegan Foods Market Revenue (Million) Forecast, by Application 2019 & 2032
- Table 86: United Kingdom Packaged Vegan Foods Market Volume (K Units) Forecast, by Application 2019 & 2032
- Table 87: Germany Packaged Vegan Foods Market Revenue (Million) Forecast, by Application 2019 & 2032
- Table 88: Germany Packaged Vegan Foods Market Volume (K Units) Forecast, by Application 2019 & 2032
- Table 89: France Packaged Vegan Foods Market Revenue (Million) Forecast, by Application 2019 & 2032
- Table 90: France Packaged Vegan Foods Market Volume (K Units) Forecast, by Application 2019 & 2032
- Table 91: Italy Packaged Vegan Foods Market Revenue (Million) Forecast, by Application 2019 & 2032
- Table 92: Italy Packaged Vegan Foods Market Volume (K Units) Forecast, by Application 2019 & 2032
- Table 93: Russia Packaged Vegan Foods Market Revenue (Million) Forecast, by Application 2019 & 2032
- Table 94: Russia Packaged Vegan Foods Market Volume (K Units) Forecast, by Application 2019 & 2032
- Table 95: Rest of Europe Packaged Vegan Foods Market Revenue (Million) Forecast, by Application 2019 & 2032
- Table 96: Rest of Europe Packaged Vegan Foods Market Volume (K Units) Forecast, by Application 2019 & 2032
- Table 97: Global Packaged Vegan Foods Market Revenue Million Forecast, by Product Type 2019 & 2032
- Table 98: Global Packaged Vegan Foods Market Volume K Units Forecast, by Product Type 2019 & 2032
- Table 99: Global Packaged Vegan Foods Market Revenue Million Forecast, by Distribution Channel 2019 & 2032
- Table 100: Global Packaged Vegan Foods Market Volume K Units Forecast, by Distribution Channel 2019 & 2032
- Table 101: Global Packaged Vegan Foods Market Revenue Million Forecast, by Country 2019 & 2032
- Table 102: Global Packaged Vegan Foods Market Volume K Units Forecast, by Country 2019 & 2032
- Table 103: China Packaged Vegan Foods Market Revenue (Million) Forecast, by Application 2019 & 2032
- Table 104: China Packaged Vegan Foods Market Volume (K Units) Forecast, by Application 2019 & 2032
- Table 105: Japan Packaged Vegan Foods Market Revenue (Million) Forecast, by Application 2019 & 2032
- Table 106: Japan Packaged Vegan Foods Market Volume (K Units) Forecast, by Application 2019 & 2032
- Table 107: India Packaged Vegan Foods Market Revenue (Million) Forecast, by Application 2019 & 2032
- Table 108: India Packaged Vegan Foods Market Volume (K Units) Forecast, by Application 2019 & 2032
- Table 109: Australia Packaged Vegan Foods Market Revenue (Million) Forecast, by Application 2019 & 2032
- Table 110: Australia Packaged Vegan Foods Market Volume (K Units) Forecast, by Application 2019 & 2032
- Table 111: Rest of Asia Pacific Packaged Vegan Foods Market Revenue (Million) Forecast, by Application 2019 & 2032
- Table 112: Rest of Asia Pacific Packaged Vegan Foods Market Volume (K Units) Forecast, by Application 2019 & 2032
- Table 113: Global Packaged Vegan Foods Market Revenue Million Forecast, by Product Type 2019 & 2032
- Table 114: Global Packaged Vegan Foods Market Volume K Units Forecast, by Product Type 2019 & 2032
- Table 115: Global Packaged Vegan Foods Market Revenue Million Forecast, by Distribution Channel 2019 & 2032
- Table 116: Global Packaged Vegan Foods Market Volume K Units Forecast, by Distribution Channel 2019 & 2032
- Table 117: Global Packaged Vegan Foods Market Revenue Million Forecast, by Country 2019 & 2032
- Table 118: Global Packaged Vegan Foods Market Volume K Units Forecast, by Country 2019 & 2032
- Table 119: Brazil Packaged Vegan Foods Market Revenue (Million) Forecast, by Application 2019 & 2032
- Table 120: Brazil Packaged Vegan Foods Market Volume (K Units) Forecast, by Application 2019 & 2032
- Table 121: Argentina Packaged Vegan Foods Market Revenue (Million) Forecast, by Application 2019 & 2032
- Table 122: Argentina Packaged Vegan Foods Market Volume (K Units) Forecast, by Application 2019 & 2032
- Table 123: Rest of South America Packaged Vegan Foods Market Revenue (Million) Forecast, by Application 2019 & 2032
- Table 124: Rest of South America Packaged Vegan Foods Market Volume (K Units) Forecast, by Application 2019 & 2032
- Table 125: Global Packaged Vegan Foods Market Revenue Million Forecast, by Product Type 2019 & 2032
- Table 126: Global Packaged Vegan Foods Market Volume K Units Forecast, by Product Type 2019 & 2032
- Table 127: Global Packaged Vegan Foods Market Revenue Million Forecast, by Distribution Channel 2019 & 2032
- Table 128: Global Packaged Vegan Foods Market Volume K Units Forecast, by Distribution Channel 2019 & 2032
- Table 129: Global Packaged Vegan Foods Market Revenue Million Forecast, by Country 2019 & 2032
- Table 130: Global Packaged Vegan Foods Market Volume K Units Forecast, by Country 2019 & 2032
- Table 131: South Africa Packaged Vegan Foods Market Revenue (Million) Forecast, by Application 2019 & 2032
- Table 132: South Africa Packaged Vegan Foods Market Volume (K Units) Forecast, by Application 2019 & 2032
- Table 133: Saudi Arabia Packaged Vegan Foods Market Revenue (Million) Forecast, by Application 2019 & 2032
- Table 134: Saudi Arabia Packaged Vegan Foods Market Volume (K Units) Forecast, by Application 2019 & 2032
- Table 135: Rest of Middle East and Africa Packaged Vegan Foods Market Revenue (Million) Forecast, by Application 2019 & 2032
- Table 136: Rest of Middle East and Africa Packaged Vegan Foods Market Volume (K Units) Forecast, by Application 2019 & 2032
Frequently Asked Questions
1. What is the projected Compound Annual Growth Rate (CAGR) of the Packaged Vegan Foods Market?
The projected CAGR is approximately 9.74%.
2. Which companies are prominent players in the Packaged Vegan Foods Market?
Key companies in the market include Edward & Sons Trading Co, Louisville Vegan Jerky Co, Tofutti Brands Inc, Barbara's, Dr McDougall's Right Foods*List Not Exhaustive, Follow Your Heart, Danone S A, Annie's Homegrown Inc, Beyond Meat, Amy's Kitchen Inc.
3. What are the main segments of the Packaged Vegan Foods Market?
The market segments include Product Type, Distribution Channel.
4. Can you provide details about the market size?
The market size is estimated to be USD 39058.3 Million as of 2022.
5. What are some drivers contributing to market growth?
Growing Demand for Nutricosmetics Among Millennials; Growing Beauty and Wellness Trend.
6. What are the notable trends driving market growth?
Plant-based Meat Substitutes are Gaining Significance.
7. Are there any restraints impacting market growth?
Stringent Government Regulations and Product Guidelines.
8. Can you provide examples of recent developments in the market?
N/A
9. What pricing options are available for accessing the report?
Pricing options include single-user, multi-user, and enterprise licenses priced at USD 4750, USD 5250, and USD 8750 respectively.
10. Is the market size provided in terms of value or volume?
The market size is provided in terms of value, measured in Million and volume, measured in K Units.
11. Are there any specific market keywords associated with the report?
Yes, the market keyword associated with the report is "Packaged Vegan Foods Market," which aids in identifying and referencing the specific market segment covered.
12. How do I determine which pricing option suits my needs best?
The pricing options vary based on user requirements and access needs. Individual users may opt for single-user licenses, while businesses requiring broader access may choose multi-user or enterprise licenses for cost-effective access to the report.
13. Are there any additional resources or data provided in the Packaged Vegan Foods Market report?
While the report offers comprehensive insights, it's advisable to review the specific contents or supplementary materials provided to ascertain if additional resources or data are available.
14. How can I stay updated on further developments or reports in the Packaged Vegan Foods Market?
To stay informed about further developments, trends, and reports in the Packaged Vegan Foods Market, consider subscribing to industry newsletters, following relevant companies and organizations, or regularly checking reputable industry news sources and publications.
Methodology
Step 1 - Identification of Relevant Samples Size from Population Database


Step 2 - Approaches for Defining Global Market Size (Value, Volume* & Price*)

Note*: In applicable scenarios
Step 3 - Data Sources
Primary Research
- Web Analytics
- Survey Reports
- Research Institute
- Latest Research Reports
- Opinion Leaders
Secondary Research
- Annual Reports
- White Paper
- Latest Press Release
- Industry Association
- Paid Database
- Investor Presentations

Step 4 - Data Triangulation
Involves using different sources of information in order to increase the validity of a study
These sources are likely to be stakeholders in a program - participants, other researchers, program staff, other community members, and so on.
Then we put all data in single framework & apply various statistical tools to find out the dynamic on the market.
During the analysis stage, feedback from the stakeholder groups would be compared to determine areas of agreement as well as areas of divergence


