Key Insights
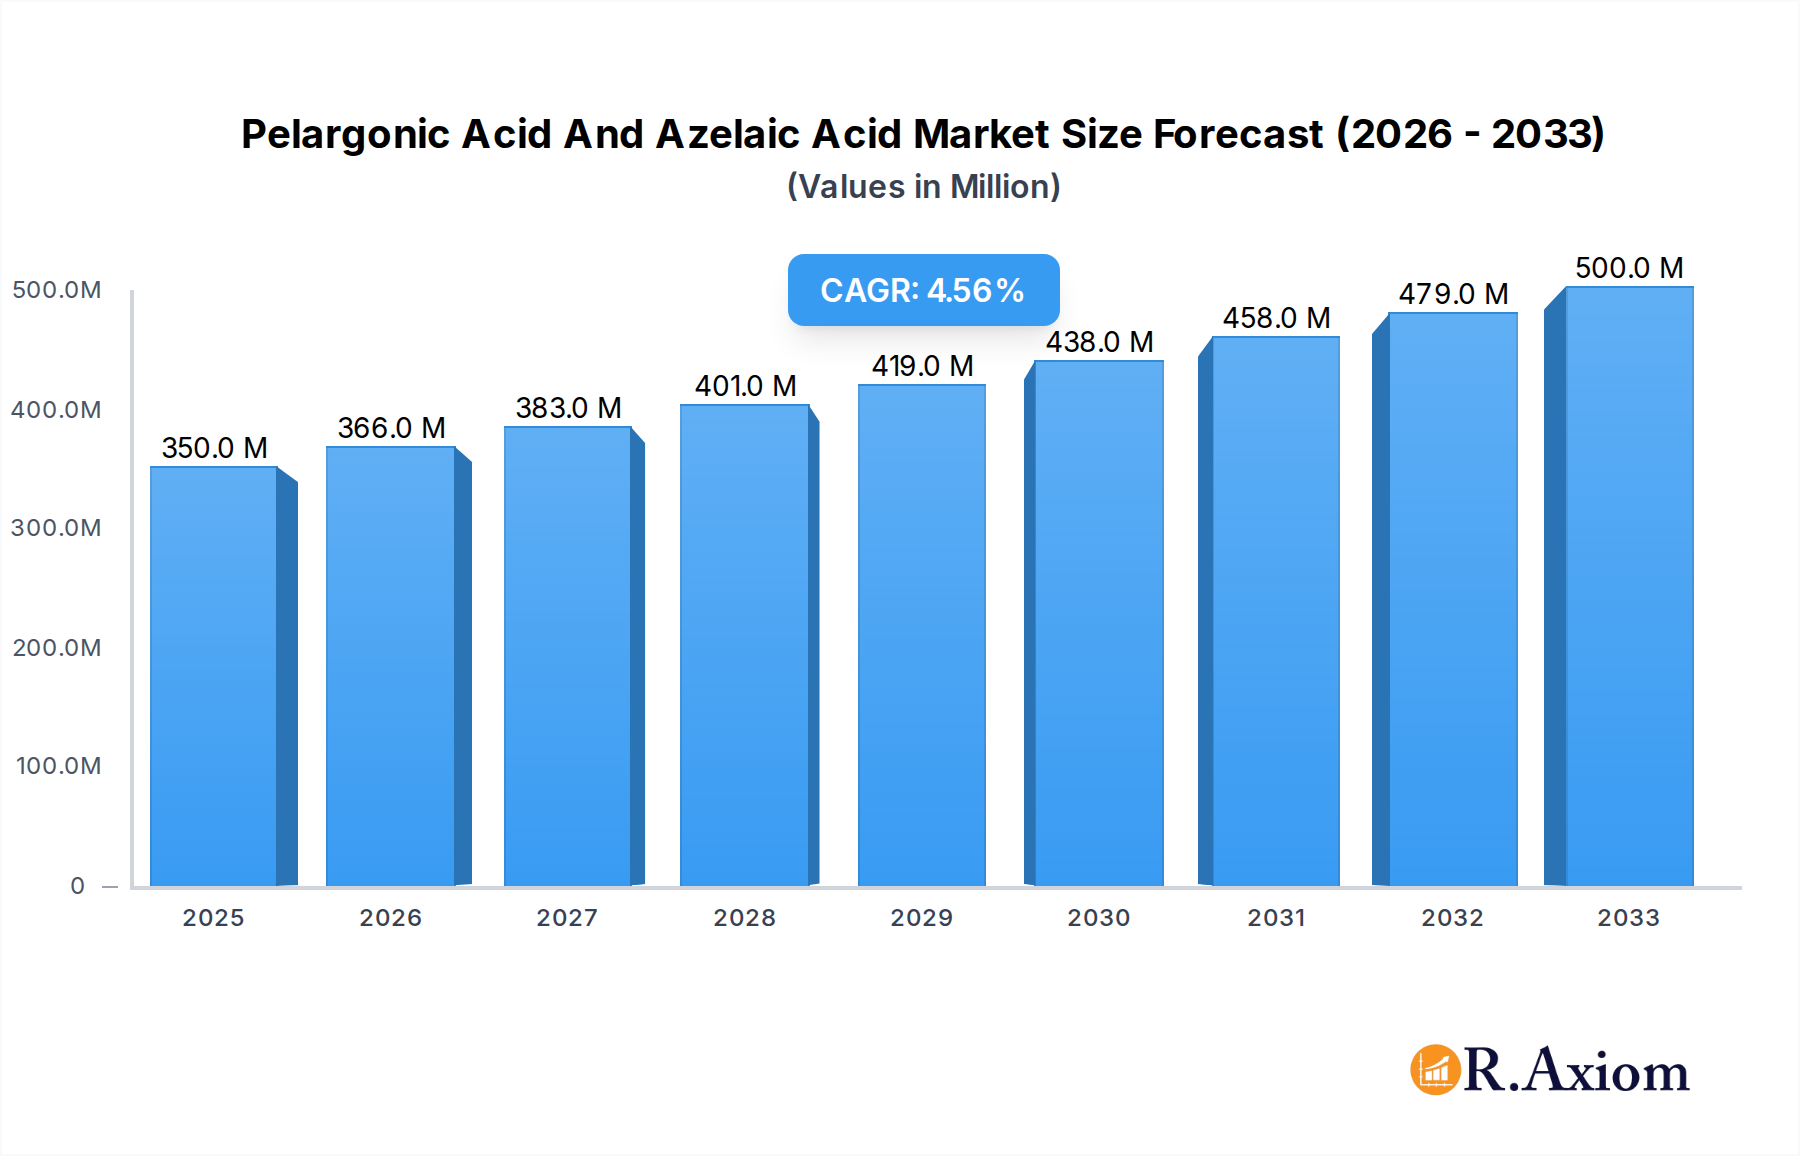
The Pelargonic Acid and Azelaic Acid market is poised for significant expansion, with an estimated market size of $350 million in 2025 and a projected Compound Annual Growth Rate (CAGR) of 4.6% through 2033. This robust growth is underpinned by a confluence of factors, including the increasing demand for bio-based and sustainable ingredients across various industries. Pelargonic acid, a key component, is experiencing a surge in its application as an eco-friendly herbicide and in the production of plasticizers and lubricants, driven by growing environmental regulations and consumer preference for greener alternatives. Similarly, azelaic acid's therapeutic properties are fueling its adoption in pharmaceuticals and cosmetics for treating conditions like acne and rosacea, alongside its use in advanced polymers and coatings. The expansion of the plastics industry, particularly in emerging economies, coupled with the rising demand for high-performance lubricants in the automotive and industrial sectors, are substantial drivers for both acids. Furthermore, the increasing awareness and utilization of these versatile compounds in plant protection products, owing to their efficacy and lower environmental impact compared to traditional chemicals, will continue to bolster market growth.

Pelargonic Acid And Azelaic Acid Market Size (In Million)
The market landscape is characterized by dynamic trends, including innovation in production technologies to enhance yield and reduce costs, and a growing emphasis on the development of derivatives with specialized functionalities. Companies are actively investing in research and development to explore new applications and improve the sustainability profile of pelargonic and azelaic acids. However, certain restraints may impact the pace of growth. Fluctuations in the prices of raw materials, such as vegetable oils and oleochemical feedstocks, can affect production costs and, consequently, market pricing. Additionally, the stringent regulatory frameworks surrounding chemical production and usage in certain regions might pose challenges for market expansion. Despite these potential hurdles, the overarching trend towards sustainable chemistry and the inherent versatility of pelargonic acid and azelaic acid position the market for sustained and healthy growth in the coming years. The market is segmented by application into Plastics, Lubricants, Plant Protection Products, Pharmaceuticals and Cosmetics, and Others, with Type segments including Pelargonic Acid and Azelaic Acid. Key players like BASF, Emery Oleochemicals, and OQ Chemicals are driving innovation and market penetration across major regions such as North America, Europe, and Asia Pacific.
Pelargonic Acid And Azelaic Acid Company Market Share
Pelargonic Acid And Azelaic Acid Market Concentration & Innovation
The global pelargonic acid and azelaic acid market exhibits moderate concentration, with a significant presence of both multinational chemical giants and specialized manufacturers. Key players like BASF, Emery Oleochemicals, and Matrica SpA hold substantial market shares, driven by extensive research and development capabilities and established distribution networks. Innovation in this sector is primarily fueled by the demand for bio-based and sustainable alternatives across various end-use industries. Companies are investing heavily in developing greener production processes for pelargonic acid, often derived from renewable sources like castor oil, and exploring new applications for azelaic acid in pharmaceuticals and cosmetics due to its anti-inflammatory and skin-brightening properties. Regulatory frameworks, particularly those promoting the use of eco-friendly chemicals and tightening restrictions on certain synthetic ingredients, are also shaping innovation trajectories.
- Market Share Metrics: While precise figures fluctuate, leading players are estimated to command a combined market share exceeding 50 million.
- M&A Activities: Significant M&A deals, valued in the tens of millions, are anticipated as larger corporations seek to expand their portfolios and secure intellectual property in these niche but growing chemical segments.
- Innovation Drivers:
- Growing consumer preference for natural and sustainable ingredients.
- Increasing demand for high-performance ingredients in cosmetics and personal care.
- Development of novel applications in agrochemicals and industrial lubricants.
- Stringent environmental regulations favoring bio-derived chemicals.
- Product Substitutes: While direct substitutes are limited, alternative chemicals with similar functionalities in specific applications, such as other organic acids or synthetic alternatives in plastics, pose a moderate competitive threat.
- End-User Trends: A shift towards premium, efficacy-driven cosmetic formulations and the development of advanced, environmentally conscious lubricants are key end-user trends.
- M&A Activities: Strategic acquisitions are expected to consolidate market positions and enhance technological capabilities, with deal values ranging from several million to over fifty million for significant entities.
Pelargonic Acid And Azelaic Acid Industry Trends & Insights
The pelargonic acid and azelaic acid industry is poised for robust growth over the forecast period of 2025–2033, driven by a confluence of escalating demand from diverse end-use sectors and advancements in production technologies. The market is projected to experience a Compound Annual Growth Rate (CAGR) of approximately 6.5%, translating into a market size exceeding 1,500 million by 2033. This expansion is underpinned by the increasing awareness and adoption of sustainable and bio-based chemicals, a trend that strongly favors pelargonic acid derived from renewable feedstocks. Its versatility as a natural herbicide, a key component in lubricant formulations, and a building block for various chemical syntheses positions it for continued market penetration. Similarly, azelaic acid is experiencing a surge in demand within the pharmaceutical and cosmetic industries. Its well-established efficacy in treating dermatological conditions like acne and rosacea, coupled with its emerging role in skin-brightening and anti-aging formulations, is driving significant market penetration in these high-value segments.
Technological disruptions are playing a pivotal role in shaping the industry's landscape. Innovations in oleochemical processing are enabling more efficient and cost-effective extraction and purification of pelargonic acid, thereby enhancing its competitiveness against petrochemical-derived alternatives. Furthermore, advancements in biotechnological pathways for azelaic acid production are opening avenues for more sustainable and scalable manufacturing processes, potentially reducing production costs and broadening its accessibility. Consumer preferences are increasingly leaning towards natural, organic, and scientifically validated ingredients. This is particularly evident in the cosmetics and personal care sector, where consumers are actively seeking out products with proven efficacy and a minimal environmental footprint. Both pelargonic and azelaic acids, with their natural origins and established benefits, align perfectly with these evolving consumer demands.
The competitive dynamics within the pelargonic acid and azelaic acid market are characterized by a blend of established chemical manufacturers and emerging specialty producers. Companies like BASF, Emery Oleochemicals, Matrica SpA, and OQ Chemicals are recognized for their integrated supply chains and broad product portfolios. However, specialized players such as Croda Sipo, Jiangsu Senxuan, Nantong Hengxing, Shandong Clearwill, and Zhengzhou Yibang are carving out significant niches by focusing on specific product grades or innovative applications. Strategic partnerships, mergers, and acquisitions are anticipated to be key strategies for market players looking to expand their geographical reach, diversify their product offerings, and gain a competitive edge. The market penetration for azelaic acid in advanced pharmaceutical applications is projected to rise by over 15% in the next five years, while pelargonic acid's market penetration in the bio-herbicide segment is expected to grow by 10% during the same period. The overall market size is expected to reach approximately 1,650 million by 2033, with a projected CAGR of 6.5%.
Dominant Markets & Segments in Pelargonic Acid And Azelaic Acid
The pelargonic acid and azelaic acid market is characterized by distinct regional dominance and segment leadership, driven by a combination of economic factors, regulatory landscapes, and end-user industry growth. Asia Pacific, particularly China, stands out as a dominant region due to its strong manufacturing base, significant consumption of chemicals in plastics and agriculture, and a growing domestic market for pharmaceuticals and cosmetics. Within Asia Pacific, China's market size for pelargonic and azelaic acids is estimated to be over 400 million, driven by its extensive chemical production infrastructure and robust demand from its vast industrial and consumer base.
Dominant Region & Key Drivers:
- Asia Pacific (China): This region's dominance is fueled by:
- Cost-Competitive Manufacturing: Extensive production facilities offer economies of scale.
- Strong Industrial Demand: Significant consumption in plastics, lubricants, and agrochemicals.
- Growing Middle Class: Increased disposable income drives demand for cosmetics and pharmaceuticals.
- Favorable Government Policies: Support for chemical manufacturing and export initiatives.
- Infrastructure Development: Robust logistics and supply chain networks facilitate market access.
Dominant Application Segments:
- Plastics: This segment is a major consumer of pelargonic acid, primarily as a plasticizer and lubricant in PVC and other polymer applications. The global demand for plastics, particularly in packaging, automotive, and construction, ensures continued growth in this sector. The plastics segment is projected to contribute over 350 million to the market by 2033.
- Key Drivers:
- Versatility of Plastics: Ubiquitous use across various industries.
- Performance Enhancement: Pelargonic acid improves flexibility and processing of polymers.
- Growth in Emerging Economies: Increased construction and manufacturing activities.
- Key Drivers:
- Plant Protection Products: Pelargonic acid's effectiveness as a non-selective, contact herbicide makes it a valuable component in eco-friendly crop protection solutions. The growing demand for sustainable agriculture and the phasing out of more harmful pesticides are key drivers for this segment. This segment is expected to reach over 250 million by 2033.
- Key Drivers:
- Demand for Sustainable Agriculture: Focus on bio-based and environmentally friendly solutions.
- Regulation Against Synthetic Herbicides: Shifting towards safer alternatives.
- Global Food Security Needs: Increased focus on crop yield enhancement.
- Key Drivers:
- Pharmaceuticals and Cosmetics: Azelaic acid is a star ingredient in this segment, highly sought after for its therapeutic benefits in dermatology and its cosmetic properties. The increasing consumer awareness of skin health and the growing market for cosmeceuticals are propelling this segment's growth. This segment is anticipated to be the fastest-growing, reaching over 500 million by 2033.
- Key Drivers:
- Efficacy in Dermatological Treatments: Proven benefits for acne, rosacea, and hyperpigmentation.
- Growth of the Cosmeceutical Market: Consumer demand for "active" ingredients.
- Anti-Aging and Skin Brightening Trends: Increasing popularity of ingredients that address these concerns.
- Natural Ingredient Preference: Azelaic acid's natural origin appeals to consumers.
- Key Drivers:
- Lubricants: Pelargonic acid and its derivatives are used as high-performance lubricants and lubricant additives, particularly in industrial and automotive applications, due to their excellent thermal stability and biodegradability. This segment is projected to contribute over 200 million by 2033.
- Key Drivers:
- Demand for High-Performance Lubricants: Need for efficiency and longevity in machinery.
- Biodegradability Requirements: Increasing environmental regulations for lubricants.
- Growth in Industrial and Automotive Sectors: Sustained demand from these end-use industries.
- Key Drivers:
- Others: This segment encompasses various niche applications, including food additives, chemical intermediates, and specialized industrial processes, contributing a projected 100 million by 2033.
Dominant Type Segments:
- Azelaic Acid: While pelargonic acid has broad industrial applications, azelaic acid's high-value applications in pharmaceuticals and cosmetics are driving its rapid growth and increasing its market share. Its unique therapeutic properties give it a competitive edge in these specialized markets.
- Pelargonic Acid: Remains a dominant force due to its widespread use in plastics and plant protection products, areas with consistent and substantial demand.
The dominance of Asia Pacific, particularly China, is further bolstered by its significant production capacity for both pelargonic and azelaic acids. The United States and Europe also represent substantial markets, driven by advanced pharmaceutical and cosmetic industries and a strong emphasis on sustainable chemical solutions.
Pelargonic Acid And Azelaic Acid Product Developments
Product developments in the pelargonic acid and azelaic acid market are increasingly focused on enhancing purity, sustainability, and expanding application horizons. Manufacturers are investing in advanced purification techniques to produce higher grades of azelaic acid for pharmaceutical and cosmetic use, meeting stringent regulatory requirements and consumer expectations for efficacy and safety. For pelargonic acid, the trend is towards developing bio-based variants derived from renewable feedstocks like castor oil, offering an environmentally friendly alternative to petrochemicals. Innovations also include the development of novel derivatives and formulations that enhance performance in specific applications, such as improved bioavailability for pharmaceutical applications or enhanced herbicidal activity for plant protection products. The competitive advantage lies in offering products with superior performance, better environmental profiles, and targeted functionalities that meet evolving industry needs.
Report Scope & Segmentation Analysis
This report provides a comprehensive analysis of the global pelargonic acid and azelaic acid market, covering historical data from 2019–2024, a base year of 2025, and forecasts up to 2033. The market is segmented by Type and Application.
- Type Segmentation:
- Pelargonic Acid: This segment includes various grades of pelargonic acid, focusing on its applications in plastics, lubricants, and plant protection products. Growth projections are steady, driven by industrial demand. Market size is estimated to be around 800 million in 2025, with a projected CAGR of 5.8%.
- Azelaic Acid: This segment encompasses azelaic acid primarily used in pharmaceuticals and cosmetics. It is expected to witness robust growth due to increasing demand for high-value applications. Market size is estimated at 750 million in 2025, with a projected CAGR of 7.2%.
- Application Segmentation:
- Plastics: This segment is analyzed for its consumption of pelargonic acid as a plasticizer and lubricant. Market size is projected to be 350 million in 2025, with a CAGR of 5.5%.
- Lubricants: This segment covers the use of pelargonic acid in industrial and automotive lubricants. Market size is estimated at 200 million in 2025, with a CAGR of 5.2%.
- Plant Protection Products: This segment focuses on pelargonic acid's role as a bio-herbicide. Market size is projected at 250 million in 2025, with a CAGR of 6.5%.
- Pharmaceuticals and Cosmetics: This segment highlights the significant demand for azelaic acid. Market size is estimated at 500 million in 2025, with a CAGR of 7.5%.
- Others: This segment includes miscellaneous applications for both acids, with a projected market size of 100 million in 2025 and a CAGR of 5.0%.
The analysis will delve into market sizes, growth rates, and competitive dynamics within each segment.
Key Drivers of Pelargonic Acid And Azelaic Acid Growth
The growth of the pelargonic acid and azelaic acid market is propelled by several key factors:
- Rising Demand for Bio-Based and Sustainable Chemicals: Increasing environmental consciousness and regulatory pressures are favoring chemicals derived from renewable resources like pelargonic acid. This trend is significantly boosting its adoption as a sustainable alternative in various industrial applications.
- Growing Pharmaceutical and Cosmetic Industries: Azelaic acid's proven efficacy in treating dermatological conditions and its increasing use in high-end cosmetic formulations are driving substantial demand. The expanding global market for skincare and medical treatments for skin ailments directly translates to higher consumption of azelaic acid.
- Technological Advancements in Production: Innovations in oleochemical processing and biotechnological methods are leading to more efficient, cost-effective, and purer production of both acids, enhancing their market competitiveness and expanding their applicability.
- Expanding Applications in Industrial Sectors: The use of pelargonic acid as a plasticizer, lubricant, and in plant protection products continues to grow, supported by the ongoing expansion of the plastics, automotive, and agricultural industries worldwide.
- Favorable Regulatory Landscape: Government initiatives promoting the use of bio-based products and stricter regulations on certain synthetic chemicals create a conducive environment for the growth of pelargonic and azelaic acids.
Challenges in the Pelargonic Acid And Azelaic Acid Sector
Despite the positive growth trajectory, the pelargonic acid and azelaic acid sector faces certain challenges:
- Price Volatility of Raw Materials: The cost and availability of key feedstocks, particularly those derived from agricultural sources like castor oil for pelargonic acid, can be subject to market fluctuations, impacting production costs and profitability.
- Competition from Synthetic Alternatives: In certain industrial applications, established synthetic chemicals may offer lower initial costs or specific performance advantages, posing a competitive threat, especially in price-sensitive markets.
- Stringent Regulatory Requirements for Pharmaceutical Applications: While beneficial for quality, meeting the rigorous standards for purity and efficacy required for pharmaceutical-grade azelaic acid can be costly and time-consuming for manufacturers.
- Supply Chain Disruptions: Global events, logistical challenges, and geopolitical factors can disrupt the supply chain, affecting the timely delivery of raw materials and finished products, potentially leading to production delays and increased costs.
- Perception and Awareness: For some niche applications or in regions less familiar with bio-based alternatives, there might be a need for greater consumer and industrial awareness regarding the benefits and performance of pelargonic and azelaic acids.
Emerging Opportunities in Pelargonic Acid And Azelaic Acid
The pelargonic acid and azelaic acid market is ripe with emerging opportunities driven by evolving consumer demands and technological advancements:
- Growth in Biodegradable and Eco-Friendly Products: The strong global push towards sustainability creates significant opportunities for bio-based pelargonic acid in lubricants, plastics, and even as a component in biodegradable packaging.
- Expansion of Cosmeceutical Market: The burgeoning cosmeceutical sector, which bridges cosmetics and pharmaceuticals, presents a prime opportunity for azelaic acid due to its scientifically proven skin benefits and natural origin.
- Development of Novel Applications: Ongoing research into new applications, such as advanced materials, specialized coatings, and even in certain food-grade applications, can unlock new market segments for both acids.
- Bio-Herbicide Market Penetration: As regulatory landscapes shift away from synthetic pesticides, the demand for effective and environmentally friendly bio-herbicides like pelargonic acid is expected to surge, particularly in organic farming and urban pest control.
- Strategic Partnerships and Collaborations: Opportunities exist for collaborations between raw material suppliers, chemical manufacturers, and end-users to develop tailor-made solutions and optimize supply chains, driving innovation and market penetration.
Leading Players in the Pelargonic Acid And Azelaic Acid Market
- Emery Oleochemicals
- Matrica SpA
- BASF
- OQ Chemicals
- Croda Sipo
- Jiangsu Senxuan
- Nantong Hengxing
- Shandong Clearwill
- Zhengzhou Yibang
Key Developments in Pelargonic Acid And Azelaic Acid Industry
- 2023: Several manufacturers announced increased investment in sustainable production of pelargonic acid, focusing on castor oil as a primary feedstock.
- 2024: Matrica SpA launched a new high-purity grade of azelaic acid targeted at premium cosmetic formulations, emphasizing enhanced skin benefits.
- 2024: BASF reported on advancements in bio-based plasticizer technologies incorporating pelargonic acid derivatives, aiming for improved performance and sustainability in PVC applications.
- 2024: Emery Oleochemicals expanded its oleochemical production capacity, citing growing demand for pelargonic acid in lubricants and industrial applications.
- 2024: Croda Sipo introduced a new range of azelaic acid-based ingredients designed for sensitive skin formulations in the pharmaceutical and cosmetic sectors.
- 2025 (projected): Anticipated increase in M&A activities as larger players seek to consolidate their market share and acquire innovative technologies in the azelaic acid segment.
- 2025 (projected): Further advancements in enzymatic production methods for azelaic acid are expected, potentially leading to cost reductions and increased market accessibility.
- 2026 (projected): Potential for new product launches focusing on biodegradable lubricants derived from pelargonic acid, responding to tightening environmental regulations.
Strategic Outlook for Pelargonic Acid And Azelaic Acid Market
The strategic outlook for the pelargonic acid and azelaic acid market remains highly positive, driven by the persistent global demand for sustainable and high-performance chemical solutions. The increasing integration of bio-based chemicals into mainstream industrial processes, coupled with the unwavering growth of the pharmaceutical and cosmetic sectors, will act as significant growth catalysts. Companies that focus on innovative, environmentally friendly production methods and develop specialized, high-value applications for both pelargonic and azelaic acids are best positioned for success. Strategic investments in research and development, capacity expansion, and potential mergers and acquisitions will be crucial for market leaders to maintain and enhance their competitive edge. The market's trajectory is set for continued expansion, offering substantial opportunities for stakeholders who can adapt to evolving consumer preferences and regulatory landscapes.
Pelargonic Acid And Azelaic Acid Segmentation
-
1. Application
- 1.1. Plastics
- 1.2. Lubricants
- 1.3. Plant Protection Products
- 1.4. Pharmaceuticals and Cosmetics
- 1.5. Others
-
2. Type
- 2.1. Pelargonic Acid
- 2.2. Azelaic Acid
Pelargonic Acid And Azelaic Acid Segmentation By Geography
-
1. North America
- 1.1. United States
- 1.2. Canada
- 1.3. Mexico
-
2. South America
- 2.1. Brazil
- 2.2. Argentina
- 2.3. Rest of South America
-
3. Europe
- 3.1. United Kingdom
- 3.2. Germany
- 3.3. France
- 3.4. Italy
- 3.5. Spain
- 3.6. Russia
- 3.7. Benelux
- 3.8. Nordics
- 3.9. Rest of Europe
-
4. Middle East & Africa
- 4.1. Turkey
- 4.2. Israel
- 4.3. GCC
- 4.4. North Africa
- 4.5. South Africa
- 4.6. Rest of Middle East & Africa
-
5. Asia Pacific
- 5.1. China
- 5.2. India
- 5.3. Japan
- 5.4. South Korea
- 5.5. ASEAN
- 5.6. Oceania
- 5.7. Rest of Asia Pacific
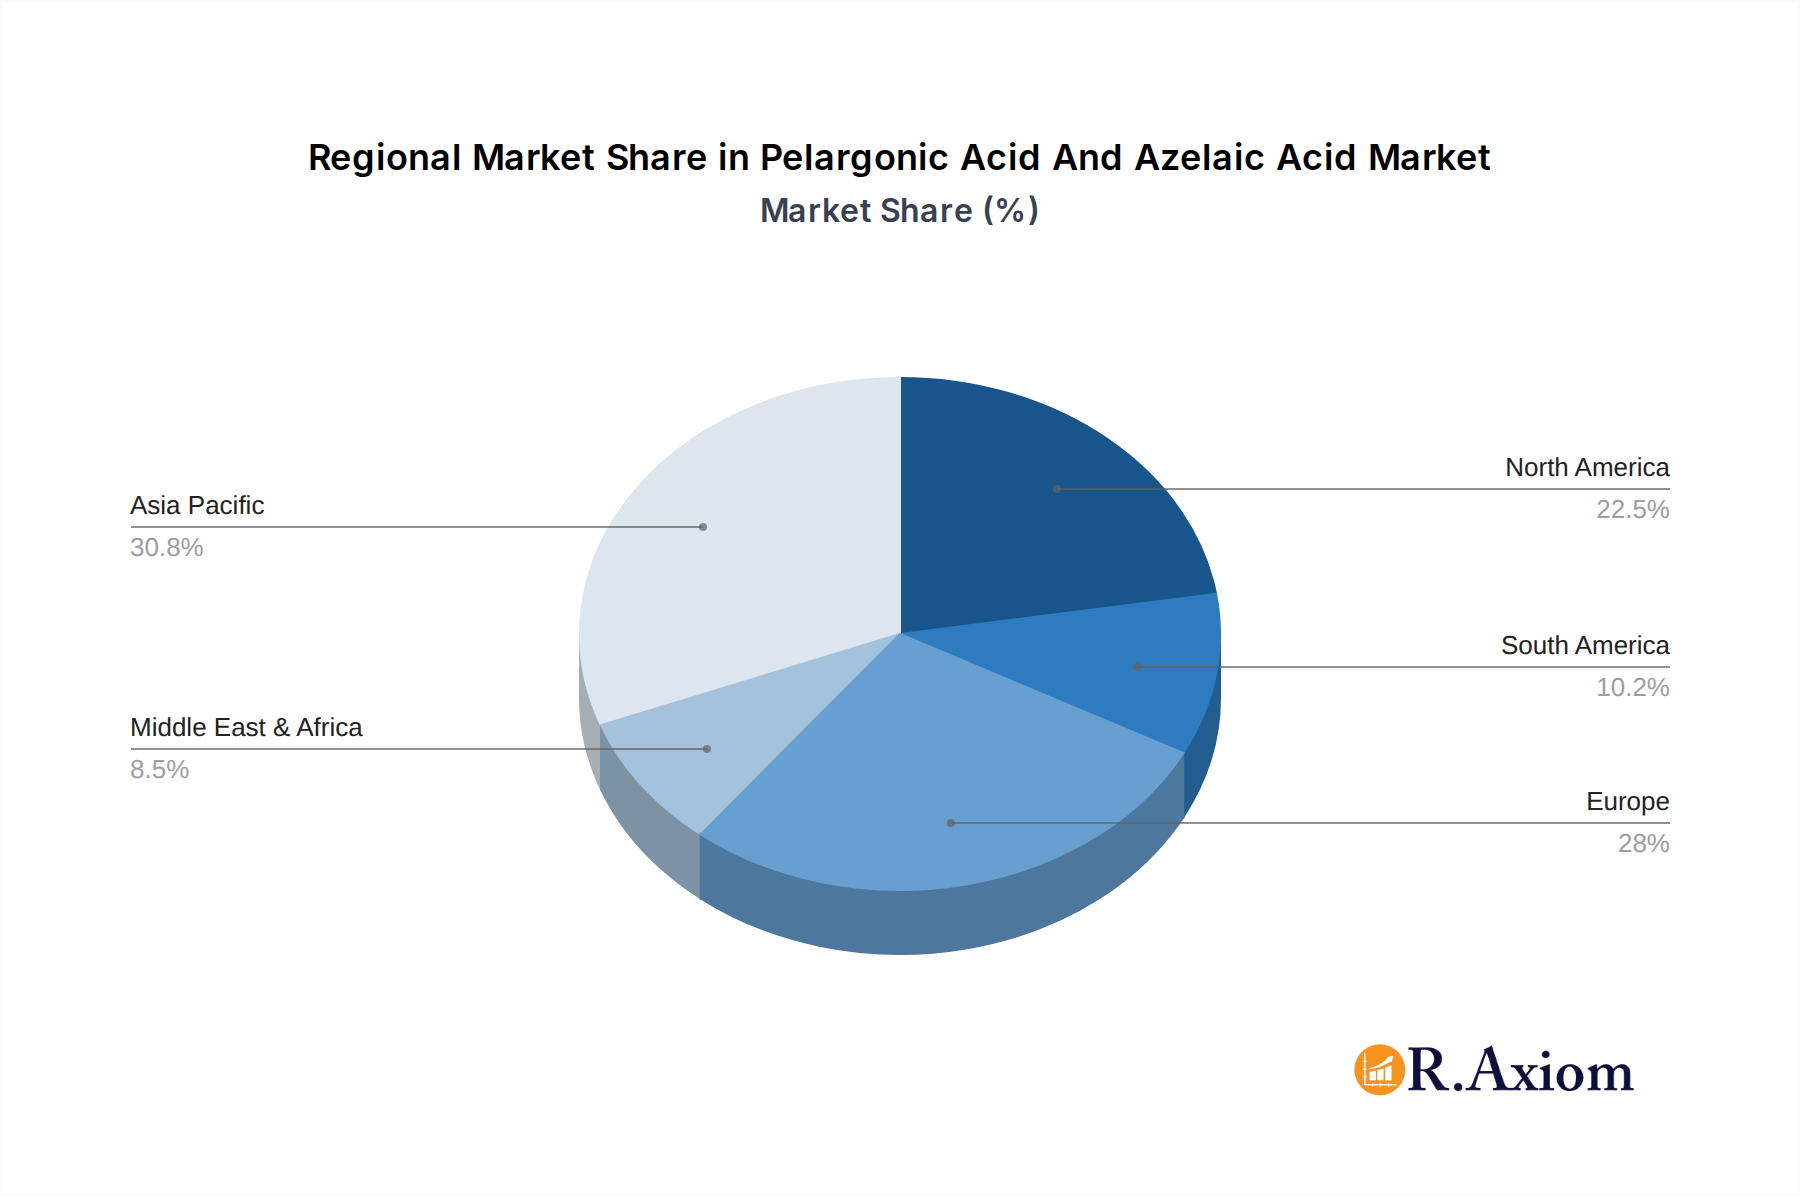
Pelargonic Acid And Azelaic Acid Regional Market Share
Geographic Coverage of Pelargonic Acid And Azelaic Acid
Pelargonic Acid And Azelaic Acid REPORT HIGHLIGHTS
| Aspects | Details |
|---|---|
| Study Period | 2020-2034 |
| Base Year | 2025 |
| Estimated Year | 2026 |
| Forecast Period | 2026-2034 |
| Historical Period | 2020-2025 |
| Growth Rate | CAGR of 4.6% from 2020-2034 |
| Segmentation |
|
Table of Contents
- 1. Introduction
- 1.1. Research Scope
- 1.2. Market Segmentation
- 1.3. Research Objective
- 1.4. Definitions and Assumptions
- 2. Executive Summary
- 2.1. Market Snapshot
- 3. Market Dynamics
- 3.1. Market Drivers
- 3.2. Market Restrains
- 3.3. Market Trends
- 3.4. Market Opportunities
- 4. Market Factor Analysis
- 4.1. Porters Five Forces
- 4.1.1. Bargaining Power of Suppliers
- 4.1.2. Bargaining Power of Buyers
- 4.1.3. Threat of New Entrants
- 4.1.4. Threat of Substitutes
- 4.1.5. Competitive Rivalry
- 4.2. PESTEL analysis
- 4.3. BCG Analysis
- 4.3.1. Stars (High Growth, High Market Share)
- 4.3.2. Cash Cows (Low Growth, High Market Share)
- 4.3.3. Question Mark (High Growth, Low Market Share)
- 4.3.4. Dogs (Low Growth, Low Market Share)
- 4.4. Ansoff Matrix Analysis
- 4.5. Supply Chain Analysis
- 4.6. Regulatory Landscape
- 4.7. Current Market Potential and Opportunity Assessment (TAM–SAM–SOM Framework)
- 4.8. RAX Analyst Note
- 4.1. Porters Five Forces
- 5. Market Analysis, Insights and Forecast 2021-2033
- 5.1. Market Analysis, Insights and Forecast - by Application
- 5.1.1. Plastics
- 5.1.2. Lubricants
- 5.1.3. Plant Protection Products
- 5.1.4. Pharmaceuticals and Cosmetics
- 5.1.5. Others
- 5.2. Market Analysis, Insights and Forecast - by Type
- 5.2.1. Pelargonic Acid
- 5.2.2. Azelaic Acid
- 5.3. Market Analysis, Insights and Forecast - by Region
- 5.3.1. North America
- 5.3.2. South America
- 5.3.3. Europe
- 5.3.4. Middle East & Africa
- 5.3.5. Asia Pacific
- 5.1. Market Analysis, Insights and Forecast - by Application
- 6. Global Pelargonic Acid And Azelaic Acid Analysis, Insights and Forecast, 2021-2033
- 6.1. Market Analysis, Insights and Forecast - by Application
- 6.1.1. Plastics
- 6.1.2. Lubricants
- 6.1.3. Plant Protection Products
- 6.1.4. Pharmaceuticals and Cosmetics
- 6.1.5. Others
- 6.2. Market Analysis, Insights and Forecast - by Type
- 6.2.1. Pelargonic Acid
- 6.2.2. Azelaic Acid
- 6.1. Market Analysis, Insights and Forecast - by Application
- 7. North America Pelargonic Acid And Azelaic Acid Analysis, Insights and Forecast, 2020-2032
- 7.1. Market Analysis, Insights and Forecast - by Application
- 7.1.1. Plastics
- 7.1.2. Lubricants
- 7.1.3. Plant Protection Products
- 7.1.4. Pharmaceuticals and Cosmetics
- 7.1.5. Others
- 7.2. Market Analysis, Insights and Forecast - by Type
- 7.2.1. Pelargonic Acid
- 7.2.2. Azelaic Acid
- 7.1. Market Analysis, Insights and Forecast - by Application
- 8. South America Pelargonic Acid And Azelaic Acid Analysis, Insights and Forecast, 2020-2032
- 8.1. Market Analysis, Insights and Forecast - by Application
- 8.1.1. Plastics
- 8.1.2. Lubricants
- 8.1.3. Plant Protection Products
- 8.1.4. Pharmaceuticals and Cosmetics
- 8.1.5. Others
- 8.2. Market Analysis, Insights and Forecast - by Type
- 8.2.1. Pelargonic Acid
- 8.2.2. Azelaic Acid
- 8.1. Market Analysis, Insights and Forecast - by Application
- 9. Europe Pelargonic Acid And Azelaic Acid Analysis, Insights and Forecast, 2020-2032
- 9.1. Market Analysis, Insights and Forecast - by Application
- 9.1.1. Plastics
- 9.1.2. Lubricants
- 9.1.3. Plant Protection Products
- 9.1.4. Pharmaceuticals and Cosmetics
- 9.1.5. Others
- 9.2. Market Analysis, Insights and Forecast - by Type
- 9.2.1. Pelargonic Acid
- 9.2.2. Azelaic Acid
- 9.1. Market Analysis, Insights and Forecast - by Application
- 10. Middle East & Africa Pelargonic Acid And Azelaic Acid Analysis, Insights and Forecast, 2020-2032
- 10.1. Market Analysis, Insights and Forecast - by Application
- 10.1.1. Plastics
- 10.1.2. Lubricants
- 10.1.3. Plant Protection Products
- 10.1.4. Pharmaceuticals and Cosmetics
- 10.1.5. Others
- 10.2. Market Analysis, Insights and Forecast - by Type
- 10.2.1. Pelargonic Acid
- 10.2.2. Azelaic Acid
- 10.1. Market Analysis, Insights and Forecast - by Application
- 11. Asia Pacific Pelargonic Acid And Azelaic Acid Analysis, Insights and Forecast, 2020-2032
- 11.1. Market Analysis, Insights and Forecast - by Application
- 11.1.1. Plastics
- 11.1.2. Lubricants
- 11.1.3. Plant Protection Products
- 11.1.4. Pharmaceuticals and Cosmetics
- 11.1.5. Others
- 11.2. Market Analysis, Insights and Forecast - by Type
- 11.2.1. Pelargonic Acid
- 11.2.2. Azelaic Acid
- 11.1. Market Analysis, Insights and Forecast - by Application
- 12. Competitive Analysis
- 12.1. Company Profiles
- 12.1.1 Emery Oleochemicals
- 12.1.1.1. Company Overview
- 12.1.1.2. Products
- 12.1.1.3. Company Financials
- 12.1.1.4. SWOT Analysis
- 12.1.2 Matrica SpA
- 12.1.2.1. Company Overview
- 12.1.2.2. Products
- 12.1.2.3. Company Financials
- 12.1.2.4. SWOT Analysis
- 12.1.3 BASF
- 12.1.3.1. Company Overview
- 12.1.3.2. Products
- 12.1.3.3. Company Financials
- 12.1.3.4. SWOT Analysis
- 12.1.4 OQ Chemicals
- 12.1.4.1. Company Overview
- 12.1.4.2. Products
- 12.1.4.3. Company Financials
- 12.1.4.4. SWOT Analysis
- 12.1.5 Croda Sipo
- 12.1.5.1. Company Overview
- 12.1.5.2. Products
- 12.1.5.3. Company Financials
- 12.1.5.4. SWOT Analysis
- 12.1.6 Jiangsu Senxuan
- 12.1.6.1. Company Overview
- 12.1.6.2. Products
- 12.1.6.3. Company Financials
- 12.1.6.4. SWOT Analysis
- 12.1.7 Nantong Hengxing
- 12.1.7.1. Company Overview
- 12.1.7.2. Products
- 12.1.7.3. Company Financials
- 12.1.7.4. SWOT Analysis
- 12.1.8 Shandong Clearwill
- 12.1.8.1. Company Overview
- 12.1.8.2. Products
- 12.1.8.3. Company Financials
- 12.1.8.4. SWOT Analysis
- 12.1.9 Zhengzhou Yibang
- 12.1.9.1. Company Overview
- 12.1.9.2. Products
- 12.1.9.3. Company Financials
- 12.1.9.4. SWOT Analysis
- 12.1.1 Emery Oleochemicals
- 12.2. Market Entropy
- 12.2.1 Company's Key Areas Served
- 12.2.2 Recent Developments
- 12.3. Company Market Share Analysis 2025
- 12.3.1 Top 5 Companies Market Share Analysis
- 12.3.2 Top 3 Companies Market Share Analysis
- 12.4. List of Potential Customers
- 13. Research Methodology
List of Figures
- Figure 1: Global Pelargonic Acid And Azelaic Acid Revenue Breakdown (million, %) by Region 2025 & 2033
- Figure 2: North America Pelargonic Acid And Azelaic Acid Revenue (million), by Application 2025 & 2033
- Figure 3: North America Pelargonic Acid And Azelaic Acid Revenue Share (%), by Application 2025 & 2033
- Figure 4: North America Pelargonic Acid And Azelaic Acid Revenue (million), by Type 2025 & 2033
- Figure 5: North America Pelargonic Acid And Azelaic Acid Revenue Share (%), by Type 2025 & 2033
- Figure 6: North America Pelargonic Acid And Azelaic Acid Revenue (million), by Country 2025 & 2033
- Figure 7: North America Pelargonic Acid And Azelaic Acid Revenue Share (%), by Country 2025 & 2033
- Figure 8: South America Pelargonic Acid And Azelaic Acid Revenue (million), by Application 2025 & 2033
- Figure 9: South America Pelargonic Acid And Azelaic Acid Revenue Share (%), by Application 2025 & 2033
- Figure 10: South America Pelargonic Acid And Azelaic Acid Revenue (million), by Type 2025 & 2033
- Figure 11: South America Pelargonic Acid And Azelaic Acid Revenue Share (%), by Type 2025 & 2033
- Figure 12: South America Pelargonic Acid And Azelaic Acid Revenue (million), by Country 2025 & 2033
- Figure 13: South America Pelargonic Acid And Azelaic Acid Revenue Share (%), by Country 2025 & 2033
- Figure 14: Europe Pelargonic Acid And Azelaic Acid Revenue (million), by Application 2025 & 2033
- Figure 15: Europe Pelargonic Acid And Azelaic Acid Revenue Share (%), by Application 2025 & 2033
- Figure 16: Europe Pelargonic Acid And Azelaic Acid Revenue (million), by Type 2025 & 2033
- Figure 17: Europe Pelargonic Acid And Azelaic Acid Revenue Share (%), by Type 2025 & 2033
- Figure 18: Europe Pelargonic Acid And Azelaic Acid Revenue (million), by Country 2025 & 2033
- Figure 19: Europe Pelargonic Acid And Azelaic Acid Revenue Share (%), by Country 2025 & 2033
- Figure 20: Middle East & Africa Pelargonic Acid And Azelaic Acid Revenue (million), by Application 2025 & 2033
- Figure 21: Middle East & Africa Pelargonic Acid And Azelaic Acid Revenue Share (%), by Application 2025 & 2033
- Figure 22: Middle East & Africa Pelargonic Acid And Azelaic Acid Revenue (million), by Type 2025 & 2033
- Figure 23: Middle East & Africa Pelargonic Acid And Azelaic Acid Revenue Share (%), by Type 2025 & 2033
- Figure 24: Middle East & Africa Pelargonic Acid And Azelaic Acid Revenue (million), by Country 2025 & 2033
- Figure 25: Middle East & Africa Pelargonic Acid And Azelaic Acid Revenue Share (%), by Country 2025 & 2033
- Figure 26: Asia Pacific Pelargonic Acid And Azelaic Acid Revenue (million), by Application 2025 & 2033
- Figure 27: Asia Pacific Pelargonic Acid And Azelaic Acid Revenue Share (%), by Application 2025 & 2033
- Figure 28: Asia Pacific Pelargonic Acid And Azelaic Acid Revenue (million), by Type 2025 & 2033
- Figure 29: Asia Pacific Pelargonic Acid And Azelaic Acid Revenue Share (%), by Type 2025 & 2033
- Figure 30: Asia Pacific Pelargonic Acid And Azelaic Acid Revenue (million), by Country 2025 & 2033
- Figure 31: Asia Pacific Pelargonic Acid And Azelaic Acid Revenue Share (%), by Country 2025 & 2033
List of Tables
- Table 1: Global Pelargonic Acid And Azelaic Acid Revenue million Forecast, by Application 2020 & 2033
- Table 2: Global Pelargonic Acid And Azelaic Acid Revenue million Forecast, by Type 2020 & 2033
- Table 3: Global Pelargonic Acid And Azelaic Acid Revenue million Forecast, by Region 2020 & 2033
- Table 4: Global Pelargonic Acid And Azelaic Acid Revenue million Forecast, by Application 2020 & 2033
- Table 5: Global Pelargonic Acid And Azelaic Acid Revenue million Forecast, by Type 2020 & 2033
- Table 6: Global Pelargonic Acid And Azelaic Acid Revenue million Forecast, by Country 2020 & 2033
- Table 7: United States Pelargonic Acid And Azelaic Acid Revenue (million) Forecast, by Application 2020 & 2033
- Table 8: Canada Pelargonic Acid And Azelaic Acid Revenue (million) Forecast, by Application 2020 & 2033
- Table 9: Mexico Pelargonic Acid And Azelaic Acid Revenue (million) Forecast, by Application 2020 & 2033
- Table 10: Global Pelargonic Acid And Azelaic Acid Revenue million Forecast, by Application 2020 & 2033
- Table 11: Global Pelargonic Acid And Azelaic Acid Revenue million Forecast, by Type 2020 & 2033
- Table 12: Global Pelargonic Acid And Azelaic Acid Revenue million Forecast, by Country 2020 & 2033
- Table 13: Brazil Pelargonic Acid And Azelaic Acid Revenue (million) Forecast, by Application 2020 & 2033
- Table 14: Argentina Pelargonic Acid And Azelaic Acid Revenue (million) Forecast, by Application 2020 & 2033
- Table 15: Rest of South America Pelargonic Acid And Azelaic Acid Revenue (million) Forecast, by Application 2020 & 2033
- Table 16: Global Pelargonic Acid And Azelaic Acid Revenue million Forecast, by Application 2020 & 2033
- Table 17: Global Pelargonic Acid And Azelaic Acid Revenue million Forecast, by Type 2020 & 2033
- Table 18: Global Pelargonic Acid And Azelaic Acid Revenue million Forecast, by Country 2020 & 2033
- Table 19: United Kingdom Pelargonic Acid And Azelaic Acid Revenue (million) Forecast, by Application 2020 & 2033
- Table 20: Germany Pelargonic Acid And Azelaic Acid Revenue (million) Forecast, by Application 2020 & 2033
- Table 21: France Pelargonic Acid And Azelaic Acid Revenue (million) Forecast, by Application 2020 & 2033
- Table 22: Italy Pelargonic Acid And Azelaic Acid Revenue (million) Forecast, by Application 2020 & 2033
- Table 23: Spain Pelargonic Acid And Azelaic Acid Revenue (million) Forecast, by Application 2020 & 2033
- Table 24: Russia Pelargonic Acid And Azelaic Acid Revenue (million) Forecast, by Application 2020 & 2033
- Table 25: Benelux Pelargonic Acid And Azelaic Acid Revenue (million) Forecast, by Application 2020 & 2033
- Table 26: Nordics Pelargonic Acid And Azelaic Acid Revenue (million) Forecast, by Application 2020 & 2033
- Table 27: Rest of Europe Pelargonic Acid And Azelaic Acid Revenue (million) Forecast, by Application 2020 & 2033
- Table 28: Global Pelargonic Acid And Azelaic Acid Revenue million Forecast, by Application 2020 & 2033
- Table 29: Global Pelargonic Acid And Azelaic Acid Revenue million Forecast, by Type 2020 & 2033
- Table 30: Global Pelargonic Acid And Azelaic Acid Revenue million Forecast, by Country 2020 & 2033
- Table 31: Turkey Pelargonic Acid And Azelaic Acid Revenue (million) Forecast, by Application 2020 & 2033
- Table 32: Israel Pelargonic Acid And Azelaic Acid Revenue (million) Forecast, by Application 2020 & 2033
- Table 33: GCC Pelargonic Acid And Azelaic Acid Revenue (million) Forecast, by Application 2020 & 2033
- Table 34: North Africa Pelargonic Acid And Azelaic Acid Revenue (million) Forecast, by Application 2020 & 2033
- Table 35: South Africa Pelargonic Acid And Azelaic Acid Revenue (million) Forecast, by Application 2020 & 2033
- Table 36: Rest of Middle East & Africa Pelargonic Acid And Azelaic Acid Revenue (million) Forecast, by Application 2020 & 2033
- Table 37: Global Pelargonic Acid And Azelaic Acid Revenue million Forecast, by Application 2020 & 2033
- Table 38: Global Pelargonic Acid And Azelaic Acid Revenue million Forecast, by Type 2020 & 2033
- Table 39: Global Pelargonic Acid And Azelaic Acid Revenue million Forecast, by Country 2020 & 2033
- Table 40: China Pelargonic Acid And Azelaic Acid Revenue (million) Forecast, by Application 2020 & 2033
- Table 41: India Pelargonic Acid And Azelaic Acid Revenue (million) Forecast, by Application 2020 & 2033
- Table 42: Japan Pelargonic Acid And Azelaic Acid Revenue (million) Forecast, by Application 2020 & 2033
- Table 43: South Korea Pelargonic Acid And Azelaic Acid Revenue (million) Forecast, by Application 2020 & 2033
- Table 44: ASEAN Pelargonic Acid And Azelaic Acid Revenue (million) Forecast, by Application 2020 & 2033
- Table 45: Oceania Pelargonic Acid And Azelaic Acid Revenue (million) Forecast, by Application 2020 & 2033
- Table 46: Rest of Asia Pacific Pelargonic Acid And Azelaic Acid Revenue (million) Forecast, by Application 2020 & 2033
Frequently Asked Questions
1. What is the projected Compound Annual Growth Rate (CAGR) of the Pelargonic Acid And Azelaic Acid?
The projected CAGR is approximately 4.6%.
2. Which companies are prominent players in the Pelargonic Acid And Azelaic Acid?
Key companies in the market include Emery Oleochemicals, Matrica SpA, BASF, OQ Chemicals, Croda Sipo, Jiangsu Senxuan, Nantong Hengxing, Shandong Clearwill, Zhengzhou Yibang.
3. What are the main segments of the Pelargonic Acid And Azelaic Acid?
The market segments include Application, Type.
4. Can you provide details about the market size?
The market size is estimated to be USD 350 million as of 2022.
5. What are some drivers contributing to market growth?
N/A
6. What are the notable trends driving market growth?
N/A
7. Are there any restraints impacting market growth?
N/A
8. Can you provide examples of recent developments in the market?
N/A
9. What pricing options are available for accessing the report?
Pricing options include single-user, multi-user, and enterprise licenses priced at USD 4900.00, USD 7350.00, and USD 9800.00 respectively.
10. Is the market size provided in terms of value or volume?
The market size is provided in terms of value, measured in million.
11. Are there any specific market keywords associated with the report?
Yes, the market keyword associated with the report is "Pelargonic Acid And Azelaic Acid," which aids in identifying and referencing the specific market segment covered.
12. How do I determine which pricing option suits my needs best?
The pricing options vary based on user requirements and access needs. Individual users may opt for single-user licenses, while businesses requiring broader access may choose multi-user or enterprise licenses for cost-effective access to the report.
13. Are there any additional resources or data provided in the Pelargonic Acid And Azelaic Acid report?
While the report offers comprehensive insights, it's advisable to review the specific contents or supplementary materials provided to ascertain if additional resources or data are available.
14. How can I stay updated on further developments or reports in the Pelargonic Acid And Azelaic Acid?
To stay informed about further developments, trends, and reports in the Pelargonic Acid And Azelaic Acid, consider subscribing to industry newsletters, following relevant companies and organizations, or regularly checking reputable industry news sources and publications.
Methodology
Step 1 - Identification of Relevant Samples Size from Population Database


Step 2 - Approaches for Defining Global Market Size (Value, Volume* & Price*)

Note*: In applicable scenarios
Step 3 - Data Sources
Primary Research
- Web Analytics
- Survey Reports
- Research Institute
- Latest Research Reports
- Opinion Leaders
Secondary Research
- Annual Reports
- White Paper
- Latest Press Release
- Industry Association
- Paid Database
- Investor Presentations

Step 4 - Data Triangulation
Involves using different sources of information in order to increase the validity of a study
These sources are likely to be stakeholders in a program - participants, other researchers, program staff, other community members, and so on.
Then we put all data in single framework & apply various statistical tools to find out the dynamic on the market.
During the analysis stage, feedback from the stakeholder groups would be compared to determine areas of agreement as well as areas of divergence

