

Key Insights
The Phase Change Thermal Interface Materials (PC-TIM) market is experiencing robust growth, driven by the increasing demand for high-performance thermal management solutions across diverse industries. The market's Compound Annual Growth Rate (CAGR) exceeding 11% from 2019 to 2024 indicates a significant upward trajectory, projected to continue through 2033. Key drivers include the escalating heat dissipation requirements in advanced electronics, particularly within the computing, telecommunications, and automotive sectors. Miniaturization and increasing power density in electronic devices necessitate efficient thermal management to prevent overheating and ensure optimal performance and longevity. The growing adoption of electric vehicles (EVs) and hybrid electric vehicles (HEVs) further fuels market expansion, as these vehicles require advanced thermal management systems for battery packs and power electronics. Different conductive types (electrically conductive and non-electrically conductive), binder types (paraffin, non-paraffin, eutectic salts, salt hydrates), and filler types (aluminum oxide, boron nitride, etc.) cater to specific application needs, contributing to market segmentation.
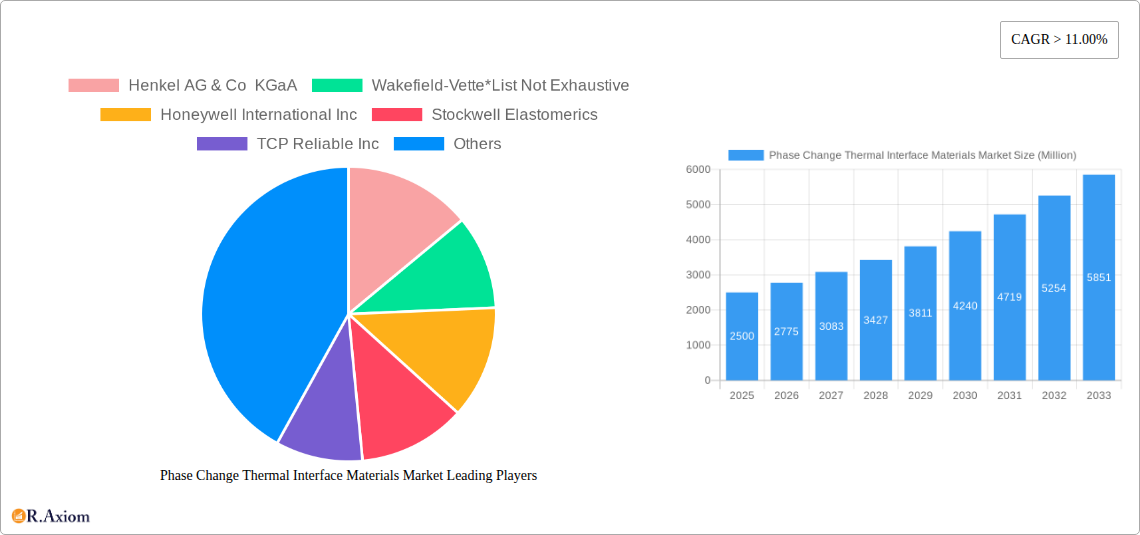
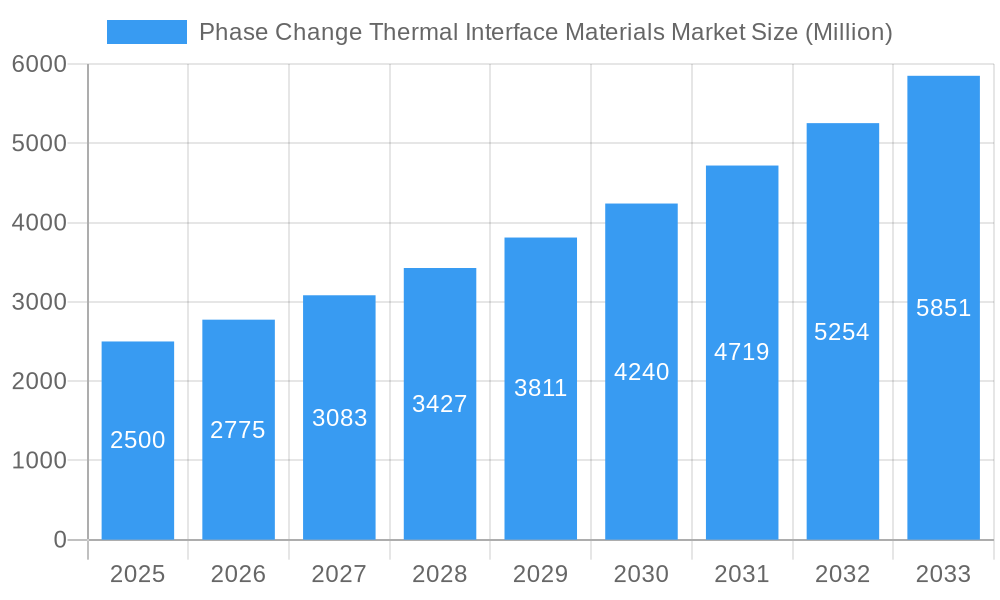
Phase Change Thermal Interface Materials Market Market Size (In Billion)
The market is witnessing several prominent trends. The development of eco-friendly, non-toxic PC-TIMs is gaining traction as environmental concerns rise. Furthermore, ongoing research and development efforts are focused on enhancing the thermal conductivity and performance of PC-TIMs to meet the demands of increasingly powerful and compact electronic devices. However, the market faces certain restraints, including the relatively high cost of some PC-TIMs compared to traditional thermal interface materials and potential challenges associated with material compatibility and long-term stability. Despite these challenges, the overall market outlook remains positive, with significant growth potential driven by technological advancements, increasing demand for high-performance electronics, and the expanding adoption of EVs. Leading players such as Henkel, Honeywell, 3M, and others are actively involved in innovation and market expansion, further contributing to the dynamic nature of this sector.
Phase Change Thermal Interface Materials Market Company Market Share
Phase Change Thermal Interface Materials Market: A Comprehensive Report (2019-2033)
This comprehensive report provides an in-depth analysis of the Phase Change Thermal Interface Materials (PC TIM) market, offering actionable insights for stakeholders across the value chain. Covering the period from 2019 to 2033, with 2025 as the base year, this report meticulously examines market trends, segment performance, competitive dynamics, and future growth prospects. The report leverages extensive primary and secondary research to deliver a precise and insightful overview of this dynamic market. The total market size in 2025 is estimated at xx Million, projected to reach xx Million by 2033, exhibiting a CAGR of xx% during the forecast period (2025-2033).
Phase Change Thermal Interface Materials Market Concentration & Innovation
The Phase Change Thermal Interface Materials market exhibits a moderately consolidated structure, with several key players holding significant market share. However, the presence of numerous smaller companies and emerging players indicates a dynamic competitive landscape. The market is characterized by ongoing innovation driven by the increasing demand for efficient thermal management solutions across various industries. Several key factors influence market concentration:
Market Share: While precise market share data for individual companies is proprietary information, major players like 3M, Henkel, and Honeywell International Inc. are expected to hold substantial shares. Smaller companies often specialize in niche applications or specific material types. The market share distribution is expected to evolve with technological advancements and M&A activities.
M&A Activities: The PC TIM market has witnessed a moderate level of merger and acquisition activity in recent years. Deal values have varied, reflecting the size and strategic importance of the target companies. These activities aim to expand product portfolios, gain access to new technologies, and enhance market reach. For example, the acquisition of [Company X] by [Company Y] in [Year] demonstrates this trend. The total value of M&A deals in the past five years is estimated to be around xx Million.
Innovation Drivers: Advancements in material science, particularly in developing higher-performance phase change materials with improved thermal conductivity and stability, are major drivers of innovation. The development of novel filler materials and binder systems is another key aspect. Furthermore, miniaturization trends in electronics are driving demand for PC TIMs with enhanced performance and reliability.
Regulatory Frameworks: Environmental regulations regarding the use of certain materials in PC TIMs are emerging as significant considerations. This influences material selection and product development strategies. Compliance with these regulations is becoming increasingly crucial for market players.
Product Substitutes: While PC TIMs offer unique advantages, other thermal interface materials such as greases, pads, and adhesives exist. The choice of material often depends on specific application requirements, cost considerations, and performance needs.
End-User Trends: Growing demand for high-performance computing, 5G telecommunications infrastructure, and electric vehicles are boosting the demand for high-performance PC TIMs capable of efficient heat dissipation. These end-user trends significantly influence product development and market growth.
Phase Change Thermal Interface Materials Market Industry Trends & Insights
The Phase Change Thermal Interface Materials market is experiencing robust growth fueled by several key trends:
The rising demand for efficient thermal management solutions across various end-user industries, particularly in the electronics sector, is driving significant market expansion. The increasing power density of electronic devices necessitates advanced thermal interface materials to prevent overheating and ensure optimal performance. The global push towards miniaturization in electronics necessitates materials with superior thermal conductivity and enhanced reliability. Technological advancements, such as the development of nano-structured phase change materials, are further enhancing the performance characteristics of these materials, leading to greater adoption across diverse applications. Consumer preferences for energy-efficient and high-performance devices further fuel market growth. The competitive dynamics are characterized by intense competition among established players and emerging companies, driving innovation and price optimization within the industry. The market is witnessing a shift towards sustainable and environmentally friendly materials, leading to the development of PC TIMs with reduced environmental impact.
Dominant Markets & Segments in Phase Change Thermal Interface Materials Market
The global Phase Change Thermal Interface Materials market is geographically diverse, with dominance varying across segments.
Leading Regions/Countries: North America and Asia Pacific are expected to be the dominant regions, driven by strong demand from the electronics and automotive industries in these regions. Specifically, China and the United States are likely to be the leading countries due to their significant manufacturing base and technological advancements.
By Conductive Type: The electrically conductive segment is expected to dominate owing to its widespread use in high-power electronic devices requiring efficient heat dissipation.
By Binder Type: Paraffin-based binders currently hold a significant share but non-paraffin (organic), eutectic salts, and salt hydrates are gaining traction due to performance improvements and expanding applications.
By Filler Type: Aluminum oxide is currently the most widely used filler due to its cost-effectiveness and performance characteristics, but Boron nitride and Aluminum nitride are gaining importance in high-performance applications due to their superior thermal conductivity.
By End-user Industry: The computers and electronics segment accounts for the largest market share, driven by the increasing power density of electronic devices. The automotive industry is also a significant growth driver, with the rising adoption of electric vehicles.
Key Drivers (Specific Examples):
Economic Policies: Government incentives and funding for research and development in advanced materials technologies are supporting market growth.
Infrastructure Development: Expansion of 5G networks and data centers are fueling demand for high-performance thermal management solutions.
Phase Change Thermal Interface Materials Market Product Developments
Recent product innovations focus on enhancing thermal conductivity, improving long-term stability, and expanding the range of operating temperatures. This includes the development of novel filler materials with superior thermal properties and improved binder systems to enhance material processability and reliability. The integration of nanomaterials and advanced manufacturing techniques is also contributing to product advancements. These developments are driven by the demand for higher performance and reliability in demanding applications, leading to enhanced market fit and competitive advantages.
Report Scope & Segmentation Analysis
This report provides a comprehensive segmentation analysis of the Phase Change Thermal Interface Materials market based on conductive type (electrically conductive and non-electrically conductive), binder type (paraffin, non-paraffin (organic), eutectic salts, and salt hydrates), filler type (aluminum oxide, boron nitride, aluminum nitride, zinc oxide, and other filler types), and end-user industry (computers, electrical and electronics, telecommunication, automotive, and other end-user industries). Each segment is analyzed in detail, providing insights into market size, growth projections, and competitive dynamics. The market size and growth rate for each segment are projected based on detailed analysis of historical data and future trends.
Key Drivers of Phase Change Thermal Interface Materials Market Growth
Several factors are driving the growth of the PC TIM market, including:
Technological advancements: The development of new materials with enhanced thermal conductivity and stability is a key driver.
Economic growth: Strong economic growth in key markets like China, India, and the US is driving demand for electronic devices and vehicles.
Stringent regulations: Growing environmental concerns are leading to the development of more sustainable PC TIMs.
Challenges in the Phase Change Thermal Interface Materials Market Sector
The PC TIM market faces several challenges:
High material costs: Some advanced PC TIMs are expensive, limiting their adoption in cost-sensitive applications.
Supply chain disruptions: Geopolitical events and natural disasters can disrupt the supply chain, impacting production.
Competitive landscape: The market is fragmented, leading to intense competition and price pressure.
Emerging Opportunities in Phase Change Thermal Interface Materials Market
Emerging opportunities exist in:
New applications: The development of new applications, such as in renewable energy and aerospace, presents significant growth potential.
Advanced materials: The exploration of new materials with even better thermal properties is an ongoing area of innovation.
Sustainable materials: The demand for environmentally friendly PC TIMs is creating opportunities for companies with sustainable solutions.
Leading Players in the Phase Change Thermal Interface Materials Market Market
- Henkel AG & Co KGaA
- Wakefield-Vette
- Honeywell International Inc
- Stockwell Elastomerics
- TCP Reliable Inc
- Specialty Silicone Products (SSP)
- Microtek Laboratories Inc
- NuSil Technology
- Enerdyne Thermal Solutions
- Parker Chomerics
- 3M
- GrafTech
- Croda International PLC
- AI Technology
- Dow
- Arctic Silver
- Laird Technologies
- Datum Phase Change Ltd
- Aavid Thermalloy
- Phase Change Energy Solutions Inc (PCES)
Key Developments in Phase Change Thermal Interface Materials Market Industry
- [Month, Year]: Company X launched a new line of high-performance PC TIMs with enhanced thermal conductivity.
- [Month, Year]: Companies A and B announced a strategic partnership to develop next-generation PC TIM technology.
- [Month, Year]: A major regulatory change impacted the use of certain materials in PC TIMs. (Further details would be included in the full report)
Strategic Outlook for Phase Change Thermal Interface Materials Market Market
The Phase Change Thermal Interface Materials market is poised for continued growth, driven by technological advancements, increasing demand from key industries, and the development of more sustainable solutions. The focus on improving thermal management in high-power electronic devices, electric vehicles, and other emerging applications presents a significant opportunity for market expansion. Companies with a focus on innovation, sustainability, and strategic partnerships are best positioned to capture a larger share of this dynamic market.
Phase Change Thermal Interface Materials Market Segmentation
-
1. Conductive Type
- 1.1. Electrically Conductive
- 1.2. Non-electrically Conductive
-
2. Binder Type
- 2.1. Paraffin
- 2.2. Non-paraffin (organic)
- 2.3. Eutectic salts
- 2.4. Salt hydrates
-
3. Filler Type
- 3.1. Aluminum Oxide
- 3.2. Boron Nitride
- 3.3. Aluminum Nitride
- 3.4. Zinc Oxide
- 3.5. Other Filler Types
-
4. End-user Industry
- 4.1. Computers
- 4.2. Electrical and Electronics
- 4.3. Telecommunication
- 4.4. Automotive
- 4.5. Other End-user Industries
Phase Change Thermal Interface Materials Market Segmentation By Geography
-
1. Asia Pacific
- 1.1. China
- 1.2. India
- 1.3. Japan
- 1.4. South Korea
- 1.5. Rest of Asia Pacific
-
2. North America
- 2.1. United States
- 2.2. Canada
- 2.3. Mexico
-
3. Europe
- 3.1. Germany
- 3.2. United Kingdom
- 3.3. Italy
- 3.4. France
- 3.5. Rest of Europe
-
4. Rest of World
- 4.1. Brazil
- 4.2. Saudi Arabia
- 4.3. South Africa
- 4.4. Rest of the World
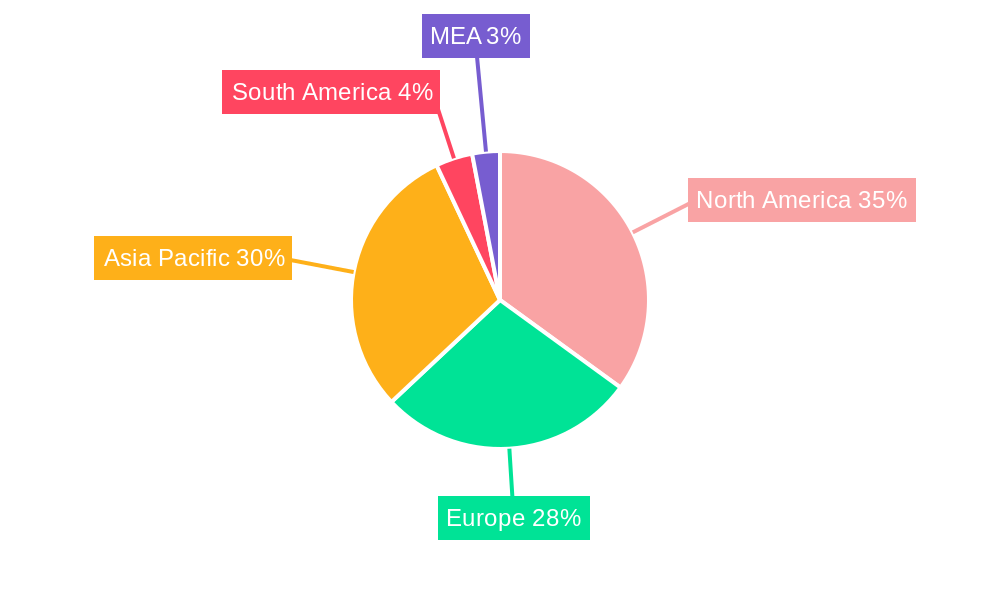
Phase Change Thermal Interface Materials Market Regional Market Share
Geographic Coverage of Phase Change Thermal Interface Materials Market
Phase Change Thermal Interface Materials Market REPORT HIGHLIGHTS
| Aspects | Details |
|---|---|
| Study Period | 2020-2034 |
| Base Year | 2025 |
| Estimated Year | 2026 |
| Forecast Period | 2026-2034 |
| Historical Period | 2020-2025 |
| Growth Rate | CAGR of > 11.00% from 2020-2034 |
| Segmentation |
|
Table of Contents
- 1. Introduction
- 1.1. Research Scope
- 1.2. Market Segmentation
- 1.3. Research Objective
- 1.4. Definitions and Assumptions
- 2. Executive Summary
- 2.1. Market Snapshot
- 3. Market Dynamics
- 3.1. Market Drivers
- 3.2. Market Restrains
- 3.3. Market Trends
- 3.4. Market Opportunities
- 4. Market Factor Analysis
- 4.1. Porters Five Forces
- 4.1.1. Bargaining Power of Suppliers
- 4.1.2. Bargaining Power of Buyers
- 4.1.3. Threat of New Entrants
- 4.1.4. Threat of Substitutes
- 4.1.5. Competitive Rivalry
- 4.2. PESTEL analysis
- 4.3. BCG Analysis
- 4.3.1. Stars (High Growth, High Market Share)
- 4.3.2. Cash Cows (Low Growth, High Market Share)
- 4.3.3. Question Mark (High Growth, Low Market Share)
- 4.3.4. Dogs (Low Growth, Low Market Share)
- 4.4. Ansoff Matrix Analysis
- 4.5. Supply Chain Analysis
- 4.6. Regulatory Landscape
- 4.7. Current Market Potential and Opportunity Assessment (TAM–SAM–SOM Framework)
- 4.8. RAX Analyst Note
- 4.1. Porters Five Forces
- 5. Market Analysis, Insights and Forecast 2021-2033
- 5.1. Market Analysis, Insights and Forecast - by Conductive Type
- 5.1.1. Electrically Conductive
- 5.1.2. Non-electrically Conductive
- 5.2. Market Analysis, Insights and Forecast - by Binder Type
- 5.2.1. Paraffin
- 5.2.2. Non-paraffin (organic)
- 5.2.3. Eutectic salts
- 5.2.4. Salt hydrates
- 5.3. Market Analysis, Insights and Forecast - by Filler Type
- 5.3.1. Aluminum Oxide
- 5.3.2. Boron Nitride
- 5.3.3. Aluminum Nitride
- 5.3.4. Zinc Oxide
- 5.3.5. Other Filler Types
- 5.4. Market Analysis, Insights and Forecast - by End-user Industry
- 5.4.1. Computers
- 5.4.2. Electrical and Electronics
- 5.4.3. Telecommunication
- 5.4.4. Automotive
- 5.4.5. Other End-user Industries
- 5.5. Market Analysis, Insights and Forecast - by Region
- 5.5.1. Asia Pacific
- 5.5.2. North America
- 5.5.3. Europe
- 5.5.4. Rest of World
- 5.1. Market Analysis, Insights and Forecast - by Conductive Type
- 6. Global Phase Change Thermal Interface Materials Market Analysis, Insights and Forecast, 2021-2033
- 6.1. Market Analysis, Insights and Forecast - by Conductive Type
- 6.1.1. Electrically Conductive
- 6.1.2. Non-electrically Conductive
- 6.2. Market Analysis, Insights and Forecast - by Binder Type
- 6.2.1. Paraffin
- 6.2.2. Non-paraffin (organic)
- 6.2.3. Eutectic salts
- 6.2.4. Salt hydrates
- 6.3. Market Analysis, Insights and Forecast - by Filler Type
- 6.3.1. Aluminum Oxide
- 6.3.2. Boron Nitride
- 6.3.3. Aluminum Nitride
- 6.3.4. Zinc Oxide
- 6.3.5. Other Filler Types
- 6.4. Market Analysis, Insights and Forecast - by End-user Industry
- 6.4.1. Computers
- 6.4.2. Electrical and Electronics
- 6.4.3. Telecommunication
- 6.4.4. Automotive
- 6.4.5. Other End-user Industries
- 6.1. Market Analysis, Insights and Forecast - by Conductive Type
- 7. Asia Pacific Phase Change Thermal Interface Materials Market Analysis, Insights and Forecast, 2020-2032
- 7.1. Market Analysis, Insights and Forecast - by Conductive Type
- 7.1.1. Electrically Conductive
- 7.1.2. Non-electrically Conductive
- 7.2. Market Analysis, Insights and Forecast - by Binder Type
- 7.2.1. Paraffin
- 7.2.2. Non-paraffin (organic)
- 7.2.3. Eutectic salts
- 7.2.4. Salt hydrates
- 7.3. Market Analysis, Insights and Forecast - by Filler Type
- 7.3.1. Aluminum Oxide
- 7.3.2. Boron Nitride
- 7.3.3. Aluminum Nitride
- 7.3.4. Zinc Oxide
- 7.3.5. Other Filler Types
- 7.4. Market Analysis, Insights and Forecast - by End-user Industry
- 7.4.1. Computers
- 7.4.2. Electrical and Electronics
- 7.4.3. Telecommunication
- 7.4.4. Automotive
- 7.4.5. Other End-user Industries
- 7.1. Market Analysis, Insights and Forecast - by Conductive Type
- 8. North America Phase Change Thermal Interface Materials Market Analysis, Insights and Forecast, 2020-2032
- 8.1. Market Analysis, Insights and Forecast - by Conductive Type
- 8.1.1. Electrically Conductive
- 8.1.2. Non-electrically Conductive
- 8.2. Market Analysis, Insights and Forecast - by Binder Type
- 8.2.1. Paraffin
- 8.2.2. Non-paraffin (organic)
- 8.2.3. Eutectic salts
- 8.2.4. Salt hydrates
- 8.3. Market Analysis, Insights and Forecast - by Filler Type
- 8.3.1. Aluminum Oxide
- 8.3.2. Boron Nitride
- 8.3.3. Aluminum Nitride
- 8.3.4. Zinc Oxide
- 8.3.5. Other Filler Types
- 8.4. Market Analysis, Insights and Forecast - by End-user Industry
- 8.4.1. Computers
- 8.4.2. Electrical and Electronics
- 8.4.3. Telecommunication
- 8.4.4. Automotive
- 8.4.5. Other End-user Industries
- 8.1. Market Analysis, Insights and Forecast - by Conductive Type
- 9. Europe Phase Change Thermal Interface Materials Market Analysis, Insights and Forecast, 2020-2032
- 9.1. Market Analysis, Insights and Forecast - by Conductive Type
- 9.1.1. Electrically Conductive
- 9.1.2. Non-electrically Conductive
- 9.2. Market Analysis, Insights and Forecast - by Binder Type
- 9.2.1. Paraffin
- 9.2.2. Non-paraffin (organic)
- 9.2.3. Eutectic salts
- 9.2.4. Salt hydrates
- 9.3. Market Analysis, Insights and Forecast - by Filler Type
- 9.3.1. Aluminum Oxide
- 9.3.2. Boron Nitride
- 9.3.3. Aluminum Nitride
- 9.3.4. Zinc Oxide
- 9.3.5. Other Filler Types
- 9.4. Market Analysis, Insights and Forecast - by End-user Industry
- 9.4.1. Computers
- 9.4.2. Electrical and Electronics
- 9.4.3. Telecommunication
- 9.4.4. Automotive
- 9.4.5. Other End-user Industries
- 9.1. Market Analysis, Insights and Forecast - by Conductive Type
- 10. Rest of World Phase Change Thermal Interface Materials Market Analysis, Insights and Forecast, 2020-2032
- 10.1. Market Analysis, Insights and Forecast - by Conductive Type
- 10.1.1. Electrically Conductive
- 10.1.2. Non-electrically Conductive
- 10.2. Market Analysis, Insights and Forecast - by Binder Type
- 10.2.1. Paraffin
- 10.2.2. Non-paraffin (organic)
- 10.2.3. Eutectic salts
- 10.2.4. Salt hydrates
- 10.3. Market Analysis, Insights and Forecast - by Filler Type
- 10.3.1. Aluminum Oxide
- 10.3.2. Boron Nitride
- 10.3.3. Aluminum Nitride
- 10.3.4. Zinc Oxide
- 10.3.5. Other Filler Types
- 10.4. Market Analysis, Insights and Forecast - by End-user Industry
- 10.4.1. Computers
- 10.4.2. Electrical and Electronics
- 10.4.3. Telecommunication
- 10.4.4. Automotive
- 10.4.5. Other End-user Industries
- 10.1. Market Analysis, Insights and Forecast - by Conductive Type
- 11. Competitive Analysis
- 11.1. Company Profiles
- 11.1.1 Henkel AG & Co KGaA
- 11.1.1.1. Company Overview
- 11.1.1.2. Products
- 11.1.1.3. Company Financials
- 11.1.1.4. SWOT Analysis
- 11.1.2 Wakefield-Vette*List Not Exhaustive
- 11.1.2.1. Company Overview
- 11.1.2.2. Products
- 11.1.2.3. Company Financials
- 11.1.2.4. SWOT Analysis
- 11.1.3 Honeywell International Inc
- 11.1.3.1. Company Overview
- 11.1.3.2. Products
- 11.1.3.3. Company Financials
- 11.1.3.4. SWOT Analysis
- 11.1.4 Stockwell Elastomerics
- 11.1.4.1. Company Overview
- 11.1.4.2. Products
- 11.1.4.3. Company Financials
- 11.1.4.4. SWOT Analysis
- 11.1.5 TCP Reliable Inc
- 11.1.5.1. Company Overview
- 11.1.5.2. Products
- 11.1.5.3. Company Financials
- 11.1.5.4. SWOT Analysis
- 11.1.6 Specialty Silicone Products (SSP)
- 11.1.6.1. Company Overview
- 11.1.6.2. Products
- 11.1.6.3. Company Financials
- 11.1.6.4. SWOT Analysis
- 11.1.7 Microtek Laboratories Inc
- 11.1.7.1. Company Overview
- 11.1.7.2. Products
- 11.1.7.3. Company Financials
- 11.1.7.4. SWOT Analysis
- 11.1.8 NuSil Technology
- 11.1.8.1. Company Overview
- 11.1.8.2. Products
- 11.1.8.3. Company Financials
- 11.1.8.4. SWOT Analysis
- 11.1.9 Enerdyne Thermal Solutions
- 11.1.9.1. Company Overview
- 11.1.9.2. Products
- 11.1.9.3. Company Financials
- 11.1.9.4. SWOT Analysis
- 11.1.10 Parker Chomerics
- 11.1.10.1. Company Overview
- 11.1.10.2. Products
- 11.1.10.3. Company Financials
- 11.1.10.4. SWOT Analysis
- 11.1.11 3M
- 11.1.11.1. Company Overview
- 11.1.11.2. Products
- 11.1.11.3. Company Financials
- 11.1.11.4. SWOT Analysis
- 11.1.12 GrafTech
- 11.1.12.1. Company Overview
- 11.1.12.2. Products
- 11.1.12.3. Company Financials
- 11.1.12.4. SWOT Analysis
- 11.1.13 Croda International PLC
- 11.1.13.1. Company Overview
- 11.1.13.2. Products
- 11.1.13.3. Company Financials
- 11.1.13.4. SWOT Analysis
- 11.1.14 AI Technology
- 11.1.14.1. Company Overview
- 11.1.14.2. Products
- 11.1.14.3. Company Financials
- 11.1.14.4. SWOT Analysis
- 11.1.15 Dow
- 11.1.15.1. Company Overview
- 11.1.15.2. Products
- 11.1.15.3. Company Financials
- 11.1.15.4. SWOT Analysis
- 11.1.16 Arctic Silver
- 11.1.16.1. Company Overview
- 11.1.16.2. Products
- 11.1.16.3. Company Financials
- 11.1.16.4. SWOT Analysis
- 11.1.17 Laird Technologies
- 11.1.17.1. Company Overview
- 11.1.17.2. Products
- 11.1.17.3. Company Financials
- 11.1.17.4. SWOT Analysis
- 11.1.18 Datum Phase Change Ltd
- 11.1.18.1. Company Overview
- 11.1.18.2. Products
- 11.1.18.3. Company Financials
- 11.1.18.4. SWOT Analysis
- 11.1.19 Aavid Thermalloy
- 11.1.19.1. Company Overview
- 11.1.19.2. Products
- 11.1.19.3. Company Financials
- 11.1.19.4. SWOT Analysis
- 11.1.20 Phase Change Energy Solutions Inc (PCES)
- 11.1.20.1. Company Overview
- 11.1.20.2. Products
- 11.1.20.3. Company Financials
- 11.1.20.4. SWOT Analysis
- 11.1.1 Henkel AG & Co KGaA
- 11.2. Market Entropy
- 11.2.1 Company's Key Areas Served
- 11.2.2 Recent Developments
- 11.3. Company Market Share Analysis 2025
- 11.3.1 Top 5 Companies Market Share Analysis
- 11.3.2 Top 3 Companies Market Share Analysis
- 11.4. List of Potential Customers
- 12. Research Methodology
List of Figures
- Figure 1: Global Phase Change Thermal Interface Materials Market Revenue Breakdown (Million, %) by Region 2025 & 2033
- Figure 2: Asia Pacific Phase Change Thermal Interface Materials Market Revenue (Million), by Conductive Type 2025 & 2033
- Figure 3: Asia Pacific Phase Change Thermal Interface Materials Market Revenue Share (%), by Conductive Type 2025 & 2033
- Figure 4: Asia Pacific Phase Change Thermal Interface Materials Market Revenue (Million), by Binder Type 2025 & 2033
- Figure 5: Asia Pacific Phase Change Thermal Interface Materials Market Revenue Share (%), by Binder Type 2025 & 2033
- Figure 6: Asia Pacific Phase Change Thermal Interface Materials Market Revenue (Million), by Filler Type 2025 & 2033
- Figure 7: Asia Pacific Phase Change Thermal Interface Materials Market Revenue Share (%), by Filler Type 2025 & 2033
- Figure 8: Asia Pacific Phase Change Thermal Interface Materials Market Revenue (Million), by End-user Industry 2025 & 2033
- Figure 9: Asia Pacific Phase Change Thermal Interface Materials Market Revenue Share (%), by End-user Industry 2025 & 2033
- Figure 10: Asia Pacific Phase Change Thermal Interface Materials Market Revenue (Million), by Country 2025 & 2033
- Figure 11: Asia Pacific Phase Change Thermal Interface Materials Market Revenue Share (%), by Country 2025 & 2033
- Figure 12: North America Phase Change Thermal Interface Materials Market Revenue (Million), by Conductive Type 2025 & 2033
- Figure 13: North America Phase Change Thermal Interface Materials Market Revenue Share (%), by Conductive Type 2025 & 2033
- Figure 14: North America Phase Change Thermal Interface Materials Market Revenue (Million), by Binder Type 2025 & 2033
- Figure 15: North America Phase Change Thermal Interface Materials Market Revenue Share (%), by Binder Type 2025 & 2033
- Figure 16: North America Phase Change Thermal Interface Materials Market Revenue (Million), by Filler Type 2025 & 2033
- Figure 17: North America Phase Change Thermal Interface Materials Market Revenue Share (%), by Filler Type 2025 & 2033
- Figure 18: North America Phase Change Thermal Interface Materials Market Revenue (Million), by End-user Industry 2025 & 2033
- Figure 19: North America Phase Change Thermal Interface Materials Market Revenue Share (%), by End-user Industry 2025 & 2033
- Figure 20: North America Phase Change Thermal Interface Materials Market Revenue (Million), by Country 2025 & 2033
- Figure 21: North America Phase Change Thermal Interface Materials Market Revenue Share (%), by Country 2025 & 2033
- Figure 22: Europe Phase Change Thermal Interface Materials Market Revenue (Million), by Conductive Type 2025 & 2033
- Figure 23: Europe Phase Change Thermal Interface Materials Market Revenue Share (%), by Conductive Type 2025 & 2033
- Figure 24: Europe Phase Change Thermal Interface Materials Market Revenue (Million), by Binder Type 2025 & 2033
- Figure 25: Europe Phase Change Thermal Interface Materials Market Revenue Share (%), by Binder Type 2025 & 2033
- Figure 26: Europe Phase Change Thermal Interface Materials Market Revenue (Million), by Filler Type 2025 & 2033
- Figure 27: Europe Phase Change Thermal Interface Materials Market Revenue Share (%), by Filler Type 2025 & 2033
- Figure 28: Europe Phase Change Thermal Interface Materials Market Revenue (Million), by End-user Industry 2025 & 2033
- Figure 29: Europe Phase Change Thermal Interface Materials Market Revenue Share (%), by End-user Industry 2025 & 2033
- Figure 30: Europe Phase Change Thermal Interface Materials Market Revenue (Million), by Country 2025 & 2033
- Figure 31: Europe Phase Change Thermal Interface Materials Market Revenue Share (%), by Country 2025 & 2033
- Figure 32: Rest of World Phase Change Thermal Interface Materials Market Revenue (Million), by Conductive Type 2025 & 2033
- Figure 33: Rest of World Phase Change Thermal Interface Materials Market Revenue Share (%), by Conductive Type 2025 & 2033
- Figure 34: Rest of World Phase Change Thermal Interface Materials Market Revenue (Million), by Binder Type 2025 & 2033
- Figure 35: Rest of World Phase Change Thermal Interface Materials Market Revenue Share (%), by Binder Type 2025 & 2033
- Figure 36: Rest of World Phase Change Thermal Interface Materials Market Revenue (Million), by Filler Type 2025 & 2033
- Figure 37: Rest of World Phase Change Thermal Interface Materials Market Revenue Share (%), by Filler Type 2025 & 2033
- Figure 38: Rest of World Phase Change Thermal Interface Materials Market Revenue (Million), by End-user Industry 2025 & 2033
- Figure 39: Rest of World Phase Change Thermal Interface Materials Market Revenue Share (%), by End-user Industry 2025 & 2033
- Figure 40: Rest of World Phase Change Thermal Interface Materials Market Revenue (Million), by Country 2025 & 2033
- Figure 41: Rest of World Phase Change Thermal Interface Materials Market Revenue Share (%), by Country 2025 & 2033
List of Tables
- Table 1: Global Phase Change Thermal Interface Materials Market Revenue Million Forecast, by Conductive Type 2020 & 2033
- Table 2: Global Phase Change Thermal Interface Materials Market Revenue Million Forecast, by Binder Type 2020 & 2033
- Table 3: Global Phase Change Thermal Interface Materials Market Revenue Million Forecast, by Filler Type 2020 & 2033
- Table 4: Global Phase Change Thermal Interface Materials Market Revenue Million Forecast, by End-user Industry 2020 & 2033
- Table 5: Global Phase Change Thermal Interface Materials Market Revenue Million Forecast, by Region 2020 & 2033
- Table 6: Global Phase Change Thermal Interface Materials Market Revenue Million Forecast, by Conductive Type 2020 & 2033
- Table 7: Global Phase Change Thermal Interface Materials Market Revenue Million Forecast, by Binder Type 2020 & 2033
- Table 8: Global Phase Change Thermal Interface Materials Market Revenue Million Forecast, by Filler Type 2020 & 2033
- Table 9: Global Phase Change Thermal Interface Materials Market Revenue Million Forecast, by End-user Industry 2020 & 2033
- Table 10: Global Phase Change Thermal Interface Materials Market Revenue Million Forecast, by Country 2020 & 2033
- Table 11: China Phase Change Thermal Interface Materials Market Revenue (Million) Forecast, by Application 2020 & 2033
- Table 12: India Phase Change Thermal Interface Materials Market Revenue (Million) Forecast, by Application 2020 & 2033
- Table 13: Japan Phase Change Thermal Interface Materials Market Revenue (Million) Forecast, by Application 2020 & 2033
- Table 14: South Korea Phase Change Thermal Interface Materials Market Revenue (Million) Forecast, by Application 2020 & 2033
- Table 15: Rest of Asia Pacific Phase Change Thermal Interface Materials Market Revenue (Million) Forecast, by Application 2020 & 2033
- Table 16: Global Phase Change Thermal Interface Materials Market Revenue Million Forecast, by Conductive Type 2020 & 2033
- Table 17: Global Phase Change Thermal Interface Materials Market Revenue Million Forecast, by Binder Type 2020 & 2033
- Table 18: Global Phase Change Thermal Interface Materials Market Revenue Million Forecast, by Filler Type 2020 & 2033
- Table 19: Global Phase Change Thermal Interface Materials Market Revenue Million Forecast, by End-user Industry 2020 & 2033
- Table 20: Global Phase Change Thermal Interface Materials Market Revenue Million Forecast, by Country 2020 & 2033
- Table 21: United States Phase Change Thermal Interface Materials Market Revenue (Million) Forecast, by Application 2020 & 2033
- Table 22: Canada Phase Change Thermal Interface Materials Market Revenue (Million) Forecast, by Application 2020 & 2033
- Table 23: Mexico Phase Change Thermal Interface Materials Market Revenue (Million) Forecast, by Application 2020 & 2033
- Table 24: Global Phase Change Thermal Interface Materials Market Revenue Million Forecast, by Conductive Type 2020 & 2033
- Table 25: Global Phase Change Thermal Interface Materials Market Revenue Million Forecast, by Binder Type 2020 & 2033
- Table 26: Global Phase Change Thermal Interface Materials Market Revenue Million Forecast, by Filler Type 2020 & 2033
- Table 27: Global Phase Change Thermal Interface Materials Market Revenue Million Forecast, by End-user Industry 2020 & 2033
- Table 28: Global Phase Change Thermal Interface Materials Market Revenue Million Forecast, by Country 2020 & 2033
- Table 29: Germany Phase Change Thermal Interface Materials Market Revenue (Million) Forecast, by Application 2020 & 2033
- Table 30: United Kingdom Phase Change Thermal Interface Materials Market Revenue (Million) Forecast, by Application 2020 & 2033
- Table 31: Italy Phase Change Thermal Interface Materials Market Revenue (Million) Forecast, by Application 2020 & 2033
- Table 32: France Phase Change Thermal Interface Materials Market Revenue (Million) Forecast, by Application 2020 & 2033
- Table 33: Rest of Europe Phase Change Thermal Interface Materials Market Revenue (Million) Forecast, by Application 2020 & 2033
- Table 34: Global Phase Change Thermal Interface Materials Market Revenue Million Forecast, by Conductive Type 2020 & 2033
- Table 35: Global Phase Change Thermal Interface Materials Market Revenue Million Forecast, by Binder Type 2020 & 2033
- Table 36: Global Phase Change Thermal Interface Materials Market Revenue Million Forecast, by Filler Type 2020 & 2033
- Table 37: Global Phase Change Thermal Interface Materials Market Revenue Million Forecast, by End-user Industry 2020 & 2033
- Table 38: Global Phase Change Thermal Interface Materials Market Revenue Million Forecast, by Country 2020 & 2033
- Table 39: Brazil Phase Change Thermal Interface Materials Market Revenue (Million) Forecast, by Application 2020 & 2033
- Table 40: Saudi Arabia Phase Change Thermal Interface Materials Market Revenue (Million) Forecast, by Application 2020 & 2033
- Table 41: South Africa Phase Change Thermal Interface Materials Market Revenue (Million) Forecast, by Application 2020 & 2033
- Table 42: Rest of the World Phase Change Thermal Interface Materials Market Revenue (Million) Forecast, by Application 2020 & 2033
Frequently Asked Questions
1. What is the projected Compound Annual Growth Rate (CAGR) of the Phase Change Thermal Interface Materials Market?
The projected CAGR is approximately > 11.00%.
2. Which companies are prominent players in the Phase Change Thermal Interface Materials Market?
Key companies in the market include Henkel AG & Co KGaA, Wakefield-Vette*List Not Exhaustive, Honeywell International Inc, Stockwell Elastomerics, TCP Reliable Inc, Specialty Silicone Products (SSP), Microtek Laboratories Inc, NuSil Technology, Enerdyne Thermal Solutions, Parker Chomerics, 3M, GrafTech, Croda International PLC, AI Technology, Dow, Arctic Silver, Laird Technologies, Datum Phase Change Ltd, Aavid Thermalloy, Phase Change Energy Solutions Inc (PCES).
3. What are the main segments of the Phase Change Thermal Interface Materials Market?
The market segments include Conductive Type, Binder Type, Filler Type, End-user Industry.
4. Can you provide details about the market size?
The market size is estimated to be USD XX Million as of 2022.
5. What are some drivers contributing to market growth?
; Growing Consumer Electronics Industry; High Cost of Surface Finishing; Augmented Functionality of Electronic Devices; Increasing Demand from the Gaming Module Industry.
6. What are the notable trends driving market growth?
The Growing Consumer Electronics Industry.
7. Are there any restraints impacting market growth?
; Reduction in Size of Mobile Handsets; Reduced Demand in Japan; Development of Non-silicone Substitutes.
8. Can you provide examples of recent developments in the market?
N/A
9. What pricing options are available for accessing the report?
Pricing options include single-user, multi-user, and enterprise licenses priced at USD 4750, USD 5250, and USD 8750 respectively.
10. Is the market size provided in terms of value or volume?
The market size is provided in terms of value, measured in Million.
11. Are there any specific market keywords associated with the report?
Yes, the market keyword associated with the report is "Phase Change Thermal Interface Materials Market," which aids in identifying and referencing the specific market segment covered.
12. How do I determine which pricing option suits my needs best?
The pricing options vary based on user requirements and access needs. Individual users may opt for single-user licenses, while businesses requiring broader access may choose multi-user or enterprise licenses for cost-effective access to the report.
13. Are there any additional resources or data provided in the Phase Change Thermal Interface Materials Market report?
While the report offers comprehensive insights, it's advisable to review the specific contents or supplementary materials provided to ascertain if additional resources or data are available.
14. How can I stay updated on further developments or reports in the Phase Change Thermal Interface Materials Market?
To stay informed about further developments, trends, and reports in the Phase Change Thermal Interface Materials Market, consider subscribing to industry newsletters, following relevant companies and organizations, or regularly checking reputable industry news sources and publications.
Methodology
Step 1 - Identification of Relevant Samples Size from Population Database


Step 2 - Approaches for Defining Global Market Size (Value, Volume* & Price*)

Note*: In applicable scenarios
Step 3 - Data Sources
Primary Research
- Web Analytics
- Survey Reports
- Research Institute
- Latest Research Reports
- Opinion Leaders
Secondary Research
- Annual Reports
- White Paper
- Latest Press Release
- Industry Association
- Paid Database
- Investor Presentations

Step 4 - Data Triangulation
Involves using different sources of information in order to increase the validity of a study
These sources are likely to be stakeholders in a program - participants, other researchers, program staff, other community members, and so on.
Then we put all data in single framework & apply various statistical tools to find out the dynamic on the market.
During the analysis stage, feedback from the stakeholder groups would be compared to determine areas of agreement as well as areas of divergence