
Key Insights
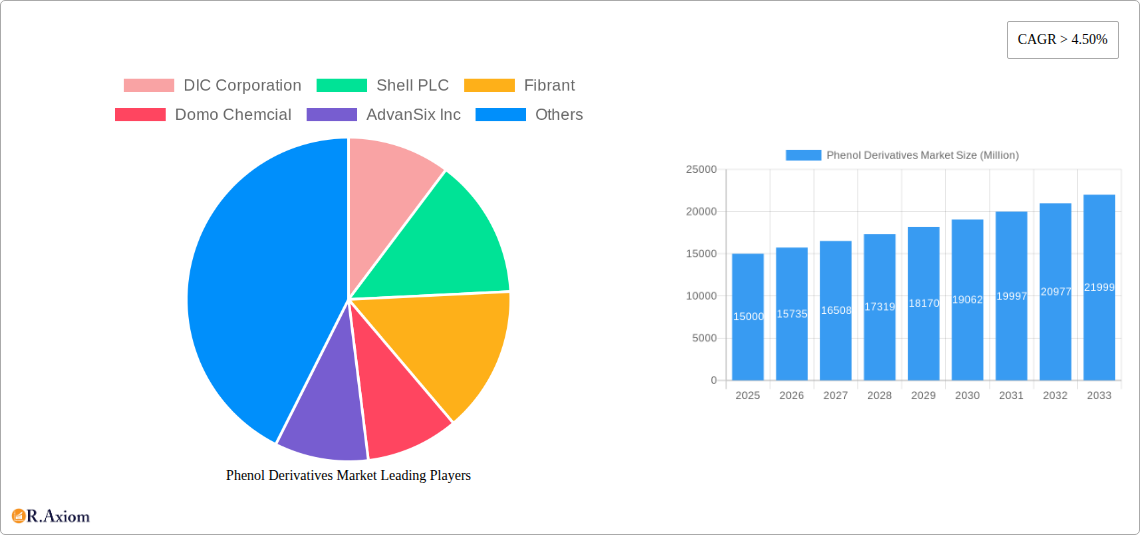
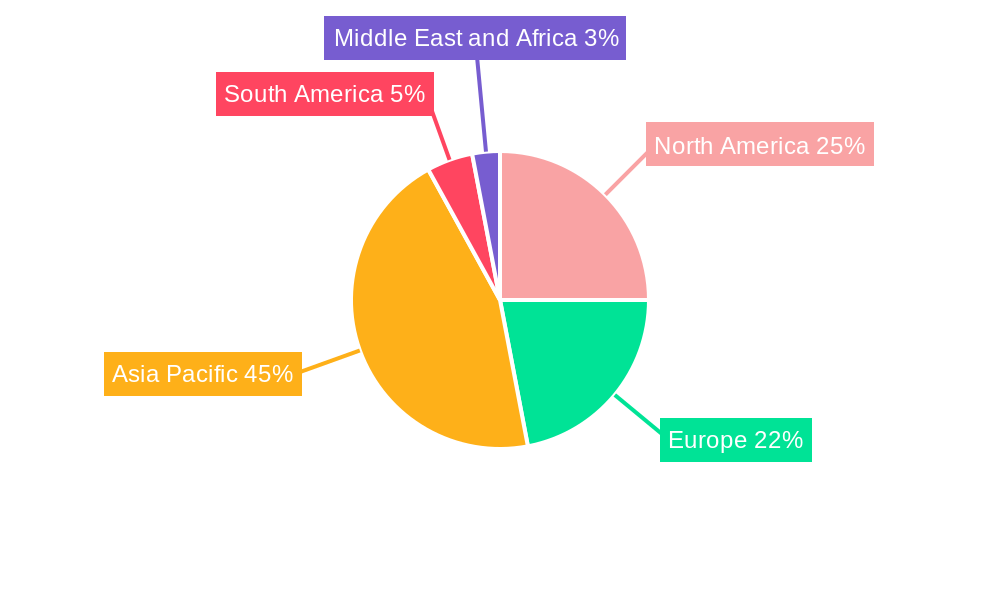
The Phenol Derivatives market is experiencing robust growth, projected to maintain a CAGR exceeding 4.50% from 2025 to 2033. This expansion is fueled by increasing demand across diverse sectors. The automotive industry's reliance on bisphenol-A for manufacturing components and the construction sector's use of phenolic resins for adhesives and coatings are key drivers. Furthermore, the burgeoning packaging industry necessitates caprolactam and adipic acid for nylon production, contributing significantly to market growth. Technological advancements leading to the development of high-performance phenol derivatives with enhanced properties further stimulate market expansion. However, fluctuating raw material prices and stringent environmental regulations pose challenges to sustained growth. Regional analysis reveals that the Asia-Pacific region, particularly China and India, dominates the market due to rapid industrialization and substantial manufacturing activities. North America and Europe also hold significant market shares, driven by established chemical industries and robust consumer demand. The market segmentation by derivative highlights the substantial contribution of Bisphenol-A, Phenolic Resin, Caprolactam, and Adipic Acid, each exhibiting unique growth trajectories influenced by specific application demands. Competitive analysis indicates that major players like DIC Corporation, Shell PLC, BASF SE, and Ineos are vying for market share through innovation, strategic partnerships, and geographic expansion.
The forecast period (2025-2033) anticipates continued growth, albeit at a potentially moderated pace as certain market segments mature. Nevertheless, emerging applications in advanced materials, electronics, and specialized chemicals are expected to offset potential slowdowns. The market’s resilience is supported by its essential role in various industries. Companies are focusing on sustainable manufacturing practices and environmentally friendly phenol derivative production to mitigate regulatory hurdles and meet evolving consumer preferences. Future market trends will likely center around enhanced product performance, sustainability, and cost optimization strategies. The interplay between technological advancements and regulatory pressures will shape the competitive landscape and define the future trajectory of the Phenol Derivatives market.
Phenol Derivatives Market: A Comprehensive Report (2019-2033)
This in-depth report provides a comprehensive analysis of the global Phenol Derivatives market, covering the period 2019-2033. It offers actionable insights for industry stakeholders, investors, and market entrants, providing a detailed understanding of market dynamics, growth drivers, and future opportunities. The report leverages extensive data analysis and expert insights to present a robust forecast for the market's trajectory, encompassing various segments and geographical regions. With a focus on key players and recent industry developments, this report is an invaluable resource for navigating the complexities of the phenol derivatives landscape.
Phenol Derivatives Market Concentration & Innovation
The Phenol Derivatives market exhibits a moderately concentrated structure, with a handful of major players holding significant market share. However, the presence of numerous smaller players and regional manufacturers contributes to competitive intensity. Market share data for 2024 suggests that the top five players collectively hold approximately xx% of the global market, while the remaining share is dispersed among numerous regional and specialized companies.
Innovation in the phenol derivatives sector is driven primarily by the need for sustainable and high-performance materials. Significant R&D efforts are focused on developing bio-based phenol derivatives, reducing reliance on fossil fuels. Regulatory frameworks, particularly those related to environmental sustainability and chemical safety, play a crucial role in shaping innovation trajectories. Product substitutes, such as alternative polymers and resins, exert pressure on market participants, necessitating continuous innovation to maintain competitiveness. End-user trends, including increasing demand for lightweight and high-strength materials across various industries (automotive, construction, electronics), are driving demand for innovative phenol derivatives.
Mergers and acquisitions (M&A) activity in this sector remains relatively robust, with deals primarily focused on expanding production capacities, enhancing technological capabilities, and accessing new markets. The average deal value over the past five years has been approximately xx Million, although significant variations exist depending on the size and scope of the transaction.
- Key M&A activities (2019-2024): (Specific deal examples would be included here if available, along with deal values)
- Market Concentration Metrics (2024): Top 5 players hold xx%, Top 10 players hold xx%.
- Innovation Focus: Bio-based derivatives, sustainable manufacturing processes, high-performance materials.
Phenol Derivatives Market Industry Trends & Insights
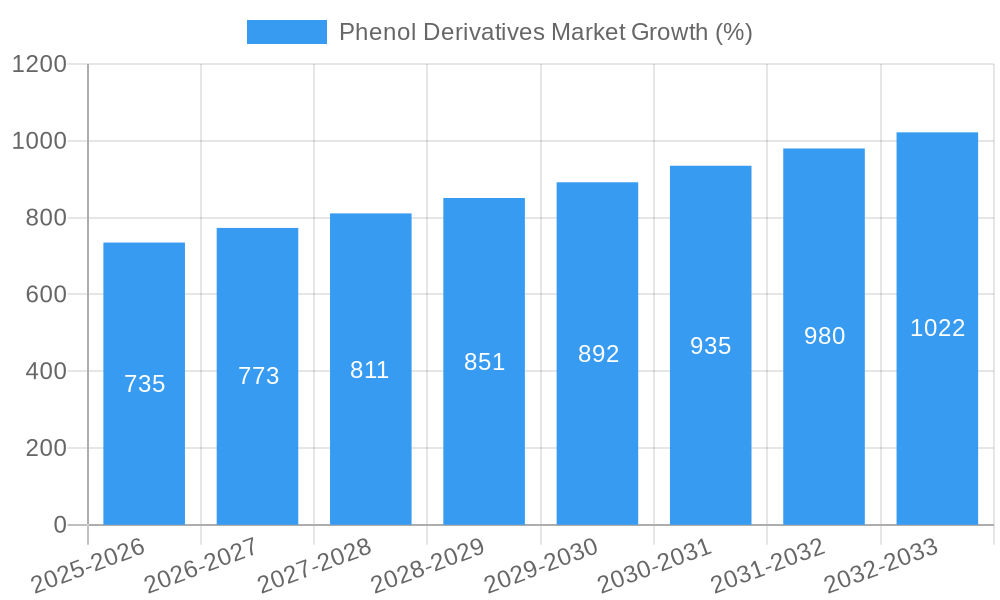
The global Phenol Derivatives market is projected to experience significant growth during the forecast period (2025-2033), driven by rising demand from diverse end-use industries. The Compound Annual Growth Rate (CAGR) is estimated at xx% between 2025 and 2033, exceeding previous growth rates observed during the historical period (2019-2024). This accelerated growth is fueled by several factors, including the increasing adoption of phenol derivatives in various applications, such as coatings, adhesives, and plastics. Technological advancements in production processes, leading to higher efficiency and reduced costs, are further contributing to market expansion.
Consumer preferences for sustainable and environmentally friendly products are also driving demand for bio-based phenol derivatives. The market penetration of bio-based options is currently low but projected to increase significantly over the forecast period, reaching an estimated xx% market share by 2033. Competitive dynamics are shaped by factors such as pricing strategies, product differentiation, and technological innovation. Established players are investing heavily in R&D to develop novel products and improve production efficiency. The market also experiences some level of price volatility, which is influenced by fluctuations in raw material costs and global economic conditions.
Dominant Markets & Segments in Phenol Derivatives Market
The Asia-Pacific region is currently the dominant market for phenol derivatives, owing to rapid industrialization and substantial economic growth in countries like China and India. High infrastructure development and favorable government policies promoting industrial growth are key drivers for this regional dominance.
By Derivatives Segment Dominance Analysis:
- Bisphenol-A: This segment holds a significant market share due to its extensive use in the production of polycarbonate plastics and epoxy resins, used in automotive, electronics, and construction industries. Growth is expected to be driven by increased demand for these end-use applications, particularly in emerging economies.
- Phenolic Resin: The phenolic resin segment maintains a strong market position owing to its versatility and wide range of applications, including adhesives, coatings, and molding compounds. Growth will continue to be driven by demand in construction and automotive.
- Caprolactam: This segment's growth is linked to the demand for nylon 6, a significant polymer with applications in textiles, carpets, and engineering plastics.
- Adipic Acid: Primarily used in the production of nylon 6,6, this segment is closely tied to the nylon market's growth trends.
- Other Derivatives: This segment encompasses a variety of specialized phenol derivatives with niche applications, showing potential for growth based on specific market demand.
Key Drivers (Examples for Asia-Pacific):
- Rapid industrialization and urbanization.
- Growing automotive and construction sectors.
- Increasing disposable income leading to higher consumer spending.
- Supportive government policies promoting manufacturing and infrastructure development.
Phenol Derivatives Market Product Developments
Recent product developments in the phenol derivatives market focus on sustainability and enhanced performance. Bio-based phenol derivatives are gaining traction, offering environmentally friendly alternatives to traditional petroleum-based products. Innovations in resin formulations are resulting in improved properties such as enhanced durability, heat resistance, and flexibility, catering to evolving end-user requirements. These developments are broadening applications across diverse industries, driving market expansion and strengthening competitiveness.
Report Scope & Segmentation Analysis
This report segments the Phenol Derivatives market by derivatives: Bisphenol-A, Phenolic Resin, Caprolactam, Adipic Acid, and Other Derivatives. Each segment's market size, growth projections, and competitive dynamics are analyzed thoroughly. Market sizes are provided for each segment for the historical period (2019-2024), base year (2025), and forecast period (2025-2033), expressed in Million USD. The competitive landscape within each segment is also assessed, highlighting key players and their market strategies.
Key Drivers of Phenol Derivatives Market Growth
The growth of the Phenol Derivatives market is driven by several factors, including the increasing demand from various industries, particularly the automotive, construction, and electronics sectors. Technological advancements leading to the development of high-performance, sustainable, and cost-effective phenol derivatives also contribute to market expansion. Favorable government policies promoting industrial growth and infrastructure development in several regions further boost market demand. The global shift towards eco-friendly materials is a significant catalyst, increasing the demand for bio-based derivatives.
Challenges in the Phenol Derivatives Market Sector
The Phenol Derivatives market faces challenges, including fluctuating raw material prices, which impact production costs and profitability. Stringent environmental regulations and safety standards impose compliance costs and potentially limit production capacity. Intense competition among established and emerging players puts pressure on pricing and profit margins. Supply chain disruptions, particularly those related to raw material sourcing and logistics, can affect production and market stability. These factors, together, can cause significant fluctuations in market dynamics.
Emerging Opportunities in Phenol Derivatives Market
Emerging opportunities for growth lie in the increasing adoption of bio-based phenol derivatives to meet sustainability goals. The development of new applications in high-growth industries, such as renewable energy and advanced materials, presents significant potential for market expansion. Technological advancements in production processes, such as improved efficiency and reduced environmental impact, offer opportunities for cost reduction and increased competitiveness. Expansion into new geographical markets, particularly in developing economies, presents further growth potential.
Leading Players in the Phenol Derivatives Market Market
- DIC Corporation
- Shell PLC
- Fibrant
- Domo Chemical
- AdvanSix Inc
- Cepsa
- Altivia
- BASF SE
- INEOS Capital Ltd
- Fujian Yongrong Jinjiang Co Ltd
- PTT Phenol Company Limited
- Solvay SA
- Mitsubishi Chemical Corporation
- Mitsui Chemicals Inc
Key Developments in Phenol Derivatives Market Industry
- August 2022: A new bisphenol-A production facility opened in Pune, India, reducing reliance on imports from the US and China (1.35 lakh tons annually). This significantly impacts the regional supply chain and market share dynamics.
- June 2022: INEOS Phenol launched its first bio-attributed product line (INVIRIDIS), highlighting a significant shift towards sustainable production methods. This development signifies a crucial step towards environmentally friendly phenol derivatives and impacts the competitive landscape significantly.
Strategic Outlook for Phenol Derivatives Market Market
The Phenol Derivatives market exhibits strong growth potential driven by several factors. Continued innovation in sustainable production methods, expanding applications in emerging industries, and favorable government policies supporting industrial growth will further propel market expansion. The increasing demand for high-performance and eco-friendly materials in various applications will create substantial opportunities for growth throughout the forecast period. The market is poised for robust expansion, offering significant opportunities for both established players and new entrants.
Phenol Derivatives Market Segmentation
-
1. Derivatives
- 1.1. Bisphenol-A
- 1.2. Phenolic Resin
- 1.3. Caprolactam
- 1.4. Adipic Acid
- 1.5. Other Derivatives
Phenol Derivatives Market Segmentation By Geography
-
1. Asia Pacific
- 1.1. China
- 1.2. India
- 1.3. Japan
- 1.4. South Korea
- 1.5. Rest of Asia Pacific
-
2. North America
- 2.1. United States
- 2.2. Canada
- 2.3. Mexico
-
3. Europe
- 3.1. Germany
- 3.2. France
- 3.3. United Kingdom
- 3.4. Italy
- 3.5. Rest of the Europe
-
4. South America
- 4.1. Brazil
- 4.2. Argentina
- 4.3. Rest of South America
-
5. Middle East and Africa
- 5.1. Saudi Arabia
- 5.2. South Africa
- 5.3. Rest of Middle East and Africa
Phenol Derivatives Market REPORT HIGHLIGHTS
| Aspects | Details |
|---|---|
| Study Period | 2019-2033 |
| Base Year | 2024 |
| Estimated Year | 2025 |
| Forecast Period | 2025-2033 |
| Historical Period | 2019-2024 |
| Growth Rate | CAGR of > 4.50% from 2019-2033 |
| Segmentation |
|
Table of Contents
- 1. Introduction
- 1.1. Research Scope
- 1.2. Market Segmentation
- 1.3. Research Methodology
- 1.4. Definitions and Assumptions
- 2. Executive Summary
- 2.1. Introduction
- 3. Market Dynamics
- 3.1. Introduction
- 3.2. Market Drivers
- 3.2.1 Growing Demand from the Pharmaceutical Industry; Increasing Use of Phenol Derivatives in the Production of Agrochemicals
- 3.2.2 Dyes
- 3.2.3 and Other Specialty Chemicals.
- 3.3. Market Restrains
- 3.3.1. Stringent Environmental Regulations; Volatility in Raw Material Prices
- 3.4. Market Trends
- 3.4.1. Soaring Demand for Phenolic Resin
- 4. Market Factor Analysis
- 4.1. Porters Five Forces
- 4.2. Supply/Value Chain
- 4.3. PESTEL analysis
- 4.4. Market Entropy
- 4.5. Patent/Trademark Analysis
- 5. Global Phenol Derivatives Market Analysis, Insights and Forecast, 2019-2031
- 5.1. Market Analysis, Insights and Forecast - by Derivatives
- 5.1.1. Bisphenol-A
- 5.1.2. Phenolic Resin
- 5.1.3. Caprolactam
- 5.1.4. Adipic Acid
- 5.1.5. Other Derivatives
- 5.2. Market Analysis, Insights and Forecast - by Region
- 5.2.1. Asia Pacific
- 5.2.2. North America
- 5.2.3. Europe
- 5.2.4. South America
- 5.2.5. Middle East and Africa
- 5.1. Market Analysis, Insights and Forecast - by Derivatives
- 6. Asia Pacific Phenol Derivatives Market Analysis, Insights and Forecast, 2019-2031
- 6.1. Market Analysis, Insights and Forecast - by Derivatives
- 6.1.1. Bisphenol-A
- 6.1.2. Phenolic Resin
- 6.1.3. Caprolactam
- 6.1.4. Adipic Acid
- 6.1.5. Other Derivatives
- 6.1. Market Analysis, Insights and Forecast - by Derivatives
- 7. North America Phenol Derivatives Market Analysis, Insights and Forecast, 2019-2031
- 7.1. Market Analysis, Insights and Forecast - by Derivatives
- 7.1.1. Bisphenol-A
- 7.1.2. Phenolic Resin
- 7.1.3. Caprolactam
- 7.1.4. Adipic Acid
- 7.1.5. Other Derivatives
- 7.1. Market Analysis, Insights and Forecast - by Derivatives
- 8. Europe Phenol Derivatives Market Analysis, Insights and Forecast, 2019-2031
- 8.1. Market Analysis, Insights and Forecast - by Derivatives
- 8.1.1. Bisphenol-A
- 8.1.2. Phenolic Resin
- 8.1.3. Caprolactam
- 8.1.4. Adipic Acid
- 8.1.5. Other Derivatives
- 8.1. Market Analysis, Insights and Forecast - by Derivatives
- 9. South America Phenol Derivatives Market Analysis, Insights and Forecast, 2019-2031
- 9.1. Market Analysis, Insights and Forecast - by Derivatives
- 9.1.1. Bisphenol-A
- 9.1.2. Phenolic Resin
- 9.1.3. Caprolactam
- 9.1.4. Adipic Acid
- 9.1.5. Other Derivatives
- 9.1. Market Analysis, Insights and Forecast - by Derivatives
- 10. Middle East and Africa Phenol Derivatives Market Analysis, Insights and Forecast, 2019-2031
- 10.1. Market Analysis, Insights and Forecast - by Derivatives
- 10.1.1. Bisphenol-A
- 10.1.2. Phenolic Resin
- 10.1.3. Caprolactam
- 10.1.4. Adipic Acid
- 10.1.5. Other Derivatives
- 10.1. Market Analysis, Insights and Forecast - by Derivatives
- 11. Asia Pacific Phenol Derivatives Market Analysis, Insights and Forecast, 2019-2031
- 11.1. Market Analysis, Insights and Forecast - By Country/Sub-region
- 11.1.1 China
- 11.1.2 India
- 11.1.3 Japan
- 11.1.4 South Korea
- 11.1.5 Rest of Asia Pacific
- 12. North America Phenol Derivatives Market Analysis, Insights and Forecast, 2019-2031
- 12.1. Market Analysis, Insights and Forecast - By Country/Sub-region
- 12.1.1 United States
- 12.1.2 Canada
- 12.1.3 Mexico
- 13. Europe Phenol Derivatives Market Analysis, Insights and Forecast, 2019-2031
- 13.1. Market Analysis, Insights and Forecast - By Country/Sub-region
- 13.1.1 Germany
- 13.1.2 France
- 13.1.3 United Kingdom
- 13.1.4 Italy
- 13.1.5 Rest of the Europe
- 14. South America Phenol Derivatives Market Analysis, Insights and Forecast, 2019-2031
- 14.1. Market Analysis, Insights and Forecast - By Country/Sub-region
- 14.1.1 Brazil
- 14.1.2 Argentina
- 14.1.3 Rest of South America
- 15. Middle East and Africa Phenol Derivatives Market Analysis, Insights and Forecast, 2019-2031
- 15.1. Market Analysis, Insights and Forecast - By Country/Sub-region
- 15.1.1 Saudi Arabia
- 15.1.2 South Africa
- 15.1.3 Rest of Middle East and Africa
- 16. Competitive Analysis
- 16.1. Global Market Share Analysis 2024
- 16.2. Company Profiles
- 16.2.1 DIC Corporation
- 16.2.1.1. Overview
- 16.2.1.2. Products
- 16.2.1.3. SWOT Analysis
- 16.2.1.4. Recent Developments
- 16.2.1.5. Financials (Based on Availability)
- 16.2.2 Shell PLC
- 16.2.2.1. Overview
- 16.2.2.2. Products
- 16.2.2.3. SWOT Analysis
- 16.2.2.4. Recent Developments
- 16.2.2.5. Financials (Based on Availability)
- 16.2.3 Fibrant
- 16.2.3.1. Overview
- 16.2.3.2. Products
- 16.2.3.3. SWOT Analysis
- 16.2.3.4. Recent Developments
- 16.2.3.5. Financials (Based on Availability)
- 16.2.4 Domo Chemcial
- 16.2.4.1. Overview
- 16.2.4.2. Products
- 16.2.4.3. SWOT Analysis
- 16.2.4.4. Recent Developments
- 16.2.4.5. Financials (Based on Availability)
- 16.2.5 AdvanSix Inc
- 16.2.5.1. Overview
- 16.2.5.2. Products
- 16.2.5.3. SWOT Analysis
- 16.2.5.4. Recent Developments
- 16.2.5.5. Financials (Based on Availability)
- 16.2.6 Cepsa
- 16.2.6.1. Overview
- 16.2.6.2. Products
- 16.2.6.3. SWOT Analysis
- 16.2.6.4. Recent Developments
- 16.2.6.5. Financials (Based on Availability)
- 16.2.7 Altivia
- 16.2.7.1. Overview
- 16.2.7.2. Products
- 16.2.7.3. SWOT Analysis
- 16.2.7.4. Recent Developments
- 16.2.7.5. Financials (Based on Availability)
- 16.2.8 BASF SE
- 16.2.8.1. Overview
- 16.2.8.2. Products
- 16.2.8.3. SWOT Analysis
- 16.2.8.4. Recent Developments
- 16.2.8.5. Financials (Based on Availability)
- 16.2.9 INEOS Capital Ltd
- 16.2.9.1. Overview
- 16.2.9.2. Products
- 16.2.9.3. SWOT Analysis
- 16.2.9.4. Recent Developments
- 16.2.9.5. Financials (Based on Availability)
- 16.2.10 Fujian Yongrong Jinjiang Co Ltd
- 16.2.10.1. Overview
- 16.2.10.2. Products
- 16.2.10.3. SWOT Analysis
- 16.2.10.4. Recent Developments
- 16.2.10.5. Financials (Based on Availability)
- 16.2.11 PTT Phenol Company Limited
- 16.2.11.1. Overview
- 16.2.11.2. Products
- 16.2.11.3. SWOT Analysis
- 16.2.11.4. Recent Developments
- 16.2.11.5. Financials (Based on Availability)
- 16.2.12 Solvay SA*List Not Exhaustive
- 16.2.12.1. Overview
- 16.2.12.2. Products
- 16.2.12.3. SWOT Analysis
- 16.2.12.4. Recent Developments
- 16.2.12.5. Financials (Based on Availability)
- 16.2.13 Mitsubishi Chemcial Corporation
- 16.2.13.1. Overview
- 16.2.13.2. Products
- 16.2.13.3. SWOT Analysis
- 16.2.13.4. Recent Developments
- 16.2.13.5. Financials (Based on Availability)
- 16.2.14 Mitsui Chemcials Inc
- 16.2.14.1. Overview
- 16.2.14.2. Products
- 16.2.14.3. SWOT Analysis
- 16.2.14.4. Recent Developments
- 16.2.14.5. Financials (Based on Availability)
- 16.2.1 DIC Corporation
List of Figures
- Figure 1: Global Phenol Derivatives Market Revenue Breakdown (Million, %) by Region 2024 & 2032
- Figure 2: Asia Pacific Phenol Derivatives Market Revenue (Million), by Country 2024 & 2032
- Figure 3: Asia Pacific Phenol Derivatives Market Revenue Share (%), by Country 2024 & 2032
- Figure 4: North America Phenol Derivatives Market Revenue (Million), by Country 2024 & 2032
- Figure 5: North America Phenol Derivatives Market Revenue Share (%), by Country 2024 & 2032
- Figure 6: Europe Phenol Derivatives Market Revenue (Million), by Country 2024 & 2032
- Figure 7: Europe Phenol Derivatives Market Revenue Share (%), by Country 2024 & 2032
- Figure 8: South America Phenol Derivatives Market Revenue (Million), by Country 2024 & 2032
- Figure 9: South America Phenol Derivatives Market Revenue Share (%), by Country 2024 & 2032
- Figure 10: Middle East and Africa Phenol Derivatives Market Revenue (Million), by Country 2024 & 2032
- Figure 11: Middle East and Africa Phenol Derivatives Market Revenue Share (%), by Country 2024 & 2032
- Figure 12: Asia Pacific Phenol Derivatives Market Revenue (Million), by Derivatives 2024 & 2032
- Figure 13: Asia Pacific Phenol Derivatives Market Revenue Share (%), by Derivatives 2024 & 2032
- Figure 14: Asia Pacific Phenol Derivatives Market Revenue (Million), by Country 2024 & 2032
- Figure 15: Asia Pacific Phenol Derivatives Market Revenue Share (%), by Country 2024 & 2032
- Figure 16: North America Phenol Derivatives Market Revenue (Million), by Derivatives 2024 & 2032
- Figure 17: North America Phenol Derivatives Market Revenue Share (%), by Derivatives 2024 & 2032
- Figure 18: North America Phenol Derivatives Market Revenue (Million), by Country 2024 & 2032
- Figure 19: North America Phenol Derivatives Market Revenue Share (%), by Country 2024 & 2032
- Figure 20: Europe Phenol Derivatives Market Revenue (Million), by Derivatives 2024 & 2032
- Figure 21: Europe Phenol Derivatives Market Revenue Share (%), by Derivatives 2024 & 2032
- Figure 22: Europe Phenol Derivatives Market Revenue (Million), by Country 2024 & 2032
- Figure 23: Europe Phenol Derivatives Market Revenue Share (%), by Country 2024 & 2032
- Figure 24: South America Phenol Derivatives Market Revenue (Million), by Derivatives 2024 & 2032
- Figure 25: South America Phenol Derivatives Market Revenue Share (%), by Derivatives 2024 & 2032
- Figure 26: South America Phenol Derivatives Market Revenue (Million), by Country 2024 & 2032
- Figure 27: South America Phenol Derivatives Market Revenue Share (%), by Country 2024 & 2032
- Figure 28: Middle East and Africa Phenol Derivatives Market Revenue (Million), by Derivatives 2024 & 2032
- Figure 29: Middle East and Africa Phenol Derivatives Market Revenue Share (%), by Derivatives 2024 & 2032
- Figure 30: Middle East and Africa Phenol Derivatives Market Revenue (Million), by Country 2024 & 2032
- Figure 31: Middle East and Africa Phenol Derivatives Market Revenue Share (%), by Country 2024 & 2032
List of Tables
- Table 1: Global Phenol Derivatives Market Revenue Million Forecast, by Region 2019 & 2032
- Table 2: Global Phenol Derivatives Market Revenue Million Forecast, by Derivatives 2019 & 2032
- Table 3: Global Phenol Derivatives Market Revenue Million Forecast, by Region 2019 & 2032
- Table 4: Global Phenol Derivatives Market Revenue Million Forecast, by Country 2019 & 2032
- Table 5: China Phenol Derivatives Market Revenue (Million) Forecast, by Application 2019 & 2032
- Table 6: India Phenol Derivatives Market Revenue (Million) Forecast, by Application 2019 & 2032
- Table 7: Japan Phenol Derivatives Market Revenue (Million) Forecast, by Application 2019 & 2032
- Table 8: South Korea Phenol Derivatives Market Revenue (Million) Forecast, by Application 2019 & 2032
- Table 9: Rest of Asia Pacific Phenol Derivatives Market Revenue (Million) Forecast, by Application 2019 & 2032
- Table 10: Global Phenol Derivatives Market Revenue Million Forecast, by Country 2019 & 2032
- Table 11: United States Phenol Derivatives Market Revenue (Million) Forecast, by Application 2019 & 2032
- Table 12: Canada Phenol Derivatives Market Revenue (Million) Forecast, by Application 2019 & 2032
- Table 13: Mexico Phenol Derivatives Market Revenue (Million) Forecast, by Application 2019 & 2032
- Table 14: Global Phenol Derivatives Market Revenue Million Forecast, by Country 2019 & 2032
- Table 15: Germany Phenol Derivatives Market Revenue (Million) Forecast, by Application 2019 & 2032
- Table 16: France Phenol Derivatives Market Revenue (Million) Forecast, by Application 2019 & 2032
- Table 17: United Kingdom Phenol Derivatives Market Revenue (Million) Forecast, by Application 2019 & 2032
- Table 18: Italy Phenol Derivatives Market Revenue (Million) Forecast, by Application 2019 & 2032
- Table 19: Rest of the Europe Phenol Derivatives Market Revenue (Million) Forecast, by Application 2019 & 2032
- Table 20: Global Phenol Derivatives Market Revenue Million Forecast, by Country 2019 & 2032
- Table 21: Brazil Phenol Derivatives Market Revenue (Million) Forecast, by Application 2019 & 2032
- Table 22: Argentina Phenol Derivatives Market Revenue (Million) Forecast, by Application 2019 & 2032
- Table 23: Rest of South America Phenol Derivatives Market Revenue (Million) Forecast, by Application 2019 & 2032
- Table 24: Global Phenol Derivatives Market Revenue Million Forecast, by Country 2019 & 2032
- Table 25: Saudi Arabia Phenol Derivatives Market Revenue (Million) Forecast, by Application 2019 & 2032
- Table 26: South Africa Phenol Derivatives Market Revenue (Million) Forecast, by Application 2019 & 2032
- Table 27: Rest of Middle East and Africa Phenol Derivatives Market Revenue (Million) Forecast, by Application 2019 & 2032
- Table 28: Global Phenol Derivatives Market Revenue Million Forecast, by Derivatives 2019 & 2032
- Table 29: Global Phenol Derivatives Market Revenue Million Forecast, by Country 2019 & 2032
- Table 30: China Phenol Derivatives Market Revenue (Million) Forecast, by Application 2019 & 2032
- Table 31: India Phenol Derivatives Market Revenue (Million) Forecast, by Application 2019 & 2032
- Table 32: Japan Phenol Derivatives Market Revenue (Million) Forecast, by Application 2019 & 2032
- Table 33: South Korea Phenol Derivatives Market Revenue (Million) Forecast, by Application 2019 & 2032
- Table 34: Rest of Asia Pacific Phenol Derivatives Market Revenue (Million) Forecast, by Application 2019 & 2032
- Table 35: Global Phenol Derivatives Market Revenue Million Forecast, by Derivatives 2019 & 2032
- Table 36: Global Phenol Derivatives Market Revenue Million Forecast, by Country 2019 & 2032
- Table 37: United States Phenol Derivatives Market Revenue (Million) Forecast, by Application 2019 & 2032
- Table 38: Canada Phenol Derivatives Market Revenue (Million) Forecast, by Application 2019 & 2032
- Table 39: Mexico Phenol Derivatives Market Revenue (Million) Forecast, by Application 2019 & 2032
- Table 40: Global Phenol Derivatives Market Revenue Million Forecast, by Derivatives 2019 & 2032
- Table 41: Global Phenol Derivatives Market Revenue Million Forecast, by Country 2019 & 2032
- Table 42: Germany Phenol Derivatives Market Revenue (Million) Forecast, by Application 2019 & 2032
- Table 43: France Phenol Derivatives Market Revenue (Million) Forecast, by Application 2019 & 2032
- Table 44: United Kingdom Phenol Derivatives Market Revenue (Million) Forecast, by Application 2019 & 2032
- Table 45: Italy Phenol Derivatives Market Revenue (Million) Forecast, by Application 2019 & 2032
- Table 46: Rest of the Europe Phenol Derivatives Market Revenue (Million) Forecast, by Application 2019 & 2032
- Table 47: Global Phenol Derivatives Market Revenue Million Forecast, by Derivatives 2019 & 2032
- Table 48: Global Phenol Derivatives Market Revenue Million Forecast, by Country 2019 & 2032
- Table 49: Brazil Phenol Derivatives Market Revenue (Million) Forecast, by Application 2019 & 2032
- Table 50: Argentina Phenol Derivatives Market Revenue (Million) Forecast, by Application 2019 & 2032
- Table 51: Rest of South America Phenol Derivatives Market Revenue (Million) Forecast, by Application 2019 & 2032
- Table 52: Global Phenol Derivatives Market Revenue Million Forecast, by Derivatives 2019 & 2032
- Table 53: Global Phenol Derivatives Market Revenue Million Forecast, by Country 2019 & 2032
- Table 54: Saudi Arabia Phenol Derivatives Market Revenue (Million) Forecast, by Application 2019 & 2032
- Table 55: South Africa Phenol Derivatives Market Revenue (Million) Forecast, by Application 2019 & 2032
- Table 56: Rest of Middle East and Africa Phenol Derivatives Market Revenue (Million) Forecast, by Application 2019 & 2032
Frequently Asked Questions
1. What is the projected Compound Annual Growth Rate (CAGR) of the Phenol Derivatives Market?
The projected CAGR is approximately > 4.50%.
2. Which companies are prominent players in the Phenol Derivatives Market?
Key companies in the market include DIC Corporation, Shell PLC, Fibrant, Domo Chemcial, AdvanSix Inc, Cepsa, Altivia, BASF SE, INEOS Capital Ltd, Fujian Yongrong Jinjiang Co Ltd, PTT Phenol Company Limited, Solvay SA*List Not Exhaustive, Mitsubishi Chemcial Corporation, Mitsui Chemcials Inc.
3. What are the main segments of the Phenol Derivatives Market?
The market segments include Derivatives.
4. Can you provide details about the market size?
The market size is estimated to be USD XX Million as of 2022.
5. What are some drivers contributing to market growth?
Growing Demand from the Pharmaceutical Industry; Increasing Use of Phenol Derivatives in the Production of Agrochemicals. Dyes. and Other Specialty Chemicals..
6. What are the notable trends driving market growth?
Soaring Demand for Phenolic Resin.
7. Are there any restraints impacting market growth?
Stringent Environmental Regulations; Volatility in Raw Material Prices.
8. Can you provide examples of recent developments in the market?
August 2022: A new bisphenol-A production facility was opened in Pune, India. This facility will reduce imports of bisphenol-A to India by promoting domestic manufacturing. 1.35 lakh tons of bisphenol-A are imported into India from the United States and China.
9. What pricing options are available for accessing the report?
Pricing options include single-user, multi-user, and enterprise licenses priced at USD 4750, USD 5250, and USD 8750 respectively.
10. Is the market size provided in terms of value or volume?
The market size is provided in terms of value, measured in Million.
11. Are there any specific market keywords associated with the report?
Yes, the market keyword associated with the report is "Phenol Derivatives Market," which aids in identifying and referencing the specific market segment covered.
12. How do I determine which pricing option suits my needs best?
The pricing options vary based on user requirements and access needs. Individual users may opt for single-user licenses, while businesses requiring broader access may choose multi-user or enterprise licenses for cost-effective access to the report.
13. Are there any additional resources or data provided in the Phenol Derivatives Market report?
While the report offers comprehensive insights, it's advisable to review the specific contents or supplementary materials provided to ascertain if additional resources or data are available.
14. How can I stay updated on further developments or reports in the Phenol Derivatives Market?
To stay informed about further developments, trends, and reports in the Phenol Derivatives Market, consider subscribing to industry newsletters, following relevant companies and organizations, or regularly checking reputable industry news sources and publications.
Methodology
Step 1 - Identification of Relevant Samples Size from Population Database


Step 2 - Approaches for Defining Global Market Size (Value, Volume* & Price*)

Note*: In applicable scenarios
Step 3 - Data Sources
Primary Research
- Web Analytics
- Survey Reports
- Research Institute
- Latest Research Reports
- Opinion Leaders
Secondary Research
- Annual Reports
- White Paper
- Latest Press Release
- Industry Association
- Paid Database
- Investor Presentations

Step 4 - Data Triangulation
Involves using different sources of information in order to increase the validity of a study
These sources are likely to be stakeholders in a program - participants, other researchers, program staff, other community members, and so on.
Then we put all data in single framework & apply various statistical tools to find out the dynamic on the market.
During the analysis stage, feedback from the stakeholder groups would be compared to determine areas of agreement as well as areas of divergence


