
Key Insights
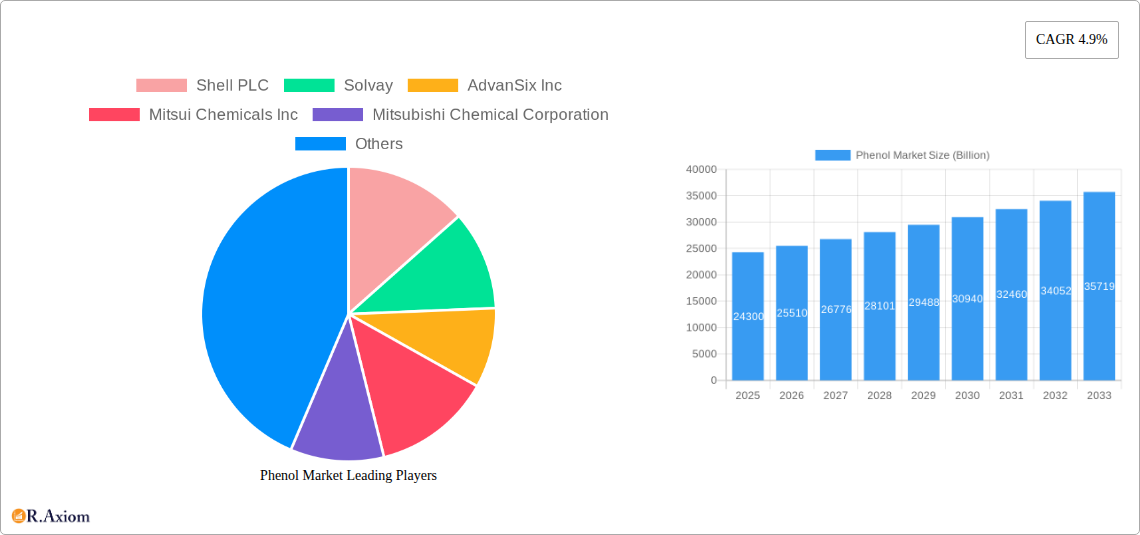
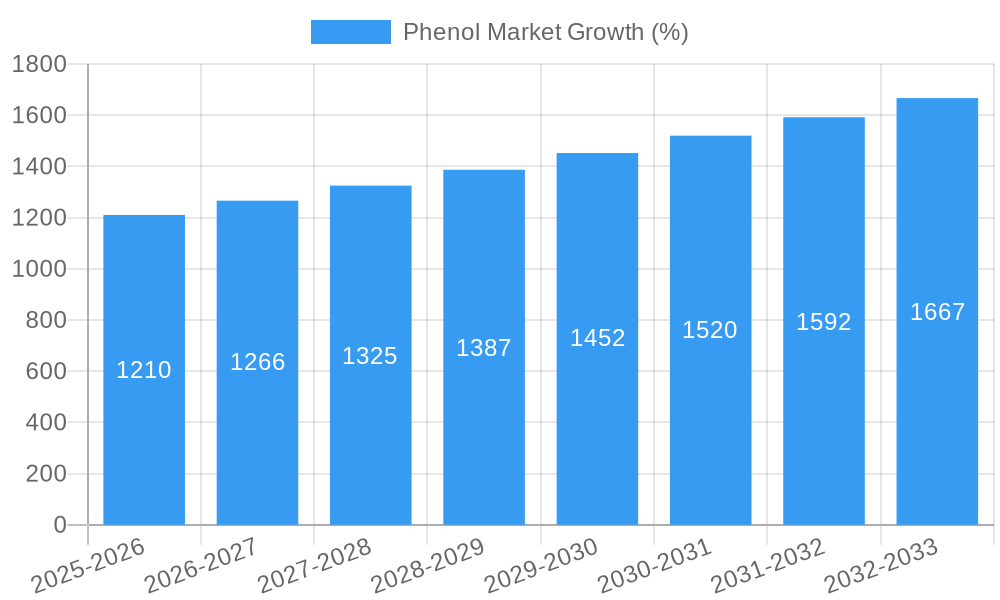
The global phenol market, valued at $24.3 billion in 2025, is projected to experience robust growth, driven by a Compound Annual Growth Rate (CAGR) of 4.9% from 2025 to 2033. This expansion is fueled by increasing demand from key downstream applications, particularly in the production of phenolic resins, a crucial component in construction, automotive, and electrical industries. Growth in the Asia-Pacific region, specifically in China and India, is expected to significantly contribute to overall market expansion due to rapid industrialization and infrastructure development. The rising adoption of bisphenol-A (BPA) in various applications, despite growing concerns regarding its potential health impacts, continues to drive market demand, although this segment’s growth may be tempered by the search for sustainable alternatives. Furthermore, the increasing production of caprolactam, a key precursor in nylon production, contributes to the market's overall growth trajectory. However, fluctuating raw material prices and stringent environmental regulations pose challenges to market expansion. The competitive landscape features several key players including Shell PLC, Solvay, and Mitsui Chemicals, each vying for market share through strategic partnerships, capacity expansions, and product innovations.
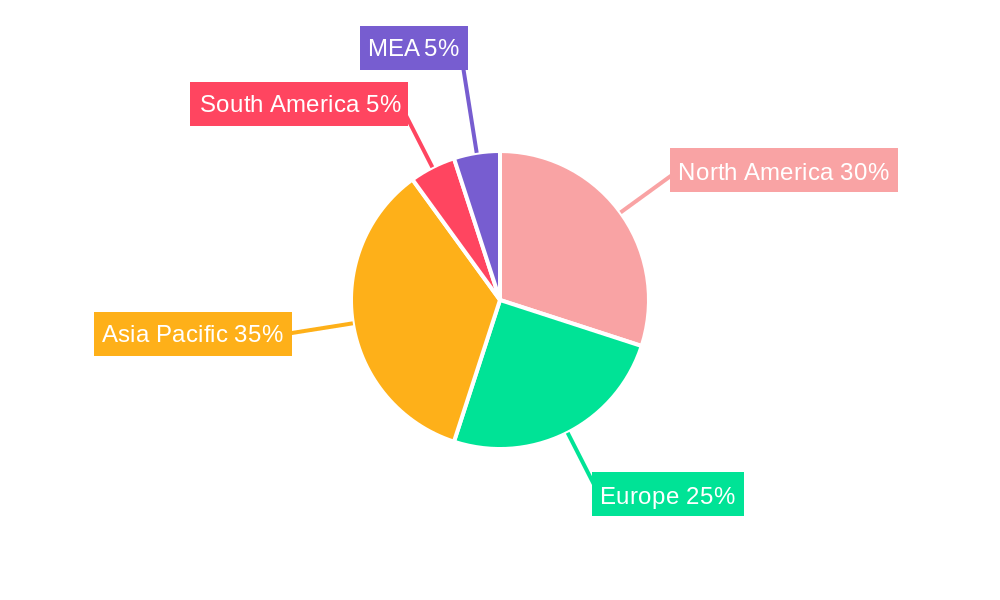
The market segmentation reveals phenolic resins as the dominant product type, followed by caprolactam and bisphenol-A. North America and Europe currently hold significant market shares, reflecting established manufacturing bases and strong downstream demand. However, the Asia-Pacific region is poised for accelerated growth, surpassing other regions in the coming years. The forecast period (2025-2033) will witness continuous market evolution driven by technological advancements in phenol production, increasing focus on sustainable production methods, and the emergence of novel applications. This will lead to a reshaping of the competitive landscape and the continued growth of the global phenol market. While challenges exist, the overall outlook remains optimistic, projecting substantial market expansion throughout the forecast period.
Phenol Market: A Comprehensive Report (2019-2033)
This comprehensive report provides an in-depth analysis of the global Phenol market, offering valuable insights for industry stakeholders, investors, and strategic decision-makers. With a study period spanning 2019-2033, a base year of 2025, and a forecast period of 2025-2033, this report leverages extensive data analysis to present a clear picture of current market dynamics and future growth trajectories. The market size is estimated at XX Billion in 2025 and is projected to reach XX Billion by 2033.
Phenol Market Market Concentration & Innovation
The Phenol market exhibits a moderately concentrated structure, with key players holding significant market share. Shell PLC, Solvay, and INEOS Capital Limited are among the leading companies, commanding a combined market share of approximately xx%. However, the market also features several mid-sized and smaller players, contributing to competitive intensity. Innovation in the phenol market is driven by the increasing demand for sustainable and high-performance materials. Companies are investing heavily in R&D to develop eco-friendly production processes and explore new applications for phenol-based products. The regulatory landscape plays a significant role, with stringent environmental regulations driving the adoption of cleaner production technologies. Product substitutes, such as bio-based phenols, are emerging as a challenge, but their market penetration remains limited. End-user trends, particularly in the construction and automotive industries, are shaping demand patterns. Mergers and acquisitions (M&A) are a prominent feature of the market landscape, as illustrated by the INEOS Phenol acquisition of Mitsui Phenols Singapore Ltd's assets in 2022 for USD 330 million, demonstrating a consolidation trend within the industry. Further M&A activity is expected in the forecast period, driven by economies of scale and access to new technologies and markets. The total value of M&A deals in the phenol market during the historical period (2019-2024) amounted to approximately XX Billion.
Phenol Market Industry Trends & Insights
The global phenol market is experiencing robust growth, driven by a surge in demand across various end-use industries. The construction sector, fueled by infrastructure development and urbanization, is a major driver. The automotive industry also plays a significant role due to the use of phenol-based resins in automotive components. The compound annual growth rate (CAGR) for the phenol market is projected to be approximately xx% during the forecast period (2025-2033). Technological disruptions, such as the development of more efficient and sustainable production processes, are further fueling market expansion. Consumer preferences for eco-friendly products are increasingly influencing demand for sustainably sourced phenol and phenol-based products. Competitive dynamics are characterized by intense competition among established players and the emergence of new entrants, particularly in the sustainable phenol segment. The market penetration of bio-based phenol is still relatively low, but it is projected to increase gradually in the coming years, driven by growing environmental concerns and government support for sustainable materials.
Dominant Markets & Segments in Phenol Market
The Asia-Pacific region dominates the global phenol market, driven by rapid industrialization and infrastructure development in countries such as China and India. Within the product type segment, phenolic resins account for the largest market share due to their widespread use in various applications, including adhesives, coatings, and composites.
- Key Drivers for Asia-Pacific Dominance:
- Rapid industrialization and urbanization.
- Significant infrastructure development projects.
- Growing demand from construction and automotive sectors.
- Favorable economic policies and government support.
Bisphenol-A (BPA) also holds a significant market share, primarily due to its applications in polycarbonate plastics and epoxy resins. The demand for Caprolactum is relatively lower compared to phenolic resins and BPA. The "Other Product Types" segment includes various niche applications of phenol, and while it holds a smaller overall market share, it shows potential for growth driven by innovations in specific applications. The European market shows moderate growth due to mature economies and a stronger focus on sustainable solutions. The North American market also shows significant growth due to its advanced chemical industry and established infrastructure.
Phenol Market Product Developments
Recent innovations in the phenol market focus on the development of sustainable and high-performance materials. Companies are exploring alternative feedstocks and adopting cleaner production processes to reduce environmental impact. The development of bio-based phenols is a significant trend, driven by growing environmental concerns and regulatory pressures. These advancements lead to new applications and improved product performance, enhancing the competitiveness of phenol-based products in diverse industries. This focus on sustainability and product improvement is a key aspect driving further growth in this already established market.
Report Scope & Segmentation Analysis
This report segments the Phenol market based on product type:
Phenolic Resins: This segment accounts for the largest market share, driven by wide applications in construction, automotive, and electronics. Growth is projected to remain robust due to ongoing infrastructure development and the increasing demand for high-performance materials. The competitive landscape is characterized by established players and emerging specialty chemical companies.
Caprolactum: This segment experiences steady growth, primarily due to its use in nylon production. Growth is expected to be driven by the textile and automotive industries.
Bisphenol-A (BPA): This segment faces challenges due to growing concerns about BPA's potential health effects. However, it still holds a significant market share due to its indispensable use in polycarbonate plastics and epoxy resins.
Other Product Types: This segment encompasses a range of niche applications for phenol and is expected to show moderate growth potential, driven by specialized material developments and applications.
Key Drivers of Phenol Market Growth
Several factors are driving the growth of the Phenol market. Firstly, the robust growth of end-use industries such as construction, automotive, and electronics fuels significant demand. Secondly, technological advancements, particularly in sustainable and high-performance materials, contribute to market expansion. Finally, supportive government policies and regulatory frameworks fostering innovation in the chemical sector further encourage growth.
Challenges in the Phenol Market Sector
The phenol market faces challenges such as stringent environmental regulations that increase production costs and require investments in cleaner technologies. Supply chain disruptions and fluctuations in raw material prices pose significant risks. Intense competition among established players and emerging entrants also presents a challenge. These factors can negatively affect profitability and market growth if not properly addressed.
Emerging Opportunities in Phenol Market
The Phenol market presents significant opportunities in the development and adoption of bio-based phenols, driven by growing sustainability concerns. The exploration of new applications in emerging technologies such as renewable energy and advanced materials also offers considerable potential. Expanding into developing economies with growing infrastructure projects presents further avenues for growth.
Leading Players in the Phenol Market Market
- Shell PLC
- Solvay
- AdvanSix Inc
- Mitsui Chemicals Inc
- Mitsubishi Chemical Corporation
- Cepsa
- Altivia
- Domo Chemical GmbH
- PTT Phenol Company Limited
- Formosa Chemicals & Fibre Corp
- INEOS Capital Limited
- Kumho P&B Chemicals Inc
Key Developments in Phenol Market Industry
August 2022: INEOS Phenol acquired the asset base of Mitsui Phenols Singapore Ltd, increasing production capacity by 1 million tonnes and enhancing its global reach. This significantly strengthened INEOS's position in the market.
April 2022: Cepsa launched NextPhenol, a sustainable chemical produced from recycled feedstock, showcasing a commitment to environmentally friendly production and potentially attracting environmentally conscious customers.
Strategic Outlook for Phenol Market Market
The Phenol market is poised for continued growth, driven by sustained demand from key end-use industries, innovation in sustainable production methods, and expansion into new markets. The focus on sustainability and the development of high-performance materials will be key growth catalysts in the coming years. Companies that successfully navigate environmental regulations and adopt innovative strategies will be well-positioned to capitalize on the market's potential.
Phenol Market Segmentation
-
1. Product Type
- 1.1. Phenolic Resins
- 1.2. Caprolactum
- 1.3. Bisphenol-A
- 1.4. Other Product Types
Phenol Market Segmentation By Geography
-
1. Asia Pacific
- 1.1. China
- 1.2. India
- 1.3. Japan
- 1.4. South Korea
- 1.5. Rest of Asia Pacific
-
2. North America
- 2.1. United States
- 2.2. Canada
- 2.3. Mexico
-
3. Europe
- 3.1. Germany
- 3.2. United Kingdom
- 3.3. France
- 3.4. Italy
- 3.5. Rest of Europe
-
4. South America
- 4.1. Brazil
- 4.2. Argentina
- 4.3. Rest of South America
-
5. Middle East and Africa
- 5.1. Saudi Arabia
- 5.2. South Africa
- 5.3. Rest of Middle East and Africa
Phenol Market REPORT HIGHLIGHTS
| Aspects | Details |
|---|---|
| Study Period | 2019-2033 |
| Base Year | 2024 |
| Estimated Year | 2025 |
| Forecast Period | 2025-2033 |
| Historical Period | 2019-2024 |
| Growth Rate | CAGR of 4.9% from 2019-2033 |
| Segmentation |
|
Table of Contents
- 1. Introduction
- 1.1. Research Scope
- 1.2. Market Segmentation
- 1.3. Research Methodology
- 1.4. Definitions and Assumptions
- 2. Executive Summary
- 2.1. Introduction
- 3. Market Dynamics
- 3.1. Introduction
- 3.2. Market Drivers
- 3.2.1. High Demand of Bisphenol-A; Other Drivers
- 3.3. Market Restrains
- 3.3.1. Ban on BPA in the United States and Europe; Others Restraints
- 3.4. Market Trends
- 3.4.1. Bisphenol-A Product Type to Drive the Market
- 4. Market Factor Analysis
- 4.1. Porters Five Forces
- 4.2. Supply/Value Chain
- 4.3. PESTEL analysis
- 4.4. Market Entropy
- 4.5. Patent/Trademark Analysis
- 5. Global Phenol Market Analysis, Insights and Forecast, 2019-2031
- 5.1. Market Analysis, Insights and Forecast - by Product Type
- 5.1.1. Phenolic Resins
- 5.1.2. Caprolactum
- 5.1.3. Bisphenol-A
- 5.1.4. Other Product Types
- 5.2. Market Analysis, Insights and Forecast - by Region
- 5.2.1. Asia Pacific
- 5.2.2. North America
- 5.2.3. Europe
- 5.2.4. South America
- 5.2.5. Middle East and Africa
- 5.1. Market Analysis, Insights and Forecast - by Product Type
- 6. Asia Pacific Phenol Market Analysis, Insights and Forecast, 2019-2031
- 6.1. Market Analysis, Insights and Forecast - by Product Type
- 6.1.1. Phenolic Resins
- 6.1.2. Caprolactum
- 6.1.3. Bisphenol-A
- 6.1.4. Other Product Types
- 6.1. Market Analysis, Insights and Forecast - by Product Type
- 7. North America Phenol Market Analysis, Insights and Forecast, 2019-2031
- 7.1. Market Analysis, Insights and Forecast - by Product Type
- 7.1.1. Phenolic Resins
- 7.1.2. Caprolactum
- 7.1.3. Bisphenol-A
- 7.1.4. Other Product Types
- 7.1. Market Analysis, Insights and Forecast - by Product Type
- 8. Europe Phenol Market Analysis, Insights and Forecast, 2019-2031
- 8.1. Market Analysis, Insights and Forecast - by Product Type
- 8.1.1. Phenolic Resins
- 8.1.2. Caprolactum
- 8.1.3. Bisphenol-A
- 8.1.4. Other Product Types
- 8.1. Market Analysis, Insights and Forecast - by Product Type
- 9. South America Phenol Market Analysis, Insights and Forecast, 2019-2031
- 9.1. Market Analysis, Insights and Forecast - by Product Type
- 9.1.1. Phenolic Resins
- 9.1.2. Caprolactum
- 9.1.3. Bisphenol-A
- 9.1.4. Other Product Types
- 9.1. Market Analysis, Insights and Forecast - by Product Type
- 10. Middle East and Africa Phenol Market Analysis, Insights and Forecast, 2019-2031
- 10.1. Market Analysis, Insights and Forecast - by Product Type
- 10.1.1. Phenolic Resins
- 10.1.2. Caprolactum
- 10.1.3. Bisphenol-A
- 10.1.4. Other Product Types
- 10.1. Market Analysis, Insights and Forecast - by Product Type
- 11. North America Phenol Market Analysis, Insights and Forecast, 2019-2031
- 11.1. Market Analysis, Insights and Forecast - By Country/Sub-region
- 11.1.1 United States
- 11.1.2 Canada
- 11.1.3 Mexico
- 12. Europe Phenol Market Analysis, Insights and Forecast, 2019-2031
- 12.1. Market Analysis, Insights and Forecast - By Country/Sub-region
- 12.1.1 Germany
- 12.1.2 France
- 12.1.3 Italy
- 12.1.4 United Kingdom
- 12.1.5 Netherlands
- 12.1.6 Rest of Europe
- 13. Asia Pacific Phenol Market Analysis, Insights and Forecast, 2019-2031
- 13.1. Market Analysis, Insights and Forecast - By Country/Sub-region
- 13.1.1 China
- 13.1.2 Japan
- 13.1.3 India
- 13.1.4 South Korea
- 13.1.5 Taiwan
- 13.1.6 Australia
- 13.1.7 Rest of Asia-Pacific
- 14. South America Phenol Market Analysis, Insights and Forecast, 2019-2031
- 14.1. Market Analysis, Insights and Forecast - By Country/Sub-region
- 14.1.1 Brazil
- 14.1.2 Argentina
- 14.1.3 Rest of South America
- 15. MEA Phenol Market Analysis, Insights and Forecast, 2019-2031
- 15.1. Market Analysis, Insights and Forecast - By Country/Sub-region
- 15.1.1 Middle East
- 15.1.2 Africa
- 16. Competitive Analysis
- 16.1. Global Market Share Analysis 2024
- 16.2. Company Profiles
- 16.2.1 Shell PLC
- 16.2.1.1. Overview
- 16.2.1.2. Products
- 16.2.1.3. SWOT Analysis
- 16.2.1.4. Recent Developments
- 16.2.1.5. Financials (Based on Availability)
- 16.2.2 Solvay
- 16.2.2.1. Overview
- 16.2.2.2. Products
- 16.2.2.3. SWOT Analysis
- 16.2.2.4. Recent Developments
- 16.2.2.5. Financials (Based on Availability)
- 16.2.3 AdvanSix Inc
- 16.2.3.1. Overview
- 16.2.3.2. Products
- 16.2.3.3. SWOT Analysis
- 16.2.3.4. Recent Developments
- 16.2.3.5. Financials (Based on Availability)
- 16.2.4 Mitsui Chemicals Inc
- 16.2.4.1. Overview
- 16.2.4.2. Products
- 16.2.4.3. SWOT Analysis
- 16.2.4.4. Recent Developments
- 16.2.4.5. Financials (Based on Availability)
- 16.2.5 Mitsubishi Chemical Corporation
- 16.2.5.1. Overview
- 16.2.5.2. Products
- 16.2.5.3. SWOT Analysis
- 16.2.5.4. Recent Developments
- 16.2.5.5. Financials (Based on Availability)
- 16.2.6 Cepsa
- 16.2.6.1. Overview
- 16.2.6.2. Products
- 16.2.6.3. SWOT Analysis
- 16.2.6.4. Recent Developments
- 16.2.6.5. Financials (Based on Availability)
- 16.2.7 Altivia
- 16.2.7.1. Overview
- 16.2.7.2. Products
- 16.2.7.3. SWOT Analysis
- 16.2.7.4. Recent Developments
- 16.2.7.5. Financials (Based on Availability)
- 16.2.8 Domo Chemical GmbH
- 16.2.8.1. Overview
- 16.2.8.2. Products
- 16.2.8.3. SWOT Analysis
- 16.2.8.4. Recent Developments
- 16.2.8.5. Financials (Based on Availability)
- 16.2.9 PTT Phenol Company Limited
- 16.2.9.1. Overview
- 16.2.9.2. Products
- 16.2.9.3. SWOT Analysis
- 16.2.9.4. Recent Developments
- 16.2.9.5. Financials (Based on Availability)
- 16.2.10 Formosa Chemicals & Fibre Corp
- 16.2.10.1. Overview
- 16.2.10.2. Products
- 16.2.10.3. SWOT Analysis
- 16.2.10.4. Recent Developments
- 16.2.10.5. Financials (Based on Availability)
- 16.2.11 INEOS Capital Limited
- 16.2.11.1. Overview
- 16.2.11.2. Products
- 16.2.11.3. SWOT Analysis
- 16.2.11.4. Recent Developments
- 16.2.11.5. Financials (Based on Availability)
- 16.2.12 Kumho P&B Chemicals Inc
- 16.2.12.1. Overview
- 16.2.12.2. Products
- 16.2.12.3. SWOT Analysis
- 16.2.12.4. Recent Developments
- 16.2.12.5. Financials (Based on Availability)
- 16.2.1 Shell PLC
List of Figures
- Figure 1: Global Phenol Market Revenue Breakdown (Billion, %) by Region 2024 & 2032
- Figure 2: Global Phenol Market Volume Breakdown (K Tons, %) by Region 2024 & 2032
- Figure 3: North America Phenol Market Revenue (Billion), by Country 2024 & 2032
- Figure 4: North America Phenol Market Volume (K Tons), by Country 2024 & 2032
- Figure 5: North America Phenol Market Revenue Share (%), by Country 2024 & 2032
- Figure 6: North America Phenol Market Volume Share (%), by Country 2024 & 2032
- Figure 7: Europe Phenol Market Revenue (Billion), by Country 2024 & 2032
- Figure 8: Europe Phenol Market Volume (K Tons), by Country 2024 & 2032
- Figure 9: Europe Phenol Market Revenue Share (%), by Country 2024 & 2032
- Figure 10: Europe Phenol Market Volume Share (%), by Country 2024 & 2032
- Figure 11: Asia Pacific Phenol Market Revenue (Billion), by Country 2024 & 2032
- Figure 12: Asia Pacific Phenol Market Volume (K Tons), by Country 2024 & 2032
- Figure 13: Asia Pacific Phenol Market Revenue Share (%), by Country 2024 & 2032
- Figure 14: Asia Pacific Phenol Market Volume Share (%), by Country 2024 & 2032
- Figure 15: South America Phenol Market Revenue (Billion), by Country 2024 & 2032
- Figure 16: South America Phenol Market Volume (K Tons), by Country 2024 & 2032
- Figure 17: South America Phenol Market Revenue Share (%), by Country 2024 & 2032
- Figure 18: South America Phenol Market Volume Share (%), by Country 2024 & 2032
- Figure 19: MEA Phenol Market Revenue (Billion), by Country 2024 & 2032
- Figure 20: MEA Phenol Market Volume (K Tons), by Country 2024 & 2032
- Figure 21: MEA Phenol Market Revenue Share (%), by Country 2024 & 2032
- Figure 22: MEA Phenol Market Volume Share (%), by Country 2024 & 2032
- Figure 23: Asia Pacific Phenol Market Revenue (Billion), by Product Type 2024 & 2032
- Figure 24: Asia Pacific Phenol Market Volume (K Tons), by Product Type 2024 & 2032
- Figure 25: Asia Pacific Phenol Market Revenue Share (%), by Product Type 2024 & 2032
- Figure 26: Asia Pacific Phenol Market Volume Share (%), by Product Type 2024 & 2032
- Figure 27: Asia Pacific Phenol Market Revenue (Billion), by Country 2024 & 2032
- Figure 28: Asia Pacific Phenol Market Volume (K Tons), by Country 2024 & 2032
- Figure 29: Asia Pacific Phenol Market Revenue Share (%), by Country 2024 & 2032
- Figure 30: Asia Pacific Phenol Market Volume Share (%), by Country 2024 & 2032
- Figure 31: North America Phenol Market Revenue (Billion), by Product Type 2024 & 2032
- Figure 32: North America Phenol Market Volume (K Tons), by Product Type 2024 & 2032
- Figure 33: North America Phenol Market Revenue Share (%), by Product Type 2024 & 2032
- Figure 34: North America Phenol Market Volume Share (%), by Product Type 2024 & 2032
- Figure 35: North America Phenol Market Revenue (Billion), by Country 2024 & 2032
- Figure 36: North America Phenol Market Volume (K Tons), by Country 2024 & 2032
- Figure 37: North America Phenol Market Revenue Share (%), by Country 2024 & 2032
- Figure 38: North America Phenol Market Volume Share (%), by Country 2024 & 2032
- Figure 39: Europe Phenol Market Revenue (Billion), by Product Type 2024 & 2032
- Figure 40: Europe Phenol Market Volume (K Tons), by Product Type 2024 & 2032
- Figure 41: Europe Phenol Market Revenue Share (%), by Product Type 2024 & 2032
- Figure 42: Europe Phenol Market Volume Share (%), by Product Type 2024 & 2032
- Figure 43: Europe Phenol Market Revenue (Billion), by Country 2024 & 2032
- Figure 44: Europe Phenol Market Volume (K Tons), by Country 2024 & 2032
- Figure 45: Europe Phenol Market Revenue Share (%), by Country 2024 & 2032
- Figure 46: Europe Phenol Market Volume Share (%), by Country 2024 & 2032
- Figure 47: South America Phenol Market Revenue (Billion), by Product Type 2024 & 2032
- Figure 48: South America Phenol Market Volume (K Tons), by Product Type 2024 & 2032
- Figure 49: South America Phenol Market Revenue Share (%), by Product Type 2024 & 2032
- Figure 50: South America Phenol Market Volume Share (%), by Product Type 2024 & 2032
- Figure 51: South America Phenol Market Revenue (Billion), by Country 2024 & 2032
- Figure 52: South America Phenol Market Volume (K Tons), by Country 2024 & 2032
- Figure 53: South America Phenol Market Revenue Share (%), by Country 2024 & 2032
- Figure 54: South America Phenol Market Volume Share (%), by Country 2024 & 2032
- Figure 55: Middle East and Africa Phenol Market Revenue (Billion), by Product Type 2024 & 2032
- Figure 56: Middle East and Africa Phenol Market Volume (K Tons), by Product Type 2024 & 2032
- Figure 57: Middle East and Africa Phenol Market Revenue Share (%), by Product Type 2024 & 2032
- Figure 58: Middle East and Africa Phenol Market Volume Share (%), by Product Type 2024 & 2032
- Figure 59: Middle East and Africa Phenol Market Revenue (Billion), by Country 2024 & 2032
- Figure 60: Middle East and Africa Phenol Market Volume (K Tons), by Country 2024 & 2032
- Figure 61: Middle East and Africa Phenol Market Revenue Share (%), by Country 2024 & 2032
- Figure 62: Middle East and Africa Phenol Market Volume Share (%), by Country 2024 & 2032
List of Tables
- Table 1: Global Phenol Market Revenue Billion Forecast, by Region 2019 & 2032
- Table 2: Global Phenol Market Volume K Tons Forecast, by Region 2019 & 2032
- Table 3: Global Phenol Market Revenue Billion Forecast, by Product Type 2019 & 2032
- Table 4: Global Phenol Market Volume K Tons Forecast, by Product Type 2019 & 2032
- Table 5: Global Phenol Market Revenue Billion Forecast, by Region 2019 & 2032
- Table 6: Global Phenol Market Volume K Tons Forecast, by Region 2019 & 2032
- Table 7: Global Phenol Market Revenue Billion Forecast, by Country 2019 & 2032
- Table 8: Global Phenol Market Volume K Tons Forecast, by Country 2019 & 2032
- Table 9: United States Phenol Market Revenue (Billion) Forecast, by Application 2019 & 2032
- Table 10: United States Phenol Market Volume (K Tons) Forecast, by Application 2019 & 2032
- Table 11: Canada Phenol Market Revenue (Billion) Forecast, by Application 2019 & 2032
- Table 12: Canada Phenol Market Volume (K Tons) Forecast, by Application 2019 & 2032
- Table 13: Mexico Phenol Market Revenue (Billion) Forecast, by Application 2019 & 2032
- Table 14: Mexico Phenol Market Volume (K Tons) Forecast, by Application 2019 & 2032
- Table 15: Global Phenol Market Revenue Billion Forecast, by Country 2019 & 2032
- Table 16: Global Phenol Market Volume K Tons Forecast, by Country 2019 & 2032
- Table 17: Germany Phenol Market Revenue (Billion) Forecast, by Application 2019 & 2032
- Table 18: Germany Phenol Market Volume (K Tons) Forecast, by Application 2019 & 2032
- Table 19: France Phenol Market Revenue (Billion) Forecast, by Application 2019 & 2032
- Table 20: France Phenol Market Volume (K Tons) Forecast, by Application 2019 & 2032
- Table 21: Italy Phenol Market Revenue (Billion) Forecast, by Application 2019 & 2032
- Table 22: Italy Phenol Market Volume (K Tons) Forecast, by Application 2019 & 2032
- Table 23: United Kingdom Phenol Market Revenue (Billion) Forecast, by Application 2019 & 2032
- Table 24: United Kingdom Phenol Market Volume (K Tons) Forecast, by Application 2019 & 2032
- Table 25: Netherlands Phenol Market Revenue (Billion) Forecast, by Application 2019 & 2032
- Table 26: Netherlands Phenol Market Volume (K Tons) Forecast, by Application 2019 & 2032
- Table 27: Rest of Europe Phenol Market Revenue (Billion) Forecast, by Application 2019 & 2032
- Table 28: Rest of Europe Phenol Market Volume (K Tons) Forecast, by Application 2019 & 2032
- Table 29: Global Phenol Market Revenue Billion Forecast, by Country 2019 & 2032
- Table 30: Global Phenol Market Volume K Tons Forecast, by Country 2019 & 2032
- Table 31: China Phenol Market Revenue (Billion) Forecast, by Application 2019 & 2032
- Table 32: China Phenol Market Volume (K Tons) Forecast, by Application 2019 & 2032
- Table 33: Japan Phenol Market Revenue (Billion) Forecast, by Application 2019 & 2032
- Table 34: Japan Phenol Market Volume (K Tons) Forecast, by Application 2019 & 2032
- Table 35: India Phenol Market Revenue (Billion) Forecast, by Application 2019 & 2032
- Table 36: India Phenol Market Volume (K Tons) Forecast, by Application 2019 & 2032
- Table 37: South Korea Phenol Market Revenue (Billion) Forecast, by Application 2019 & 2032
- Table 38: South Korea Phenol Market Volume (K Tons) Forecast, by Application 2019 & 2032
- Table 39: Taiwan Phenol Market Revenue (Billion) Forecast, by Application 2019 & 2032
- Table 40: Taiwan Phenol Market Volume (K Tons) Forecast, by Application 2019 & 2032
- Table 41: Australia Phenol Market Revenue (Billion) Forecast, by Application 2019 & 2032
- Table 42: Australia Phenol Market Volume (K Tons) Forecast, by Application 2019 & 2032
- Table 43: Rest of Asia-Pacific Phenol Market Revenue (Billion) Forecast, by Application 2019 & 2032
- Table 44: Rest of Asia-Pacific Phenol Market Volume (K Tons) Forecast, by Application 2019 & 2032
- Table 45: Global Phenol Market Revenue Billion Forecast, by Country 2019 & 2032
- Table 46: Global Phenol Market Volume K Tons Forecast, by Country 2019 & 2032
- Table 47: Brazil Phenol Market Revenue (Billion) Forecast, by Application 2019 & 2032
- Table 48: Brazil Phenol Market Volume (K Tons) Forecast, by Application 2019 & 2032
- Table 49: Argentina Phenol Market Revenue (Billion) Forecast, by Application 2019 & 2032
- Table 50: Argentina Phenol Market Volume (K Tons) Forecast, by Application 2019 & 2032
- Table 51: Rest of South America Phenol Market Revenue (Billion) Forecast, by Application 2019 & 2032
- Table 52: Rest of South America Phenol Market Volume (K Tons) Forecast, by Application 2019 & 2032
- Table 53: Global Phenol Market Revenue Billion Forecast, by Country 2019 & 2032
- Table 54: Global Phenol Market Volume K Tons Forecast, by Country 2019 & 2032
- Table 55: Middle East Phenol Market Revenue (Billion) Forecast, by Application 2019 & 2032
- Table 56: Middle East Phenol Market Volume (K Tons) Forecast, by Application 2019 & 2032
- Table 57: Africa Phenol Market Revenue (Billion) Forecast, by Application 2019 & 2032
- Table 58: Africa Phenol Market Volume (K Tons) Forecast, by Application 2019 & 2032
- Table 59: Global Phenol Market Revenue Billion Forecast, by Product Type 2019 & 2032
- Table 60: Global Phenol Market Volume K Tons Forecast, by Product Type 2019 & 2032
- Table 61: Global Phenol Market Revenue Billion Forecast, by Country 2019 & 2032
- Table 62: Global Phenol Market Volume K Tons Forecast, by Country 2019 & 2032
- Table 63: China Phenol Market Revenue (Billion) Forecast, by Application 2019 & 2032
- Table 64: China Phenol Market Volume (K Tons) Forecast, by Application 2019 & 2032
- Table 65: India Phenol Market Revenue (Billion) Forecast, by Application 2019 & 2032
- Table 66: India Phenol Market Volume (K Tons) Forecast, by Application 2019 & 2032
- Table 67: Japan Phenol Market Revenue (Billion) Forecast, by Application 2019 & 2032
- Table 68: Japan Phenol Market Volume (K Tons) Forecast, by Application 2019 & 2032
- Table 69: South Korea Phenol Market Revenue (Billion) Forecast, by Application 2019 & 2032
- Table 70: South Korea Phenol Market Volume (K Tons) Forecast, by Application 2019 & 2032
- Table 71: Rest of Asia Pacific Phenol Market Revenue (Billion) Forecast, by Application 2019 & 2032
- Table 72: Rest of Asia Pacific Phenol Market Volume (K Tons) Forecast, by Application 2019 & 2032
- Table 73: Global Phenol Market Revenue Billion Forecast, by Product Type 2019 & 2032
- Table 74: Global Phenol Market Volume K Tons Forecast, by Product Type 2019 & 2032
- Table 75: Global Phenol Market Revenue Billion Forecast, by Country 2019 & 2032
- Table 76: Global Phenol Market Volume K Tons Forecast, by Country 2019 & 2032
- Table 77: United States Phenol Market Revenue (Billion) Forecast, by Application 2019 & 2032
- Table 78: United States Phenol Market Volume (K Tons) Forecast, by Application 2019 & 2032
- Table 79: Canada Phenol Market Revenue (Billion) Forecast, by Application 2019 & 2032
- Table 80: Canada Phenol Market Volume (K Tons) Forecast, by Application 2019 & 2032
- Table 81: Mexico Phenol Market Revenue (Billion) Forecast, by Application 2019 & 2032
- Table 82: Mexico Phenol Market Volume (K Tons) Forecast, by Application 2019 & 2032
- Table 83: Global Phenol Market Revenue Billion Forecast, by Product Type 2019 & 2032
- Table 84: Global Phenol Market Volume K Tons Forecast, by Product Type 2019 & 2032
- Table 85: Global Phenol Market Revenue Billion Forecast, by Country 2019 & 2032
- Table 86: Global Phenol Market Volume K Tons Forecast, by Country 2019 & 2032
- Table 87: Germany Phenol Market Revenue (Billion) Forecast, by Application 2019 & 2032
- Table 88: Germany Phenol Market Volume (K Tons) Forecast, by Application 2019 & 2032
- Table 89: United Kingdom Phenol Market Revenue (Billion) Forecast, by Application 2019 & 2032
- Table 90: United Kingdom Phenol Market Volume (K Tons) Forecast, by Application 2019 & 2032
- Table 91: France Phenol Market Revenue (Billion) Forecast, by Application 2019 & 2032
- Table 92: France Phenol Market Volume (K Tons) Forecast, by Application 2019 & 2032
- Table 93: Italy Phenol Market Revenue (Billion) Forecast, by Application 2019 & 2032
- Table 94: Italy Phenol Market Volume (K Tons) Forecast, by Application 2019 & 2032
- Table 95: Rest of Europe Phenol Market Revenue (Billion) Forecast, by Application 2019 & 2032
- Table 96: Rest of Europe Phenol Market Volume (K Tons) Forecast, by Application 2019 & 2032
- Table 97: Global Phenol Market Revenue Billion Forecast, by Product Type 2019 & 2032
- Table 98: Global Phenol Market Volume K Tons Forecast, by Product Type 2019 & 2032
- Table 99: Global Phenol Market Revenue Billion Forecast, by Country 2019 & 2032
- Table 100: Global Phenol Market Volume K Tons Forecast, by Country 2019 & 2032
- Table 101: Brazil Phenol Market Revenue (Billion) Forecast, by Application 2019 & 2032
- Table 102: Brazil Phenol Market Volume (K Tons) Forecast, by Application 2019 & 2032
- Table 103: Argentina Phenol Market Revenue (Billion) Forecast, by Application 2019 & 2032
- Table 104: Argentina Phenol Market Volume (K Tons) Forecast, by Application 2019 & 2032
- Table 105: Rest of South America Phenol Market Revenue (Billion) Forecast, by Application 2019 & 2032
- Table 106: Rest of South America Phenol Market Volume (K Tons) Forecast, by Application 2019 & 2032
- Table 107: Global Phenol Market Revenue Billion Forecast, by Product Type 2019 & 2032
- Table 108: Global Phenol Market Volume K Tons Forecast, by Product Type 2019 & 2032
- Table 109: Global Phenol Market Revenue Billion Forecast, by Country 2019 & 2032
- Table 110: Global Phenol Market Volume K Tons Forecast, by Country 2019 & 2032
- Table 111: Saudi Arabia Phenol Market Revenue (Billion) Forecast, by Application 2019 & 2032
- Table 112: Saudi Arabia Phenol Market Volume (K Tons) Forecast, by Application 2019 & 2032
- Table 113: South Africa Phenol Market Revenue (Billion) Forecast, by Application 2019 & 2032
- Table 114: South Africa Phenol Market Volume (K Tons) Forecast, by Application 2019 & 2032
- Table 115: Rest of Middle East and Africa Phenol Market Revenue (Billion) Forecast, by Application 2019 & 2032
- Table 116: Rest of Middle East and Africa Phenol Market Volume (K Tons) Forecast, by Application 2019 & 2032
Frequently Asked Questions
1. What is the projected Compound Annual Growth Rate (CAGR) of the Phenol Market?
The projected CAGR is approximately 4.9%.
2. Which companies are prominent players in the Phenol Market?
Key companies in the market include Shell PLC, Solvay, AdvanSix Inc, Mitsui Chemicals Inc, Mitsubishi Chemical Corporation, Cepsa, Altivia, Domo Chemical GmbH, PTT Phenol Company Limited, Formosa Chemicals & Fibre Corp, INEOS Capital Limited, Kumho P&B Chemicals Inc.
3. What are the main segments of the Phenol Market?
The market segments include Product Type.
4. Can you provide details about the market size?
The market size is estimated to be USD 24.3 Billion as of 2022.
5. What are some drivers contributing to market growth?
High Demand of Bisphenol-A; Other Drivers.
6. What are the notable trends driving market growth?
Bisphenol-A Product Type to Drive the Market.
7. Are there any restraints impacting market growth?
Ban on BPA in the United States and Europe; Others Restraints.
8. Can you provide examples of recent developments in the market?
August 2022: INEOS Phenol announced the acquisition of the asset base of Mitsui Phenols Singapore Ltd from Mitsui Chemicals for a total consideration of USD 330 million. The addition of the Jurong phenol and BPA assets will provide integration opportunities with manufacturing sites in Germany, Belgium, and the United States. The acquisition will increase the total production capacity by 1 million tonnes.
9. What pricing options are available for accessing the report?
Pricing options include single-user, multi-user, and enterprise licenses priced at USD 4750, USD 5250, and USD 8750 respectively.
10. Is the market size provided in terms of value or volume?
The market size is provided in terms of value, measured in Billion and volume, measured in K Tons.
11. Are there any specific market keywords associated with the report?
Yes, the market keyword associated with the report is "Phenol Market," which aids in identifying and referencing the specific market segment covered.
12. How do I determine which pricing option suits my needs best?
The pricing options vary based on user requirements and access needs. Individual users may opt for single-user licenses, while businesses requiring broader access may choose multi-user or enterprise licenses for cost-effective access to the report.
13. Are there any additional resources or data provided in the Phenol Market report?
While the report offers comprehensive insights, it's advisable to review the specific contents or supplementary materials provided to ascertain if additional resources or data are available.
14. How can I stay updated on further developments or reports in the Phenol Market?
To stay informed about further developments, trends, and reports in the Phenol Market, consider subscribing to industry newsletters, following relevant companies and organizations, or regularly checking reputable industry news sources and publications.
Methodology
Step 1 - Identification of Relevant Samples Size from Population Database


Step 2 - Approaches for Defining Global Market Size (Value, Volume* & Price*)

Note*: In applicable scenarios
Step 3 - Data Sources
Primary Research
- Web Analytics
- Survey Reports
- Research Institute
- Latest Research Reports
- Opinion Leaders
Secondary Research
- Annual Reports
- White Paper
- Latest Press Release
- Industry Association
- Paid Database
- Investor Presentations

Step 4 - Data Triangulation
Involves using different sources of information in order to increase the validity of a study
These sources are likely to be stakeholders in a program - participants, other researchers, program staff, other community members, and so on.
Then we put all data in single framework & apply various statistical tools to find out the dynamic on the market.
During the analysis stage, feedback from the stakeholder groups would be compared to determine areas of agreement as well as areas of divergence


