

Key Insights
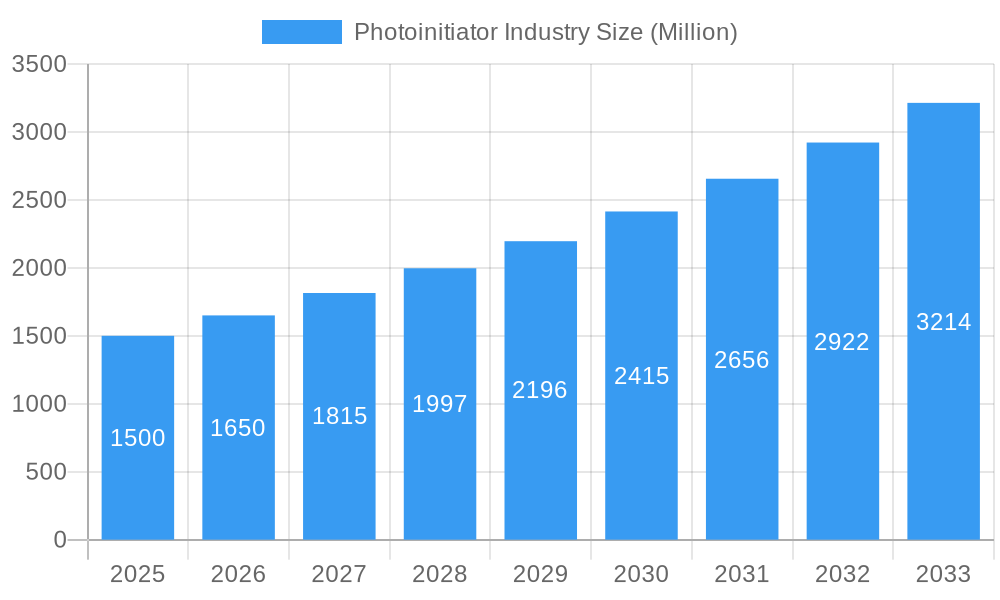
The photoinitiator market is experiencing robust growth, projected to maintain a Compound Annual Growth Rate (CAGR) exceeding 10% from 2025 to 2033. This expansion is driven by increasing demand across diverse applications, primarily in the adhesives, inks, and coatings sectors. The free radical type photoinitiator segment currently holds a significant market share due to its established applications and cost-effectiveness, while the cationic type is witnessing growth fueled by its unique properties suitable for specialized applications requiring high precision and performance. Geographical distribution shows a strong concentration in the Asia-Pacific region, particularly China and India, driven by rapid industrialization and expanding manufacturing sectors. North America and Europe also contribute significantly, reflecting established industries and high demand for advanced materials. However, environmental concerns surrounding certain photoinitiator types and stringent regulations are acting as restraints, pushing innovation towards more sustainable and environmentally friendly alternatives. The market is highly competitive, with key players including established chemical giants and specialized manufacturers vying for market share through product innovation, strategic partnerships, and geographical expansion. Further growth is anticipated with advancements in UV curing technology and the rising demand for high-performance materials in various industries, such as electronics and 3D printing.
Photoinitiator Industry Market Size (In Billion)
The forecast for the photoinitiator market shows continued expansion across all major segments and regions. The increasing adoption of UV-curable materials in packaging, printing, and other consumer goods applications will bolster market growth. Companies are actively investing in R&D to develop novel photoinitiators with improved performance characteristics, such as higher efficiency, lower toxicity, and wider spectral sensitivity. This push for innovation coupled with the growing awareness of sustainable materials is likely to reshape the competitive landscape, favoring manufacturers who successfully adapt to evolving industry standards and customer demands. The market will continue to be shaped by factors such as raw material price fluctuations, technological advancements, and evolving regulatory frameworks across different regions. The long-term outlook for the photoinitiator market remains positive, projecting substantial growth throughout the forecast period.
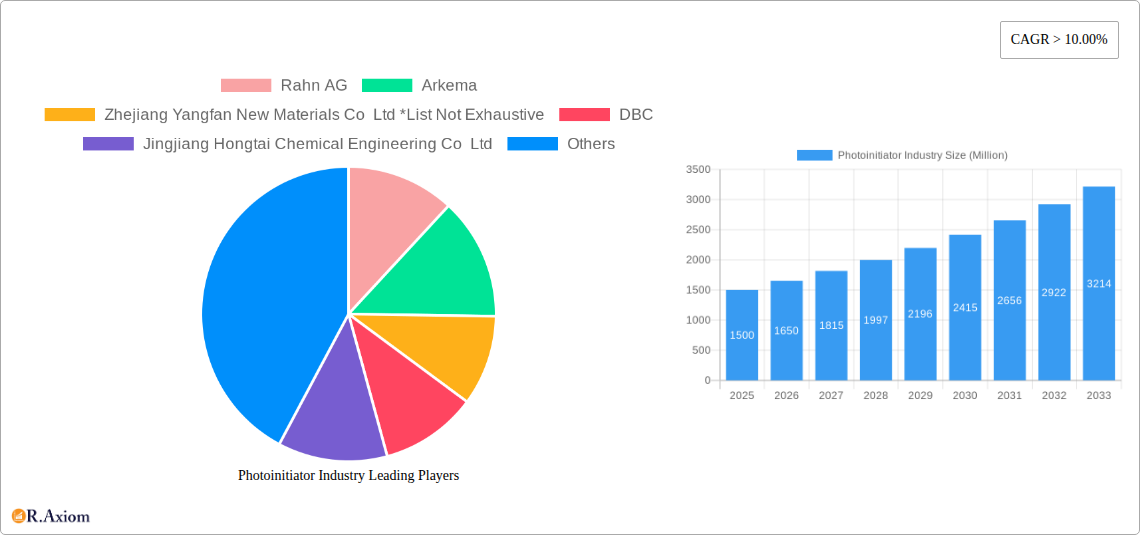
Photoinitiator Industry Company Market Share
Photoinitiator Industry Market Report: 2019-2033
This comprehensive report provides a detailed analysis of the global photoinitiator industry, encompassing market size, growth drivers, competitive landscape, and future trends. The study period covers 2019-2033, with 2025 as the base and estimated year. The forecast period spans 2025-2033, while the historical period analyzed is 2019-2024. This report is crucial for industry stakeholders, investors, and researchers seeking actionable insights into this dynamic market. The global market value is projected to reach xx Million by 2033.
Photoinitiator Industry Market Concentration & Innovation
The photoinitiator market exhibits a moderately concentrated landscape, with several major players holding significant market share. While precise market share figures for individual companies are proprietary, companies like Rahn AG, Arkema, and Zhejiang Yangfan New Materials Co Ltd are recognized as key players. The market is characterized by ongoing innovation driven by the demand for higher-performing, more sustainable, and specialized photoinitiators. Regulatory frameworks, particularly concerning environmental impact and safety, significantly influence product development and market access. The industry witnesses continuous development of substitutes, including alternative curing technologies, but the established benefits of photoinitiators continue to secure their dominance in many applications. End-user trends, such as the increasing adoption of UV-curable inks and coatings in packaging and 3D printing, propel industry growth. Mergers and acquisitions (M&A) are a significant factor in shaping the market. Recent examples include the July 2022 acquisition of Litian by IGM Resins, significantly expanding IGM's product portfolio and market reach. The M&A deal value for this transaction is reported at xx Million. Other significant M&A activities (both announced and completed) in recent years collectively account for an estimated xx Million in deal values.
- Market Concentration: Moderately concentrated, with a few major players dominating.
- Innovation Drivers: Demand for higher performance, sustainability, and specialized products.
- Regulatory Frameworks: Impacting product development and market access.
- Product Substitutes: Alternative curing technologies pose some competition.
- End-User Trends: Growth in UV-curable applications drives market expansion.
- M&A Activity: Significant impact on market structure and competition.
Photoinitiator Industry Industry Trends & Insights
The photoinitiator market is experiencing robust growth, driven by increasing demand across various end-use sectors. The Compound Annual Growth Rate (CAGR) from 2025 to 2033 is projected at xx%. Technological disruptions, such as the development of novel photoinitiator chemistries with enhanced performance and reduced environmental impact, are reshaping the market. Consumer preferences for eco-friendly and sustainable products are pushing manufacturers to develop greener solutions. Competitive dynamics are characterized by ongoing innovation, strategic partnerships, and mergers & acquisitions, driving continuous improvement in product offerings and market expansion. Market penetration is increasing in emerging economies due to rising industrialization and infrastructure development. The increasing demand for high-performance coatings and adhesives in various sectors, such as automotive, electronics, and construction, is a major growth catalyst. Furthermore, the growing adoption of 3D printing technologies which extensively use photoinitiators for rapid prototyping is boosting market expansion.
Dominant Markets & Segments in Photoinitiator Industry
The Asia-Pacific region is currently the dominant market for photoinitiators, driven by rapid economic growth, expanding industrial sectors, and increasing infrastructure development in countries like China and India. Within application segments, the coatings segment holds the largest market share, followed by inks and adhesives. Free radical photoinitiators currently dominate the type segment, although cationic photoinitiators are witnessing increasing adoption in niche applications.
- Leading Region: Asia-Pacific
- Key Drivers: Rapid economic growth, expanding industrialization, and infrastructure development.
- Dominant Application: Coatings
- Key Drivers: High demand in automotive, construction, and packaging industries.
- Dominant Type: Free Radical Photoinitiators
- Key Drivers: Cost-effectiveness and versatility.
Photoinitiator Industry Product Developments
Recent product innovations focus on developing environmentally friendly photoinitiators with low toxicity and high efficiency. There is a growing emphasis on developing photoinitiators tailored for specific applications, offering improved performance characteristics like faster curing times, improved adhesion, and enhanced durability. Companies are also focusing on developing photoinitiators with specific properties to meet the demands of emerging technologies, like 3D printing.
Report Scope & Segmentation Analysis
This report segments the photoinitiator market by type (Free Radical, Cationic) and application (Adhesives, Ink, Coating, Other Applications). Each segment is analyzed for market size, growth projections, and competitive dynamics. Free radical photoinitiators are currently the largest segment, driven by their versatility and cost-effectiveness, but the cationic segment is expected to exhibit strong growth due to its unique properties suitable for specific applications. The coatings application segment is projected to maintain its dominance, driven by high demand from various industries.
Key Drivers of Photoinitiator Industry Growth
Several factors drive the growth of the photoinitiator industry: increasing demand for high-performance coatings and adhesives, advancements in UV curing technologies, the rising adoption of 3D printing, and the expansion of end-use industries like automotive, electronics, and packaging. Government regulations promoting sustainable manufacturing practices also stimulate the demand for eco-friendly photoinitiators.
Challenges in the Photoinitiator Industry Sector
The photoinitiator industry faces challenges such as stringent environmental regulations, increasing raw material costs, and intense competition from alternative curing technologies. Supply chain disruptions and fluctuations in raw material prices can significantly impact production costs and profitability. The industry also needs to address concerns about the potential health and environmental impacts of certain photoinitiator types.
Emerging Opportunities in Photoinitiator Industry
Emerging opportunities include the development of bio-based photoinitiators, the expansion into new applications like biomedical devices and flexible electronics, and the growing demand for customized solutions tailored to specific customer needs. The industry also presents opportunities for companies to develop sustainable and environmentally friendly photoinitiators, addressing growing environmental concerns.
Leading Players in the Photoinitiator Industry Market
- Rahn AG
- Arkema
- Zhejiang Yangfan New Materials Co Ltd
- DBC
- Jingjiang Hongtai Chemical Engineering Co Ltd
- Eutec
- Changzhou Tronly New Electronic Materials Co Ltd
- TCI Chemicals
- ADEKA Corporation
- Lambson
- Jiuri Chemical
- Environ Speciality Chemicals Ltd
- New Sun Poly Tec Co Ltd
- Tianjin Jiuri New Materials Co Ltd
- Polynaisse
- IGM Resins
Key Developments in Photoinitiator Industry Industry
- July 2022: IGM Resins acquired Litian, a Chinese manufacturer of energy-curing resins, expanding its product portfolio and market presence.
- May 2022: Arkema showcased novel and sustainable solutions, including photoinitiators, at RadTech UV+EB 2022, highlighting its commitment to innovation and sustainability.
Strategic Outlook for Photoinitiator Industry Market
The photoinitiator market is poised for continued growth, driven by technological advancements, expanding end-use applications, and increasing demand for sustainable solutions. Companies that can successfully innovate, adapt to changing regulatory landscapes, and offer customized solutions are expected to thrive in this dynamic market. Focus on developing sustainable and high-performance photoinitiators will be crucial for future success.
Photoinitiator Industry Segmentation
-
1. Type
- 1.1. Free Radical
- 1.2. Cationic
-
2. Application
- 2.1. Adhesives
- 2.2. Ink
- 2.3. Coating
- 2.4. Other Applications
Photoinitiator Industry Segmentation By Geography
-
1. Asia Pacific
- 1.1. China
- 1.2. India
- 1.3. Japan
- 1.4. South Korea
- 1.5. Rest of Asia Pacific
-
2. North America
- 2.1. United States
- 2.2. Canada
- 2.3. Mexico
-
3. Europe
- 3.1. Germany
- 3.2. United Kingdom
- 3.3. France
- 3.4. Italy
- 3.5. Spain
- 3.6. Rest of Europe
-
4. South America
- 4.1. Brazil
- 4.2. Argentina
- 4.3. Rest of South America
-
5. Middle East and Africa
- 5.1. South Africa
- 5.2. Saudi Arabia
- 5.3. Rest of Middle East and Africa
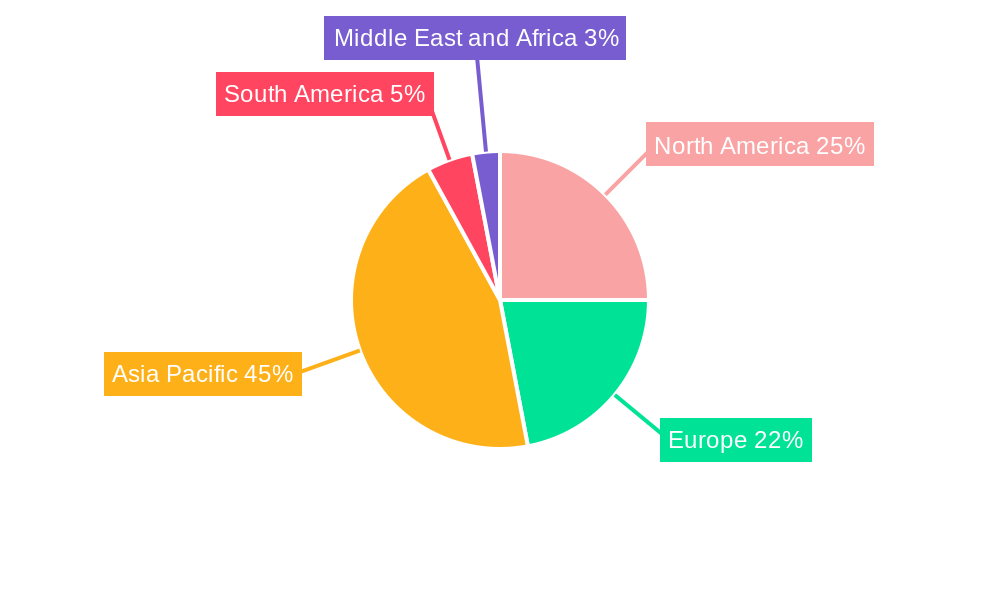
Photoinitiator Industry Regional Market Share
Geographic Coverage of Photoinitiator Industry
Photoinitiator Industry REPORT HIGHLIGHTS
| Aspects | Details |
|---|---|
| Study Period | 2020-2034 |
| Base Year | 2025 |
| Estimated Year | 2026 |
| Forecast Period | 2026-2034 |
| Historical Period | 2020-2025 |
| Growth Rate | CAGR of > 10.00% from 2020-2034 |
| Segmentation |
|
Table of Contents
- 1. Introduction
- 1.1. Research Scope
- 1.2. Market Segmentation
- 1.3. Research Objective
- 1.4. Definitions and Assumptions
- 2. Executive Summary
- 2.1. Market Snapshot
- 3. Market Dynamics
- 3.1. Market Drivers
- 3.2. Market Restrains
- 3.3. Market Trends
- 3.4. Market Opportunities
- 4. Market Factor Analysis
- 4.1. Porters Five Forces
- 4.1.1. Bargaining Power of Suppliers
- 4.1.2. Bargaining Power of Buyers
- 4.1.3. Threat of New Entrants
- 4.1.4. Threat of Substitutes
- 4.1.5. Competitive Rivalry
- 4.2. PESTEL analysis
- 4.3. BCG Analysis
- 4.3.1. Stars (High Growth, High Market Share)
- 4.3.2. Cash Cows (Low Growth, High Market Share)
- 4.3.3. Question Mark (High Growth, Low Market Share)
- 4.3.4. Dogs (Low Growth, Low Market Share)
- 4.4. Ansoff Matrix Analysis
- 4.5. Supply Chain Analysis
- 4.6. Regulatory Landscape
- 4.7. Current Market Potential and Opportunity Assessment (TAM–SAM–SOM Framework)
- 4.8. RAX Analyst Note
- 4.1. Porters Five Forces
- 5. Market Analysis, Insights and Forecast 2021-2033
- 5.1. Market Analysis, Insights and Forecast - by Type
- 5.1.1. Free Radical
- 5.1.2. Cationic
- 5.2. Market Analysis, Insights and Forecast - by Application
- 5.2.1. Adhesives
- 5.2.2. Ink
- 5.2.3. Coating
- 5.2.4. Other Applications
- 5.3. Market Analysis, Insights and Forecast - by Region
- 5.3.1. Asia Pacific
- 5.3.2. North America
- 5.3.3. Europe
- 5.3.4. South America
- 5.3.5. Middle East and Africa
- 5.1. Market Analysis, Insights and Forecast - by Type
- 6. Global Photoinitiator Industry Analysis, Insights and Forecast, 2021-2033
- 6.1. Market Analysis, Insights and Forecast - by Type
- 6.1.1. Free Radical
- 6.1.2. Cationic
- 6.2. Market Analysis, Insights and Forecast - by Application
- 6.2.1. Adhesives
- 6.2.2. Ink
- 6.2.3. Coating
- 6.2.4. Other Applications
- 6.1. Market Analysis, Insights and Forecast - by Type
- 7. Asia Pacific Photoinitiator Industry Analysis, Insights and Forecast, 2020-2032
- 7.1. Market Analysis, Insights and Forecast - by Type
- 7.1.1. Free Radical
- 7.1.2. Cationic
- 7.2. Market Analysis, Insights and Forecast - by Application
- 7.2.1. Adhesives
- 7.2.2. Ink
- 7.2.3. Coating
- 7.2.4. Other Applications
- 7.1. Market Analysis, Insights and Forecast - by Type
- 8. North America Photoinitiator Industry Analysis, Insights and Forecast, 2020-2032
- 8.1. Market Analysis, Insights and Forecast - by Type
- 8.1.1. Free Radical
- 8.1.2. Cationic
- 8.2. Market Analysis, Insights and Forecast - by Application
- 8.2.1. Adhesives
- 8.2.2. Ink
- 8.2.3. Coating
- 8.2.4. Other Applications
- 8.1. Market Analysis, Insights and Forecast - by Type
- 9. Europe Photoinitiator Industry Analysis, Insights and Forecast, 2020-2032
- 9.1. Market Analysis, Insights and Forecast - by Type
- 9.1.1. Free Radical
- 9.1.2. Cationic
- 9.2. Market Analysis, Insights and Forecast - by Application
- 9.2.1. Adhesives
- 9.2.2. Ink
- 9.2.3. Coating
- 9.2.4. Other Applications
- 9.1. Market Analysis, Insights and Forecast - by Type
- 10. South America Photoinitiator Industry Analysis, Insights and Forecast, 2020-2032
- 10.1. Market Analysis, Insights and Forecast - by Type
- 10.1.1. Free Radical
- 10.1.2. Cationic
- 10.2. Market Analysis, Insights and Forecast - by Application
- 10.2.1. Adhesives
- 10.2.2. Ink
- 10.2.3. Coating
- 10.2.4. Other Applications
- 10.1. Market Analysis, Insights and Forecast - by Type
- 11. Middle East and Africa Photoinitiator Industry Analysis, Insights and Forecast, 2020-2032
- 11.1. Market Analysis, Insights and Forecast - by Type
- 11.1.1. Free Radical
- 11.1.2. Cationic
- 11.2. Market Analysis, Insights and Forecast - by Application
- 11.2.1. Adhesives
- 11.2.2. Ink
- 11.2.3. Coating
- 11.2.4. Other Applications
- 11.1. Market Analysis, Insights and Forecast - by Type
- 12. Competitive Analysis
- 12.1. Company Profiles
- 12.1.1 Rahn AG
- 12.1.1.1. Company Overview
- 12.1.1.2. Products
- 12.1.1.3. Company Financials
- 12.1.1.4. SWOT Analysis
- 12.1.2 Arkema
- 12.1.2.1. Company Overview
- 12.1.2.2. Products
- 12.1.2.3. Company Financials
- 12.1.2.4. SWOT Analysis
- 12.1.3 Zhejiang Yangfan New Materials Co Ltd *List Not Exhaustive
- 12.1.3.1. Company Overview
- 12.1.3.2. Products
- 12.1.3.3. Company Financials
- 12.1.3.4. SWOT Analysis
- 12.1.4 DBC
- 12.1.4.1. Company Overview
- 12.1.4.2. Products
- 12.1.4.3. Company Financials
- 12.1.4.4. SWOT Analysis
- 12.1.5 Jingjiang Hongtai Chemical Engineering Co Ltd
- 12.1.5.1. Company Overview
- 12.1.5.2. Products
- 12.1.5.3. Company Financials
- 12.1.5.4. SWOT Analysis
- 12.1.6 Eutec
- 12.1.6.1. Company Overview
- 12.1.6.2. Products
- 12.1.6.3. Company Financials
- 12.1.6.4. SWOT Analysis
- 12.1.7 Changzhou Tronly New Electronic Materials Co Ltd
- 12.1.7.1. Company Overview
- 12.1.7.2. Products
- 12.1.7.3. Company Financials
- 12.1.7.4. SWOT Analysis
- 12.1.8 TCI Chemicals
- 12.1.8.1. Company Overview
- 12.1.8.2. Products
- 12.1.8.3. Company Financials
- 12.1.8.4. SWOT Analysis
- 12.1.9 ADEKA Corporation
- 12.1.9.1. Company Overview
- 12.1.9.2. Products
- 12.1.9.3. Company Financials
- 12.1.9.4. SWOT Analysis
- 12.1.10 Lambson
- 12.1.10.1. Company Overview
- 12.1.10.2. Products
- 12.1.10.3. Company Financials
- 12.1.10.4. SWOT Analysis
- 12.1.11 Jiuri Chemical
- 12.1.11.1. Company Overview
- 12.1.11.2. Products
- 12.1.11.3. Company Financials
- 12.1.11.4. SWOT Analysis
- 12.1.12 Environ Speciality Chemicals Ltd
- 12.1.12.1. Company Overview
- 12.1.12.2. Products
- 12.1.12.3. Company Financials
- 12.1.12.4. SWOT Analysis
- 12.1.13 New Sun Poly Tec Co Ltd
- 12.1.13.1. Company Overview
- 12.1.13.2. Products
- 12.1.13.3. Company Financials
- 12.1.13.4. SWOT Analysis
- 12.1.14 Tianjin Jiuri New Materials Co Ltd
- 12.1.14.1. Company Overview
- 12.1.14.2. Products
- 12.1.14.3. Company Financials
- 12.1.14.4. SWOT Analysis
- 12.1.15 Polynaisse
- 12.1.15.1. Company Overview
- 12.1.15.2. Products
- 12.1.15.3. Company Financials
- 12.1.15.4. SWOT Analysis
- 12.1.16 IGM Resins
- 12.1.16.1. Company Overview
- 12.1.16.2. Products
- 12.1.16.3. Company Financials
- 12.1.16.4. SWOT Analysis
- 12.1.1 Rahn AG
- 12.2. Market Entropy
- 12.2.1 Company's Key Areas Served
- 12.2.2 Recent Developments
- 12.3. Company Market Share Analysis 2025
- 12.3.1 Top 5 Companies Market Share Analysis
- 12.3.2 Top 3 Companies Market Share Analysis
- 12.4. List of Potential Customers
- 13. Research Methodology
List of Figures
- Figure 1: Global Photoinitiator Industry Revenue Breakdown (Million, %) by Region 2025 & 2033
- Figure 2: Asia Pacific Photoinitiator Industry Revenue (Million), by Type 2025 & 2033
- Figure 3: Asia Pacific Photoinitiator Industry Revenue Share (%), by Type 2025 & 2033
- Figure 4: Asia Pacific Photoinitiator Industry Revenue (Million), by Application 2025 & 2033
- Figure 5: Asia Pacific Photoinitiator Industry Revenue Share (%), by Application 2025 & 2033
- Figure 6: Asia Pacific Photoinitiator Industry Revenue (Million), by Country 2025 & 2033
- Figure 7: Asia Pacific Photoinitiator Industry Revenue Share (%), by Country 2025 & 2033
- Figure 8: North America Photoinitiator Industry Revenue (Million), by Type 2025 & 2033
- Figure 9: North America Photoinitiator Industry Revenue Share (%), by Type 2025 & 2033
- Figure 10: North America Photoinitiator Industry Revenue (Million), by Application 2025 & 2033
- Figure 11: North America Photoinitiator Industry Revenue Share (%), by Application 2025 & 2033
- Figure 12: North America Photoinitiator Industry Revenue (Million), by Country 2025 & 2033
- Figure 13: North America Photoinitiator Industry Revenue Share (%), by Country 2025 & 2033
- Figure 14: Europe Photoinitiator Industry Revenue (Million), by Type 2025 & 2033
- Figure 15: Europe Photoinitiator Industry Revenue Share (%), by Type 2025 & 2033
- Figure 16: Europe Photoinitiator Industry Revenue (Million), by Application 2025 & 2033
- Figure 17: Europe Photoinitiator Industry Revenue Share (%), by Application 2025 & 2033
- Figure 18: Europe Photoinitiator Industry Revenue (Million), by Country 2025 & 2033
- Figure 19: Europe Photoinitiator Industry Revenue Share (%), by Country 2025 & 2033
- Figure 20: South America Photoinitiator Industry Revenue (Million), by Type 2025 & 2033
- Figure 21: South America Photoinitiator Industry Revenue Share (%), by Type 2025 & 2033
- Figure 22: South America Photoinitiator Industry Revenue (Million), by Application 2025 & 2033
- Figure 23: South America Photoinitiator Industry Revenue Share (%), by Application 2025 & 2033
- Figure 24: South America Photoinitiator Industry Revenue (Million), by Country 2025 & 2033
- Figure 25: South America Photoinitiator Industry Revenue Share (%), by Country 2025 & 2033
- Figure 26: Middle East and Africa Photoinitiator Industry Revenue (Million), by Type 2025 & 2033
- Figure 27: Middle East and Africa Photoinitiator Industry Revenue Share (%), by Type 2025 & 2033
- Figure 28: Middle East and Africa Photoinitiator Industry Revenue (Million), by Application 2025 & 2033
- Figure 29: Middle East and Africa Photoinitiator Industry Revenue Share (%), by Application 2025 & 2033
- Figure 30: Middle East and Africa Photoinitiator Industry Revenue (Million), by Country 2025 & 2033
- Figure 31: Middle East and Africa Photoinitiator Industry Revenue Share (%), by Country 2025 & 2033
List of Tables
- Table 1: Global Photoinitiator Industry Revenue Million Forecast, by Type 2020 & 2033
- Table 2: Global Photoinitiator Industry Revenue Million Forecast, by Application 2020 & 2033
- Table 3: Global Photoinitiator Industry Revenue Million Forecast, by Region 2020 & 2033
- Table 4: Global Photoinitiator Industry Revenue Million Forecast, by Type 2020 & 2033
- Table 5: Global Photoinitiator Industry Revenue Million Forecast, by Application 2020 & 2033
- Table 6: Global Photoinitiator Industry Revenue Million Forecast, by Country 2020 & 2033
- Table 7: China Photoinitiator Industry Revenue (Million) Forecast, by Application 2020 & 2033
- Table 8: India Photoinitiator Industry Revenue (Million) Forecast, by Application 2020 & 2033
- Table 9: Japan Photoinitiator Industry Revenue (Million) Forecast, by Application 2020 & 2033
- Table 10: South Korea Photoinitiator Industry Revenue (Million) Forecast, by Application 2020 & 2033
- Table 11: Rest of Asia Pacific Photoinitiator Industry Revenue (Million) Forecast, by Application 2020 & 2033
- Table 12: Global Photoinitiator Industry Revenue Million Forecast, by Type 2020 & 2033
- Table 13: Global Photoinitiator Industry Revenue Million Forecast, by Application 2020 & 2033
- Table 14: Global Photoinitiator Industry Revenue Million Forecast, by Country 2020 & 2033
- Table 15: United States Photoinitiator Industry Revenue (Million) Forecast, by Application 2020 & 2033
- Table 16: Canada Photoinitiator Industry Revenue (Million) Forecast, by Application 2020 & 2033
- Table 17: Mexico Photoinitiator Industry Revenue (Million) Forecast, by Application 2020 & 2033
- Table 18: Global Photoinitiator Industry Revenue Million Forecast, by Type 2020 & 2033
- Table 19: Global Photoinitiator Industry Revenue Million Forecast, by Application 2020 & 2033
- Table 20: Global Photoinitiator Industry Revenue Million Forecast, by Country 2020 & 2033
- Table 21: Germany Photoinitiator Industry Revenue (Million) Forecast, by Application 2020 & 2033
- Table 22: United Kingdom Photoinitiator Industry Revenue (Million) Forecast, by Application 2020 & 2033
- Table 23: France Photoinitiator Industry Revenue (Million) Forecast, by Application 2020 & 2033
- Table 24: Italy Photoinitiator Industry Revenue (Million) Forecast, by Application 2020 & 2033
- Table 25: Spain Photoinitiator Industry Revenue (Million) Forecast, by Application 2020 & 2033
- Table 26: Rest of Europe Photoinitiator Industry Revenue (Million) Forecast, by Application 2020 & 2033
- Table 27: Global Photoinitiator Industry Revenue Million Forecast, by Type 2020 & 2033
- Table 28: Global Photoinitiator Industry Revenue Million Forecast, by Application 2020 & 2033
- Table 29: Global Photoinitiator Industry Revenue Million Forecast, by Country 2020 & 2033
- Table 30: Brazil Photoinitiator Industry Revenue (Million) Forecast, by Application 2020 & 2033
- Table 31: Argentina Photoinitiator Industry Revenue (Million) Forecast, by Application 2020 & 2033
- Table 32: Rest of South America Photoinitiator Industry Revenue (Million) Forecast, by Application 2020 & 2033
- Table 33: Global Photoinitiator Industry Revenue Million Forecast, by Type 2020 & 2033
- Table 34: Global Photoinitiator Industry Revenue Million Forecast, by Application 2020 & 2033
- Table 35: Global Photoinitiator Industry Revenue Million Forecast, by Country 2020 & 2033
- Table 36: South Africa Photoinitiator Industry Revenue (Million) Forecast, by Application 2020 & 2033
- Table 37: Saudi Arabia Photoinitiator Industry Revenue (Million) Forecast, by Application 2020 & 2033
- Table 38: Rest of Middle East and Africa Photoinitiator Industry Revenue (Million) Forecast, by Application 2020 & 2033
Frequently Asked Questions
1. What is the projected Compound Annual Growth Rate (CAGR) of the Photoinitiator Industry?
The projected CAGR is approximately > 10.00%.
2. Which companies are prominent players in the Photoinitiator Industry?
Key companies in the market include Rahn AG, Arkema, Zhejiang Yangfan New Materials Co Ltd *List Not Exhaustive, DBC, Jingjiang Hongtai Chemical Engineering Co Ltd, Eutec, Changzhou Tronly New Electronic Materials Co Ltd, TCI Chemicals, ADEKA Corporation, Lambson, Jiuri Chemical, Environ Speciality Chemicals Ltd, New Sun Poly Tec Co Ltd, Tianjin Jiuri New Materials Co Ltd, Polynaisse, IGM Resins.
3. What are the main segments of the Photoinitiator Industry?
The market segments include Type, Application.
4. Can you provide details about the market size?
The market size is estimated to be USD XX Million as of 2022.
5. What are some drivers contributing to market growth?
Promising Growth in End-use Industries such as Adhesive. Coating. Ink. and Paint; Eco-friendly Alternatives for Volatile Organic Compounds (VOCs).
6. What are the notable trends driving market growth?
Coatings Segment to Dominate the Market.
7. Are there any restraints impacting market growth?
Safety Concerns and Highest Costs; Other Restriants.
8. Can you provide examples of recent developments in the market?
July 2022: IGM Resins acquired Litian, a Chinese manufacturer of energy-curing resins. After the acquisition, IGM now includes three distinct product lines, a wide range of photoinitiators, a strong offering of energy-curing resins, and a good selection of additives.
9. What pricing options are available for accessing the report?
Pricing options include single-user, multi-user, and enterprise licenses priced at USD 4750, USD 5250, and USD 8750 respectively.
10. Is the market size provided in terms of value or volume?
The market size is provided in terms of value, measured in Million.
11. Are there any specific market keywords associated with the report?
Yes, the market keyword associated with the report is "Photoinitiator Industry," which aids in identifying and referencing the specific market segment covered.
12. How do I determine which pricing option suits my needs best?
The pricing options vary based on user requirements and access needs. Individual users may opt for single-user licenses, while businesses requiring broader access may choose multi-user or enterprise licenses for cost-effective access to the report.
13. Are there any additional resources or data provided in the Photoinitiator Industry report?
While the report offers comprehensive insights, it's advisable to review the specific contents or supplementary materials provided to ascertain if additional resources or data are available.
14. How can I stay updated on further developments or reports in the Photoinitiator Industry?
To stay informed about further developments, trends, and reports in the Photoinitiator Industry, consider subscribing to industry newsletters, following relevant companies and organizations, or regularly checking reputable industry news sources and publications.
Methodology
Step 1 - Identification of Relevant Samples Size from Population Database


Step 2 - Approaches for Defining Global Market Size (Value, Volume* & Price*)

Note*: In applicable scenarios
Step 3 - Data Sources
Primary Research
- Web Analytics
- Survey Reports
- Research Institute
- Latest Research Reports
- Opinion Leaders
Secondary Research
- Annual Reports
- White Paper
- Latest Press Release
- Industry Association
- Paid Database
- Investor Presentations

Step 4 - Data Triangulation
Involves using different sources of information in order to increase the validity of a study
These sources are likely to be stakeholders in a program - participants, other researchers, program staff, other community members, and so on.
Then we put all data in single framework & apply various statistical tools to find out the dynamic on the market.
During the analysis stage, feedback from the stakeholder groups would be compared to determine areas of agreement as well as areas of divergence