
Key Insights
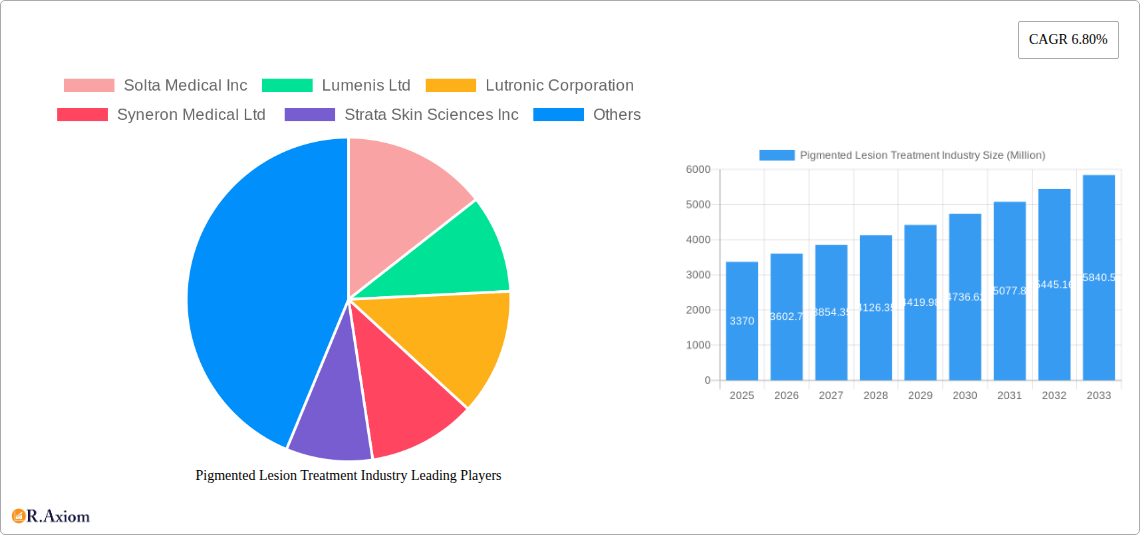
The global pigmented lesion treatment market, valued at $3.37 billion in 2025, is projected to experience robust growth, driven by a rising prevalence of skin cancers and cosmetic concerns related to age spots, sun spots, and birthmarks. Technological advancements in laser and energy-based devices, offering improved precision and reduced downtime, are significantly fueling market expansion. The increasing demand for minimally invasive procedures and a growing awareness of effective treatment options among consumers are further contributing factors. Dermatology and beauty clinics remain the primary end-users, reflecting the significant role of aesthetic dermatology in driving market growth. However, the market faces certain restraints, including the high cost of advanced treatments and potential side effects associated with certain procedures. This necessitates a strategic focus on affordability and patient education to enhance market penetration. The market is segmented into various product types—lasers and energy-based devices holding the largest market share due to their efficacy and versatility in treating a range of pigmented lesions—and end-users, with dermatology clinics leading the demand. Geographic expansion, particularly in emerging economies with growing disposable incomes and increasing awareness of cosmetic procedures, presents significant opportunities for market players. Competition among established companies like Solta Medical, Lumenis, Lutronic, and Syneron Medical, alongside emerging players, drives innovation and competitive pricing. Further growth will be influenced by advancements in treatment technologies, regulatory approvals, and the overall economic environment.
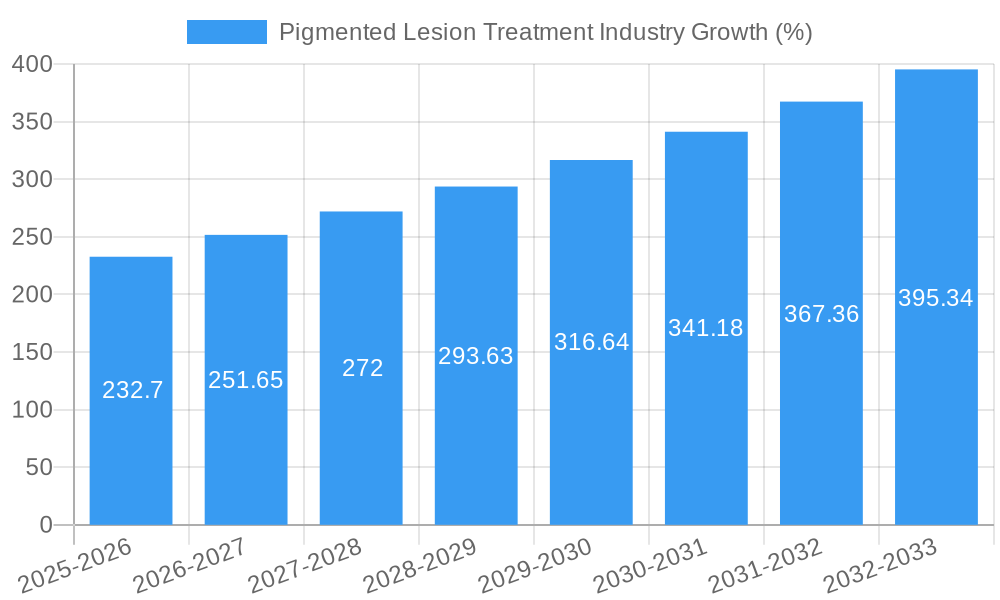
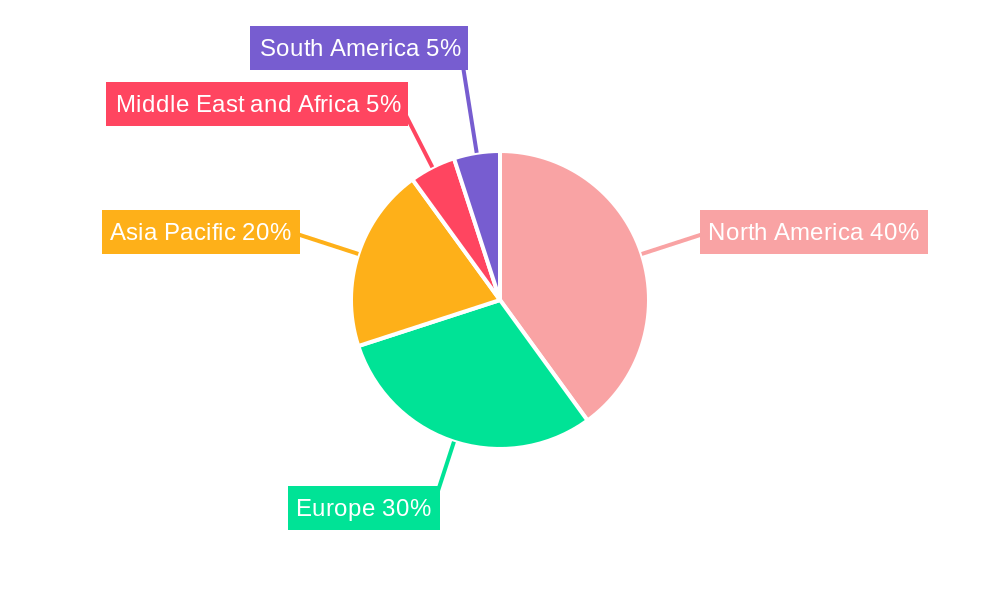
The forecast period (2025-2033) anticipates sustained growth, with the CAGR of 6.80% indicating a significant expansion of the market size. This growth will be propelled by the continued adoption of non-invasive and minimally invasive procedures, a growing preference for personalized treatment plans, and the ongoing development of innovative technologies offering improved efficacy and safety profiles. Regional variations are expected, with North America and Europe maintaining leading market shares due to high healthcare expenditure and established healthcare infrastructure. However, the Asia-Pacific region is poised for significant growth owing to the increasing prevalence of skin-related issues, rising disposable incomes, and expanding awareness regarding advanced treatment options. This requires companies to adopt localized strategies to cater to the unique needs of each region and to effectively penetrate these growing markets.
Pigmented Lesion Treatment Industry Market Report: 2019-2033
This comprehensive report provides a detailed analysis of the Pigmented Lesion Treatment Industry, covering market size, segmentation, growth drivers, challenges, and key players. The study period spans from 2019 to 2033, with 2025 serving as the base and estimated year. The forecast period extends from 2025 to 2033, and the historical period covers 2019-2024. The report’s insights are crucial for industry stakeholders, investors, and businesses seeking to understand and capitalize on the growth opportunities within this dynamic sector. The market is valued at xx Million in 2025 and is projected to reach xx Million by 2033.
Pigmented Lesion Treatment Industry Market Concentration & Innovation
The Pigmented Lesion Treatment industry exhibits a moderately concentrated market structure, with several key players holding significant market share. The market share of the top five companies, including Solta Medical Inc, Lumenis Ltd, Lutronic Corporation, Syneron Medical Ltd, and Strata Skin Sciences Inc, cumulatively accounts for approximately xx% of the global market in 2025. This concentration is driven by substantial investments in R&D, leading to a steady stream of innovative products.
Innovation in the sector is fueled by advancements in laser and energy-based devices, leading to more effective and less invasive treatments. Regulatory frameworks, particularly those related to medical device approvals (e.g., FDA clearances in the US and CE marking in Europe), play a significant role in shaping market dynamics and entry barriers. The emergence of non-invasive alternatives and technological advancements in skincare products pose competitive pressures on the industry. Recent mergers and acquisitions (M&A) activities, with a total deal value of approximately xx Million in the last five years, point towards strategic consolidation efforts within the sector. These M&A activities primarily involve technology licensing and acquisitions of smaller companies with specialized products or technologies.
- Key Players Market Share (2025):
- Solta Medical Inc: xx%
- Lumenis Ltd: xx%
- Lutronic Corporation: xx%
- Syneron Medical Ltd: xx%
- Strata Skin Sciences Inc: xx%
- M&A Activity (2020-2024): Total Deal Value: xx Million
Pigmented Lesion Treatment Industry Industry Trends & Insights
The Pigmented Lesion Treatment market is witnessing robust growth, primarily driven by rising awareness about skin health and aesthetic concerns. The increasing prevalence of pigmented lesions, coupled with a growing preference for minimally invasive procedures, fuels market expansion. Technological advancements, such as the development of more precise and effective laser and energy-based devices, contribute significantly to this growth. The market is expected to experience a Compound Annual Growth Rate (CAGR) of xx% during the forecast period (2025-2033). Market penetration of laser-based treatments is steadily increasing, with a significant uptake observed in developed economies and developing economies experiencing increased disposable incomes.
Consumer preferences are shifting towards non-invasive and personalized treatments, leading to a surge in demand for innovative devices and therapies. Competitive dynamics are characterized by continuous product innovation, strategic partnerships, and aggressive marketing strategies employed by leading players.
Dominant Markets & Segments in Pigmented Lesion Treatment Industry
The North American region currently holds the largest market share within the Pigmented Lesion Treatment industry, followed by Europe. This dominance is attributed to higher healthcare expenditure, advanced medical infrastructure, and a greater acceptance of aesthetic treatments. Within the product type segment, Lasers and Energy-Based Devices dominate the market, accounting for approximately xx% of the total revenue in 2025. This dominance stems from their effectiveness, versatility, and the continuous advancements in laser technology.
- Key Drivers for North American Dominance:
- High per capita healthcare expenditure
- Well-established medical infrastructure
- Early adoption of advanced medical technologies
- High prevalence of pigmented lesions
- Key Drivers for Laser and Energy-Based Devices Dominance:
- Efficacy and versatility of treatments
- Technological advancements leading to improved outcomes
- Relatively high profit margins
Within the end-user segment, Dermatology Clinics represent the largest consumer base, driven by the need for specialized expertise and medical supervision.
Pigmented Lesion Treatment Industry Product Developments
Recent product innovations have focused on enhancing precision, minimizing side effects, and expanding treatment options. The introduction of fractional laser technology and advanced pulse durations has significantly improved the safety and efficacy of pigmented lesion treatments. New devices offer customized treatment parameters, enabling practitioners to tailor treatments to individual patient needs and skin types. The market is witnessing the rise of hybrid devices combining multiple technologies (e.g., lasers and RF) to provide comprehensive treatment solutions. These advancements enhance the competitive advantage of manufacturers by offering superior clinical outcomes and patient satisfaction.
Report Scope & Segmentation Analysis
This report segments the Pigmented Lesion Treatment market by Product Type (Lasers and Energy Based Devices, RF Devices, Ultrasound Devices, Other Product Types) and End-User (Dermatology Clinics, Beauty Clinics, Other End-Users).
Product Type:
- Lasers and Energy Based Devices: This segment dominates the market, driven by technological advancements, effectiveness and versatility.
- RF Devices: This segment is growing steadily due to its non-invasive nature and rising popularity.
- Ultrasound Devices: The adoption of ultrasound devices is relatively low but is anticipated to grow.
- Other Product Types: This segment includes topical creams and other treatments.
End-User:
- Dermatology Clinics: This segment accounts for the largest market share.
- Beauty Clinics: This segment is experiencing significant growth.
- Other End-Users: This segment includes hospitals and specialized medical centers.
Each segment is analyzed in detail, presenting market size projections, growth rates, and competitive landscapes.
Key Drivers of Pigmented Lesion Treatment Industry Growth
Several key factors drive the growth of the Pigmented Lesion Treatment industry:
- Rising Prevalence of Pigmented Lesions: The increasing incidence of skin cancer and benign pigmented lesions significantly boosts the demand for effective treatments.
- Technological Advancements: Continuous innovations in laser and energy-based devices improve treatment efficacy, safety, and patient experience.
- Growing Aesthetic Awareness: The rising desire for flawless skin and improved appearance fuels the adoption of aesthetic treatments.
- Increased Disposable Incomes: Rising disposable incomes in developing economies expand the market reach and adoption of treatments.
Challenges in the Pigmented Lesion Treatment Industry Sector
The Pigmented Lesion Treatment industry faces several challenges:
- High Treatment Costs: The cost of advanced equipment and procedures can limit access for certain patient populations.
- Regulatory Hurdles: Obtaining regulatory approvals for new devices and treatments can be time-consuming and expensive.
- Intense Competition: The presence of many competitors leads to price pressures and necessitates continuous innovation.
- Potential Side Effects: The risk of side effects, although low with modern technologies, can deter some patients from seeking treatment.
Emerging Opportunities in Pigmented Lesion Treatment Industry
Emerging opportunities exist in:
- Personalized Treatments: The growing demand for customized treatment plans based on individual patient needs and skin characteristics creates new opportunities.
- Home-Based Devices: The development of safe and effective home-based devices caters to the rising demand for convenient treatment options.
- Expansion into Emerging Markets: Untapped potential exists in emerging markets where awareness and access to aesthetic treatments are growing.
- New Treatment Modalities: Research into alternative technologies and treatment approaches can lead to the development of innovative solutions.
Leading Players in the Pigmented Lesion Treatment Industry Market
- Solta Medical Inc
- Lumenis Ltd
- Lutronic Corporation
- Syneron Medical Ltd
- Strata Skin Sciences Inc
- Cutera Inc
- Lynton Lasers Ltd
- Alma Lasers Ltd
- Cynosure Inc
Key Developments in Pigmented Lesion Treatment Industry Industry
- March 2022: Lumenis launched the Splendor X device in the UK market, expanding its reach in pigmented lesion treatments. This launch demonstrates the ongoing innovation and expansion in this sector.
- December 2022: Heure, a Singapore-based skincare brand, planned to launch a new product range targeting skin pigmentation. This highlights the growing interest and investment from the broader skincare industry in addressing pigmentation issues.
Strategic Outlook for Pigmented Lesion Treatment Industry Market
The Pigmented Lesion Treatment industry exhibits strong growth potential, driven by technological advancements, increasing awareness of skin health, and rising demand for aesthetic treatments. Future opportunities lie in the development of more personalized and accessible solutions, along with expansion into new markets and therapeutic areas. The ongoing evolution of laser and energy-based technologies will continue to drive innovation and market expansion, creating significant growth prospects for established players and new entrants alike. Focus on improving safety profiles, reducing treatment times, and enhancing patient outcomes will be crucial for market success.
Pigmented Lesion Treatment Industry Segmentation
-
1. Product Type
- 1.1. Lasers and Energy Based Devices
- 1.2. RF Devices
- 1.3. Ultrasound Devices
- 1.4. Other Product Types
-
2. End User
- 2.1. Dermatology Clinics
- 2.2. Beauty Clinics
- 2.3. Other End Users
Pigmented Lesion Treatment Industry Segmentation By Geography
-
1. North America
- 1.1. United States
- 1.2. Canada
- 1.3. Mexico
-
2. Europe
- 2.1. Germany
- 2.2. United Kingdom
- 2.3. France
- 2.4. Italy
- 2.5. Spain
- 2.6. Rest of Europe
-
3. Asia Pacific
- 3.1. China
- 3.2. Japan
- 3.3. India
- 3.4. Australia
- 3.5. South Korea
- 3.6. Rest of Asia Pacific
-
4. Middle East and Africa
- 4.1. GCC
- 4.2. South Africa
- 4.3. Rest of Middle East and Africa
-
5. South America
- 5.1. Brazil
- 5.2. Argentina
- 5.3. Rest of South America
Pigmented Lesion Treatment Industry REPORT HIGHLIGHTS
| Aspects | Details |
|---|---|
| Study Period | 2019-2033 |
| Base Year | 2024 |
| Estimated Year | 2025 |
| Forecast Period | 2025-2033 |
| Historical Period | 2019-2024 |
| Growth Rate | CAGR of 6.80% from 2019-2033 |
| Segmentation |
|
Table of Contents
- 1. Introduction
- 1.1. Research Scope
- 1.2. Market Segmentation
- 1.3. Research Methodology
- 1.4. Definitions and Assumptions
- 2. Executive Summary
- 2.1. Introduction
- 3. Market Dynamics
- 3.1. Introduction
- 3.2. Market Drivers
- 3.2.1. Rising Geriatric Population; Increasing Prevalence of Pigmentation Disorders
- 3.3. Market Restrains
- 3.3.1. Side Effects Associated with Certain Treatments
- 3.4. Market Trends
- 3.4.1. Lasers and Energy Based Devices are Expected to Witness a Significant Growth
- 4. Market Factor Analysis
- 4.1. Porters Five Forces
- 4.2. Supply/Value Chain
- 4.3. PESTEL analysis
- 4.4. Market Entropy
- 4.5. Patent/Trademark Analysis
- 5. Global Pigmented Lesion Treatment Industry Analysis, Insights and Forecast, 2019-2031
- 5.1. Market Analysis, Insights and Forecast - by Product Type
- 5.1.1. Lasers and Energy Based Devices
- 5.1.2. RF Devices
- 5.1.3. Ultrasound Devices
- 5.1.4. Other Product Types
- 5.2. Market Analysis, Insights and Forecast - by End User
- 5.2.1. Dermatology Clinics
- 5.2.2. Beauty Clinics
- 5.2.3. Other End Users
- 5.3. Market Analysis, Insights and Forecast - by Region
- 5.3.1. North America
- 5.3.2. Europe
- 5.3.3. Asia Pacific
- 5.3.4. Middle East and Africa
- 5.3.5. South America
- 5.1. Market Analysis, Insights and Forecast - by Product Type
- 6. North America Pigmented Lesion Treatment Industry Analysis, Insights and Forecast, 2019-2031
- 6.1. Market Analysis, Insights and Forecast - by Product Type
- 6.1.1. Lasers and Energy Based Devices
- 6.1.2. RF Devices
- 6.1.3. Ultrasound Devices
- 6.1.4. Other Product Types
- 6.2. Market Analysis, Insights and Forecast - by End User
- 6.2.1. Dermatology Clinics
- 6.2.2. Beauty Clinics
- 6.2.3. Other End Users
- 6.1. Market Analysis, Insights and Forecast - by Product Type
- 7. Europe Pigmented Lesion Treatment Industry Analysis, Insights and Forecast, 2019-2031
- 7.1. Market Analysis, Insights and Forecast - by Product Type
- 7.1.1. Lasers and Energy Based Devices
- 7.1.2. RF Devices
- 7.1.3. Ultrasound Devices
- 7.1.4. Other Product Types
- 7.2. Market Analysis, Insights and Forecast - by End User
- 7.2.1. Dermatology Clinics
- 7.2.2. Beauty Clinics
- 7.2.3. Other End Users
- 7.1. Market Analysis, Insights and Forecast - by Product Type
- 8. Asia Pacific Pigmented Lesion Treatment Industry Analysis, Insights and Forecast, 2019-2031
- 8.1. Market Analysis, Insights and Forecast - by Product Type
- 8.1.1. Lasers and Energy Based Devices
- 8.1.2. RF Devices
- 8.1.3. Ultrasound Devices
- 8.1.4. Other Product Types
- 8.2. Market Analysis, Insights and Forecast - by End User
- 8.2.1. Dermatology Clinics
- 8.2.2. Beauty Clinics
- 8.2.3. Other End Users
- 8.1. Market Analysis, Insights and Forecast - by Product Type
- 9. Middle East and Africa Pigmented Lesion Treatment Industry Analysis, Insights and Forecast, 2019-2031
- 9.1. Market Analysis, Insights and Forecast - by Product Type
- 9.1.1. Lasers and Energy Based Devices
- 9.1.2. RF Devices
- 9.1.3. Ultrasound Devices
- 9.1.4. Other Product Types
- 9.2. Market Analysis, Insights and Forecast - by End User
- 9.2.1. Dermatology Clinics
- 9.2.2. Beauty Clinics
- 9.2.3. Other End Users
- 9.1. Market Analysis, Insights and Forecast - by Product Type
- 10. South America Pigmented Lesion Treatment Industry Analysis, Insights and Forecast, 2019-2031
- 10.1. Market Analysis, Insights and Forecast - by Product Type
- 10.1.1. Lasers and Energy Based Devices
- 10.1.2. RF Devices
- 10.1.3. Ultrasound Devices
- 10.1.4. Other Product Types
- 10.2. Market Analysis, Insights and Forecast - by End User
- 10.2.1. Dermatology Clinics
- 10.2.2. Beauty Clinics
- 10.2.3. Other End Users
- 10.1. Market Analysis, Insights and Forecast - by Product Type
- 11. North America Pigmented Lesion Treatment Industry Analysis, Insights and Forecast, 2019-2031
- 11.1. Market Analysis, Insights and Forecast - By Country/Sub-region
- 11.1.1 United States
- 11.1.2 Canada
- 11.1.3 Mexico
- 12. Europe Pigmented Lesion Treatment Industry Analysis, Insights and Forecast, 2019-2031
- 12.1. Market Analysis, Insights and Forecast - By Country/Sub-region
- 12.1.1 Germany
- 12.1.2 United Kingdom
- 12.1.3 France
- 12.1.4 Italy
- 12.1.5 Spain
- 12.1.6 Rest of Europe
- 13. Asia Pacific Pigmented Lesion Treatment Industry Analysis, Insights and Forecast, 2019-2031
- 13.1. Market Analysis, Insights and Forecast - By Country/Sub-region
- 13.1.1 China
- 13.1.2 Japan
- 13.1.3 India
- 13.1.4 Australia
- 13.1.5 South Korea
- 13.1.6 Rest of Asia Pacific
- 14. Middle East and Africa Pigmented Lesion Treatment Industry Analysis, Insights and Forecast, 2019-2031
- 14.1. Market Analysis, Insights and Forecast - By Country/Sub-region
- 14.1.1 GCC
- 14.1.2 South Africa
- 14.1.3 Rest of Middle East and Africa
- 15. South America Pigmented Lesion Treatment Industry Analysis, Insights and Forecast, 2019-2031
- 15.1. Market Analysis, Insights and Forecast - By Country/Sub-region
- 15.1.1 Brazil
- 15.1.2 Argentina
- 15.1.3 Rest of South America
- 16. Competitive Analysis
- 16.1. Global Market Share Analysis 2024
- 16.2. Company Profiles
- 16.2.1 Solta Medical Inc
- 16.2.1.1. Overview
- 16.2.1.2. Products
- 16.2.1.3. SWOT Analysis
- 16.2.1.4. Recent Developments
- 16.2.1.5. Financials (Based on Availability)
- 16.2.2 Lumenis Ltd
- 16.2.2.1. Overview
- 16.2.2.2. Products
- 16.2.2.3. SWOT Analysis
- 16.2.2.4. Recent Developments
- 16.2.2.5. Financials (Based on Availability)
- 16.2.3 Lutronic Corporation
- 16.2.3.1. Overview
- 16.2.3.2. Products
- 16.2.3.3. SWOT Analysis
- 16.2.3.4. Recent Developments
- 16.2.3.5. Financials (Based on Availability)
- 16.2.4 Syneron Medical Ltd
- 16.2.4.1. Overview
- 16.2.4.2. Products
- 16.2.4.3. SWOT Analysis
- 16.2.4.4. Recent Developments
- 16.2.4.5. Financials (Based on Availability)
- 16.2.5 Strata Skin Sciences Inc
- 16.2.5.1. Overview
- 16.2.5.2. Products
- 16.2.5.3. SWOT Analysis
- 16.2.5.4. Recent Developments
- 16.2.5.5. Financials (Based on Availability)
- 16.2.6 Cutera Inc
- 16.2.6.1. Overview
- 16.2.6.2. Products
- 16.2.6.3. SWOT Analysis
- 16.2.6.4. Recent Developments
- 16.2.6.5. Financials (Based on Availability)
- 16.2.7 Lynton Lasers Ltd
- 16.2.7.1. Overview
- 16.2.7.2. Products
- 16.2.7.3. SWOT Analysis
- 16.2.7.4. Recent Developments
- 16.2.7.5. Financials (Based on Availability)
- 16.2.8 Alma Lasers Ltd
- 16.2.8.1. Overview
- 16.2.8.2. Products
- 16.2.8.3. SWOT Analysis
- 16.2.8.4. Recent Developments
- 16.2.8.5. Financials (Based on Availability)
- 16.2.9 Cynosure Inc
- 16.2.9.1. Overview
- 16.2.9.2. Products
- 16.2.9.3. SWOT Analysis
- 16.2.9.4. Recent Developments
- 16.2.9.5. Financials (Based on Availability)
- 16.2.1 Solta Medical Inc
List of Figures
- Figure 1: Global Pigmented Lesion Treatment Industry Revenue Breakdown (Million, %) by Region 2024 & 2032
- Figure 2: Global Pigmented Lesion Treatment Industry Volume Breakdown (K Unit, %) by Region 2024 & 2032
- Figure 3: North America Pigmented Lesion Treatment Industry Revenue (Million), by Country 2024 & 2032
- Figure 4: North America Pigmented Lesion Treatment Industry Volume (K Unit), by Country 2024 & 2032
- Figure 5: North America Pigmented Lesion Treatment Industry Revenue Share (%), by Country 2024 & 2032
- Figure 6: North America Pigmented Lesion Treatment Industry Volume Share (%), by Country 2024 & 2032
- Figure 7: Europe Pigmented Lesion Treatment Industry Revenue (Million), by Country 2024 & 2032
- Figure 8: Europe Pigmented Lesion Treatment Industry Volume (K Unit), by Country 2024 & 2032
- Figure 9: Europe Pigmented Lesion Treatment Industry Revenue Share (%), by Country 2024 & 2032
- Figure 10: Europe Pigmented Lesion Treatment Industry Volume Share (%), by Country 2024 & 2032
- Figure 11: Asia Pacific Pigmented Lesion Treatment Industry Revenue (Million), by Country 2024 & 2032
- Figure 12: Asia Pacific Pigmented Lesion Treatment Industry Volume (K Unit), by Country 2024 & 2032
- Figure 13: Asia Pacific Pigmented Lesion Treatment Industry Revenue Share (%), by Country 2024 & 2032
- Figure 14: Asia Pacific Pigmented Lesion Treatment Industry Volume Share (%), by Country 2024 & 2032
- Figure 15: Middle East and Africa Pigmented Lesion Treatment Industry Revenue (Million), by Country 2024 & 2032
- Figure 16: Middle East and Africa Pigmented Lesion Treatment Industry Volume (K Unit), by Country 2024 & 2032
- Figure 17: Middle East and Africa Pigmented Lesion Treatment Industry Revenue Share (%), by Country 2024 & 2032
- Figure 18: Middle East and Africa Pigmented Lesion Treatment Industry Volume Share (%), by Country 2024 & 2032
- Figure 19: South America Pigmented Lesion Treatment Industry Revenue (Million), by Country 2024 & 2032
- Figure 20: South America Pigmented Lesion Treatment Industry Volume (K Unit), by Country 2024 & 2032
- Figure 21: South America Pigmented Lesion Treatment Industry Revenue Share (%), by Country 2024 & 2032
- Figure 22: South America Pigmented Lesion Treatment Industry Volume Share (%), by Country 2024 & 2032
- Figure 23: North America Pigmented Lesion Treatment Industry Revenue (Million), by Product Type 2024 & 2032
- Figure 24: North America Pigmented Lesion Treatment Industry Volume (K Unit), by Product Type 2024 & 2032
- Figure 25: North America Pigmented Lesion Treatment Industry Revenue Share (%), by Product Type 2024 & 2032
- Figure 26: North America Pigmented Lesion Treatment Industry Volume Share (%), by Product Type 2024 & 2032
- Figure 27: North America Pigmented Lesion Treatment Industry Revenue (Million), by End User 2024 & 2032
- Figure 28: North America Pigmented Lesion Treatment Industry Volume (K Unit), by End User 2024 & 2032
- Figure 29: North America Pigmented Lesion Treatment Industry Revenue Share (%), by End User 2024 & 2032
- Figure 30: North America Pigmented Lesion Treatment Industry Volume Share (%), by End User 2024 & 2032
- Figure 31: North America Pigmented Lesion Treatment Industry Revenue (Million), by Country 2024 & 2032
- Figure 32: North America Pigmented Lesion Treatment Industry Volume (K Unit), by Country 2024 & 2032
- Figure 33: North America Pigmented Lesion Treatment Industry Revenue Share (%), by Country 2024 & 2032
- Figure 34: North America Pigmented Lesion Treatment Industry Volume Share (%), by Country 2024 & 2032
- Figure 35: Europe Pigmented Lesion Treatment Industry Revenue (Million), by Product Type 2024 & 2032
- Figure 36: Europe Pigmented Lesion Treatment Industry Volume (K Unit), by Product Type 2024 & 2032
- Figure 37: Europe Pigmented Lesion Treatment Industry Revenue Share (%), by Product Type 2024 & 2032
- Figure 38: Europe Pigmented Lesion Treatment Industry Volume Share (%), by Product Type 2024 & 2032
- Figure 39: Europe Pigmented Lesion Treatment Industry Revenue (Million), by End User 2024 & 2032
- Figure 40: Europe Pigmented Lesion Treatment Industry Volume (K Unit), by End User 2024 & 2032
- Figure 41: Europe Pigmented Lesion Treatment Industry Revenue Share (%), by End User 2024 & 2032
- Figure 42: Europe Pigmented Lesion Treatment Industry Volume Share (%), by End User 2024 & 2032
- Figure 43: Europe Pigmented Lesion Treatment Industry Revenue (Million), by Country 2024 & 2032
- Figure 44: Europe Pigmented Lesion Treatment Industry Volume (K Unit), by Country 2024 & 2032
- Figure 45: Europe Pigmented Lesion Treatment Industry Revenue Share (%), by Country 2024 & 2032
- Figure 46: Europe Pigmented Lesion Treatment Industry Volume Share (%), by Country 2024 & 2032
- Figure 47: Asia Pacific Pigmented Lesion Treatment Industry Revenue (Million), by Product Type 2024 & 2032
- Figure 48: Asia Pacific Pigmented Lesion Treatment Industry Volume (K Unit), by Product Type 2024 & 2032
- Figure 49: Asia Pacific Pigmented Lesion Treatment Industry Revenue Share (%), by Product Type 2024 & 2032
- Figure 50: Asia Pacific Pigmented Lesion Treatment Industry Volume Share (%), by Product Type 2024 & 2032
- Figure 51: Asia Pacific Pigmented Lesion Treatment Industry Revenue (Million), by End User 2024 & 2032
- Figure 52: Asia Pacific Pigmented Lesion Treatment Industry Volume (K Unit), by End User 2024 & 2032
- Figure 53: Asia Pacific Pigmented Lesion Treatment Industry Revenue Share (%), by End User 2024 & 2032
- Figure 54: Asia Pacific Pigmented Lesion Treatment Industry Volume Share (%), by End User 2024 & 2032
- Figure 55: Asia Pacific Pigmented Lesion Treatment Industry Revenue (Million), by Country 2024 & 2032
- Figure 56: Asia Pacific Pigmented Lesion Treatment Industry Volume (K Unit), by Country 2024 & 2032
- Figure 57: Asia Pacific Pigmented Lesion Treatment Industry Revenue Share (%), by Country 2024 & 2032
- Figure 58: Asia Pacific Pigmented Lesion Treatment Industry Volume Share (%), by Country 2024 & 2032
- Figure 59: Middle East and Africa Pigmented Lesion Treatment Industry Revenue (Million), by Product Type 2024 & 2032
- Figure 60: Middle East and Africa Pigmented Lesion Treatment Industry Volume (K Unit), by Product Type 2024 & 2032
- Figure 61: Middle East and Africa Pigmented Lesion Treatment Industry Revenue Share (%), by Product Type 2024 & 2032
- Figure 62: Middle East and Africa Pigmented Lesion Treatment Industry Volume Share (%), by Product Type 2024 & 2032
- Figure 63: Middle East and Africa Pigmented Lesion Treatment Industry Revenue (Million), by End User 2024 & 2032
- Figure 64: Middle East and Africa Pigmented Lesion Treatment Industry Volume (K Unit), by End User 2024 & 2032
- Figure 65: Middle East and Africa Pigmented Lesion Treatment Industry Revenue Share (%), by End User 2024 & 2032
- Figure 66: Middle East and Africa Pigmented Lesion Treatment Industry Volume Share (%), by End User 2024 & 2032
- Figure 67: Middle East and Africa Pigmented Lesion Treatment Industry Revenue (Million), by Country 2024 & 2032
- Figure 68: Middle East and Africa Pigmented Lesion Treatment Industry Volume (K Unit), by Country 2024 & 2032
- Figure 69: Middle East and Africa Pigmented Lesion Treatment Industry Revenue Share (%), by Country 2024 & 2032
- Figure 70: Middle East and Africa Pigmented Lesion Treatment Industry Volume Share (%), by Country 2024 & 2032
- Figure 71: South America Pigmented Lesion Treatment Industry Revenue (Million), by Product Type 2024 & 2032
- Figure 72: South America Pigmented Lesion Treatment Industry Volume (K Unit), by Product Type 2024 & 2032
- Figure 73: South America Pigmented Lesion Treatment Industry Revenue Share (%), by Product Type 2024 & 2032
- Figure 74: South America Pigmented Lesion Treatment Industry Volume Share (%), by Product Type 2024 & 2032
- Figure 75: South America Pigmented Lesion Treatment Industry Revenue (Million), by End User 2024 & 2032
- Figure 76: South America Pigmented Lesion Treatment Industry Volume (K Unit), by End User 2024 & 2032
- Figure 77: South America Pigmented Lesion Treatment Industry Revenue Share (%), by End User 2024 & 2032
- Figure 78: South America Pigmented Lesion Treatment Industry Volume Share (%), by End User 2024 & 2032
- Figure 79: South America Pigmented Lesion Treatment Industry Revenue (Million), by Country 2024 & 2032
- Figure 80: South America Pigmented Lesion Treatment Industry Volume (K Unit), by Country 2024 & 2032
- Figure 81: South America Pigmented Lesion Treatment Industry Revenue Share (%), by Country 2024 & 2032
- Figure 82: South America Pigmented Lesion Treatment Industry Volume Share (%), by Country 2024 & 2032
List of Tables
- Table 1: Global Pigmented Lesion Treatment Industry Revenue Million Forecast, by Region 2019 & 2032
- Table 2: Global Pigmented Lesion Treatment Industry Volume K Unit Forecast, by Region 2019 & 2032
- Table 3: Global Pigmented Lesion Treatment Industry Revenue Million Forecast, by Product Type 2019 & 2032
- Table 4: Global Pigmented Lesion Treatment Industry Volume K Unit Forecast, by Product Type 2019 & 2032
- Table 5: Global Pigmented Lesion Treatment Industry Revenue Million Forecast, by End User 2019 & 2032
- Table 6: Global Pigmented Lesion Treatment Industry Volume K Unit Forecast, by End User 2019 & 2032
- Table 7: Global Pigmented Lesion Treatment Industry Revenue Million Forecast, by Region 2019 & 2032
- Table 8: Global Pigmented Lesion Treatment Industry Volume K Unit Forecast, by Region 2019 & 2032
- Table 9: Global Pigmented Lesion Treatment Industry Revenue Million Forecast, by Country 2019 & 2032
- Table 10: Global Pigmented Lesion Treatment Industry Volume K Unit Forecast, by Country 2019 & 2032
- Table 11: United States Pigmented Lesion Treatment Industry Revenue (Million) Forecast, by Application 2019 & 2032
- Table 12: United States Pigmented Lesion Treatment Industry Volume (K Unit) Forecast, by Application 2019 & 2032
- Table 13: Canada Pigmented Lesion Treatment Industry Revenue (Million) Forecast, by Application 2019 & 2032
- Table 14: Canada Pigmented Lesion Treatment Industry Volume (K Unit) Forecast, by Application 2019 & 2032
- Table 15: Mexico Pigmented Lesion Treatment Industry Revenue (Million) Forecast, by Application 2019 & 2032
- Table 16: Mexico Pigmented Lesion Treatment Industry Volume (K Unit) Forecast, by Application 2019 & 2032
- Table 17: Global Pigmented Lesion Treatment Industry Revenue Million Forecast, by Country 2019 & 2032
- Table 18: Global Pigmented Lesion Treatment Industry Volume K Unit Forecast, by Country 2019 & 2032
- Table 19: Germany Pigmented Lesion Treatment Industry Revenue (Million) Forecast, by Application 2019 & 2032
- Table 20: Germany Pigmented Lesion Treatment Industry Volume (K Unit) Forecast, by Application 2019 & 2032
- Table 21: United Kingdom Pigmented Lesion Treatment Industry Revenue (Million) Forecast, by Application 2019 & 2032
- Table 22: United Kingdom Pigmented Lesion Treatment Industry Volume (K Unit) Forecast, by Application 2019 & 2032
- Table 23: France Pigmented Lesion Treatment Industry Revenue (Million) Forecast, by Application 2019 & 2032
- Table 24: France Pigmented Lesion Treatment Industry Volume (K Unit) Forecast, by Application 2019 & 2032
- Table 25: Italy Pigmented Lesion Treatment Industry Revenue (Million) Forecast, by Application 2019 & 2032
- Table 26: Italy Pigmented Lesion Treatment Industry Volume (K Unit) Forecast, by Application 2019 & 2032
- Table 27: Spain Pigmented Lesion Treatment Industry Revenue (Million) Forecast, by Application 2019 & 2032
- Table 28: Spain Pigmented Lesion Treatment Industry Volume (K Unit) Forecast, by Application 2019 & 2032
- Table 29: Rest of Europe Pigmented Lesion Treatment Industry Revenue (Million) Forecast, by Application 2019 & 2032
- Table 30: Rest of Europe Pigmented Lesion Treatment Industry Volume (K Unit) Forecast, by Application 2019 & 2032
- Table 31: Global Pigmented Lesion Treatment Industry Revenue Million Forecast, by Country 2019 & 2032
- Table 32: Global Pigmented Lesion Treatment Industry Volume K Unit Forecast, by Country 2019 & 2032
- Table 33: China Pigmented Lesion Treatment Industry Revenue (Million) Forecast, by Application 2019 & 2032
- Table 34: China Pigmented Lesion Treatment Industry Volume (K Unit) Forecast, by Application 2019 & 2032
- Table 35: Japan Pigmented Lesion Treatment Industry Revenue (Million) Forecast, by Application 2019 & 2032
- Table 36: Japan Pigmented Lesion Treatment Industry Volume (K Unit) Forecast, by Application 2019 & 2032
- Table 37: India Pigmented Lesion Treatment Industry Revenue (Million) Forecast, by Application 2019 & 2032
- Table 38: India Pigmented Lesion Treatment Industry Volume (K Unit) Forecast, by Application 2019 & 2032
- Table 39: Australia Pigmented Lesion Treatment Industry Revenue (Million) Forecast, by Application 2019 & 2032
- Table 40: Australia Pigmented Lesion Treatment Industry Volume (K Unit) Forecast, by Application 2019 & 2032
- Table 41: South Korea Pigmented Lesion Treatment Industry Revenue (Million) Forecast, by Application 2019 & 2032
- Table 42: South Korea Pigmented Lesion Treatment Industry Volume (K Unit) Forecast, by Application 2019 & 2032
- Table 43: Rest of Asia Pacific Pigmented Lesion Treatment Industry Revenue (Million) Forecast, by Application 2019 & 2032
- Table 44: Rest of Asia Pacific Pigmented Lesion Treatment Industry Volume (K Unit) Forecast, by Application 2019 & 2032
- Table 45: Global Pigmented Lesion Treatment Industry Revenue Million Forecast, by Country 2019 & 2032
- Table 46: Global Pigmented Lesion Treatment Industry Volume K Unit Forecast, by Country 2019 & 2032
- Table 47: GCC Pigmented Lesion Treatment Industry Revenue (Million) Forecast, by Application 2019 & 2032
- Table 48: GCC Pigmented Lesion Treatment Industry Volume (K Unit) Forecast, by Application 2019 & 2032
- Table 49: South Africa Pigmented Lesion Treatment Industry Revenue (Million) Forecast, by Application 2019 & 2032
- Table 50: South Africa Pigmented Lesion Treatment Industry Volume (K Unit) Forecast, by Application 2019 & 2032
- Table 51: Rest of Middle East and Africa Pigmented Lesion Treatment Industry Revenue (Million) Forecast, by Application 2019 & 2032
- Table 52: Rest of Middle East and Africa Pigmented Lesion Treatment Industry Volume (K Unit) Forecast, by Application 2019 & 2032
- Table 53: Global Pigmented Lesion Treatment Industry Revenue Million Forecast, by Country 2019 & 2032
- Table 54: Global Pigmented Lesion Treatment Industry Volume K Unit Forecast, by Country 2019 & 2032
- Table 55: Brazil Pigmented Lesion Treatment Industry Revenue (Million) Forecast, by Application 2019 & 2032
- Table 56: Brazil Pigmented Lesion Treatment Industry Volume (K Unit) Forecast, by Application 2019 & 2032
- Table 57: Argentina Pigmented Lesion Treatment Industry Revenue (Million) Forecast, by Application 2019 & 2032
- Table 58: Argentina Pigmented Lesion Treatment Industry Volume (K Unit) Forecast, by Application 2019 & 2032
- Table 59: Rest of South America Pigmented Lesion Treatment Industry Revenue (Million) Forecast, by Application 2019 & 2032
- Table 60: Rest of South America Pigmented Lesion Treatment Industry Volume (K Unit) Forecast, by Application 2019 & 2032
- Table 61: Global Pigmented Lesion Treatment Industry Revenue Million Forecast, by Product Type 2019 & 2032
- Table 62: Global Pigmented Lesion Treatment Industry Volume K Unit Forecast, by Product Type 2019 & 2032
- Table 63: Global Pigmented Lesion Treatment Industry Revenue Million Forecast, by End User 2019 & 2032
- Table 64: Global Pigmented Lesion Treatment Industry Volume K Unit Forecast, by End User 2019 & 2032
- Table 65: Global Pigmented Lesion Treatment Industry Revenue Million Forecast, by Country 2019 & 2032
- Table 66: Global Pigmented Lesion Treatment Industry Volume K Unit Forecast, by Country 2019 & 2032
- Table 67: United States Pigmented Lesion Treatment Industry Revenue (Million) Forecast, by Application 2019 & 2032
- Table 68: United States Pigmented Lesion Treatment Industry Volume (K Unit) Forecast, by Application 2019 & 2032
- Table 69: Canada Pigmented Lesion Treatment Industry Revenue (Million) Forecast, by Application 2019 & 2032
- Table 70: Canada Pigmented Lesion Treatment Industry Volume (K Unit) Forecast, by Application 2019 & 2032
- Table 71: Mexico Pigmented Lesion Treatment Industry Revenue (Million) Forecast, by Application 2019 & 2032
- Table 72: Mexico Pigmented Lesion Treatment Industry Volume (K Unit) Forecast, by Application 2019 & 2032
- Table 73: Global Pigmented Lesion Treatment Industry Revenue Million Forecast, by Product Type 2019 & 2032
- Table 74: Global Pigmented Lesion Treatment Industry Volume K Unit Forecast, by Product Type 2019 & 2032
- Table 75: Global Pigmented Lesion Treatment Industry Revenue Million Forecast, by End User 2019 & 2032
- Table 76: Global Pigmented Lesion Treatment Industry Volume K Unit Forecast, by End User 2019 & 2032
- Table 77: Global Pigmented Lesion Treatment Industry Revenue Million Forecast, by Country 2019 & 2032
- Table 78: Global Pigmented Lesion Treatment Industry Volume K Unit Forecast, by Country 2019 & 2032
- Table 79: Germany Pigmented Lesion Treatment Industry Revenue (Million) Forecast, by Application 2019 & 2032
- Table 80: Germany Pigmented Lesion Treatment Industry Volume (K Unit) Forecast, by Application 2019 & 2032
- Table 81: United Kingdom Pigmented Lesion Treatment Industry Revenue (Million) Forecast, by Application 2019 & 2032
- Table 82: United Kingdom Pigmented Lesion Treatment Industry Volume (K Unit) Forecast, by Application 2019 & 2032
- Table 83: France Pigmented Lesion Treatment Industry Revenue (Million) Forecast, by Application 2019 & 2032
- Table 84: France Pigmented Lesion Treatment Industry Volume (K Unit) Forecast, by Application 2019 & 2032
- Table 85: Italy Pigmented Lesion Treatment Industry Revenue (Million) Forecast, by Application 2019 & 2032
- Table 86: Italy Pigmented Lesion Treatment Industry Volume (K Unit) Forecast, by Application 2019 & 2032
- Table 87: Spain Pigmented Lesion Treatment Industry Revenue (Million) Forecast, by Application 2019 & 2032
- Table 88: Spain Pigmented Lesion Treatment Industry Volume (K Unit) Forecast, by Application 2019 & 2032
- Table 89: Rest of Europe Pigmented Lesion Treatment Industry Revenue (Million) Forecast, by Application 2019 & 2032
- Table 90: Rest of Europe Pigmented Lesion Treatment Industry Volume (K Unit) Forecast, by Application 2019 & 2032
- Table 91: Global Pigmented Lesion Treatment Industry Revenue Million Forecast, by Product Type 2019 & 2032
- Table 92: Global Pigmented Lesion Treatment Industry Volume K Unit Forecast, by Product Type 2019 & 2032
- Table 93: Global Pigmented Lesion Treatment Industry Revenue Million Forecast, by End User 2019 & 2032
- Table 94: Global Pigmented Lesion Treatment Industry Volume K Unit Forecast, by End User 2019 & 2032
- Table 95: Global Pigmented Lesion Treatment Industry Revenue Million Forecast, by Country 2019 & 2032
- Table 96: Global Pigmented Lesion Treatment Industry Volume K Unit Forecast, by Country 2019 & 2032
- Table 97: China Pigmented Lesion Treatment Industry Revenue (Million) Forecast, by Application 2019 & 2032
- Table 98: China Pigmented Lesion Treatment Industry Volume (K Unit) Forecast, by Application 2019 & 2032
- Table 99: Japan Pigmented Lesion Treatment Industry Revenue (Million) Forecast, by Application 2019 & 2032
- Table 100: Japan Pigmented Lesion Treatment Industry Volume (K Unit) Forecast, by Application 2019 & 2032
- Table 101: India Pigmented Lesion Treatment Industry Revenue (Million) Forecast, by Application 2019 & 2032
- Table 102: India Pigmented Lesion Treatment Industry Volume (K Unit) Forecast, by Application 2019 & 2032
- Table 103: Australia Pigmented Lesion Treatment Industry Revenue (Million) Forecast, by Application 2019 & 2032
- Table 104: Australia Pigmented Lesion Treatment Industry Volume (K Unit) Forecast, by Application 2019 & 2032
- Table 105: South Korea Pigmented Lesion Treatment Industry Revenue (Million) Forecast, by Application 2019 & 2032
- Table 106: South Korea Pigmented Lesion Treatment Industry Volume (K Unit) Forecast, by Application 2019 & 2032
- Table 107: Rest of Asia Pacific Pigmented Lesion Treatment Industry Revenue (Million) Forecast, by Application 2019 & 2032
- Table 108: Rest of Asia Pacific Pigmented Lesion Treatment Industry Volume (K Unit) Forecast, by Application 2019 & 2032
- Table 109: Global Pigmented Lesion Treatment Industry Revenue Million Forecast, by Product Type 2019 & 2032
- Table 110: Global Pigmented Lesion Treatment Industry Volume K Unit Forecast, by Product Type 2019 & 2032
- Table 111: Global Pigmented Lesion Treatment Industry Revenue Million Forecast, by End User 2019 & 2032
- Table 112: Global Pigmented Lesion Treatment Industry Volume K Unit Forecast, by End User 2019 & 2032
- Table 113: Global Pigmented Lesion Treatment Industry Revenue Million Forecast, by Country 2019 & 2032
- Table 114: Global Pigmented Lesion Treatment Industry Volume K Unit Forecast, by Country 2019 & 2032
- Table 115: GCC Pigmented Lesion Treatment Industry Revenue (Million) Forecast, by Application 2019 & 2032
- Table 116: GCC Pigmented Lesion Treatment Industry Volume (K Unit) Forecast, by Application 2019 & 2032
- Table 117: South Africa Pigmented Lesion Treatment Industry Revenue (Million) Forecast, by Application 2019 & 2032
- Table 118: South Africa Pigmented Lesion Treatment Industry Volume (K Unit) Forecast, by Application 2019 & 2032
- Table 119: Rest of Middle East and Africa Pigmented Lesion Treatment Industry Revenue (Million) Forecast, by Application 2019 & 2032
- Table 120: Rest of Middle East and Africa Pigmented Lesion Treatment Industry Volume (K Unit) Forecast, by Application 2019 & 2032
- Table 121: Global Pigmented Lesion Treatment Industry Revenue Million Forecast, by Product Type 2019 & 2032
- Table 122: Global Pigmented Lesion Treatment Industry Volume K Unit Forecast, by Product Type 2019 & 2032
- Table 123: Global Pigmented Lesion Treatment Industry Revenue Million Forecast, by End User 2019 & 2032
- Table 124: Global Pigmented Lesion Treatment Industry Volume K Unit Forecast, by End User 2019 & 2032
- Table 125: Global Pigmented Lesion Treatment Industry Revenue Million Forecast, by Country 2019 & 2032
- Table 126: Global Pigmented Lesion Treatment Industry Volume K Unit Forecast, by Country 2019 & 2032
- Table 127: Brazil Pigmented Lesion Treatment Industry Revenue (Million) Forecast, by Application 2019 & 2032
- Table 128: Brazil Pigmented Lesion Treatment Industry Volume (K Unit) Forecast, by Application 2019 & 2032
- Table 129: Argentina Pigmented Lesion Treatment Industry Revenue (Million) Forecast, by Application 2019 & 2032
- Table 130: Argentina Pigmented Lesion Treatment Industry Volume (K Unit) Forecast, by Application 2019 & 2032
- Table 131: Rest of South America Pigmented Lesion Treatment Industry Revenue (Million) Forecast, by Application 2019 & 2032
- Table 132: Rest of South America Pigmented Lesion Treatment Industry Volume (K Unit) Forecast, by Application 2019 & 2032
Frequently Asked Questions
1. What is the projected Compound Annual Growth Rate (CAGR) of the Pigmented Lesion Treatment Industry?
The projected CAGR is approximately 6.80%.
2. Which companies are prominent players in the Pigmented Lesion Treatment Industry?
Key companies in the market include Solta Medical Inc, Lumenis Ltd, Lutronic Corporation, Syneron Medical Ltd , Strata Skin Sciences Inc, Cutera Inc, Lynton Lasers Ltd, Alma Lasers Ltd, Cynosure Inc.
3. What are the main segments of the Pigmented Lesion Treatment Industry?
The market segments include Product Type, End User.
4. Can you provide details about the market size?
The market size is estimated to be USD 3.37 Million as of 2022.
5. What are some drivers contributing to market growth?
Rising Geriatric Population; Increasing Prevalence of Pigmentation Disorders.
6. What are the notable trends driving market growth?
Lasers and Energy Based Devices are Expected to Witness a Significant Growth.
7. Are there any restraints impacting market growth?
Side Effects Associated with Certain Treatments.
8. Can you provide examples of recent developments in the market?
December 2022: Singapore-based skincare brand Heure, known for its proprietary encapsulation tech, planned to launch a sophomore range targeting skin pigmentation in 2023.
9. What pricing options are available for accessing the report?
Pricing options include single-user, multi-user, and enterprise licenses priced at USD 4750, USD 5250, and USD 8750 respectively.
10. Is the market size provided in terms of value or volume?
The market size is provided in terms of value, measured in Million and volume, measured in K Unit.
11. Are there any specific market keywords associated with the report?
Yes, the market keyword associated with the report is "Pigmented Lesion Treatment Industry," which aids in identifying and referencing the specific market segment covered.
12. How do I determine which pricing option suits my needs best?
The pricing options vary based on user requirements and access needs. Individual users may opt for single-user licenses, while businesses requiring broader access may choose multi-user or enterprise licenses for cost-effective access to the report.
13. Are there any additional resources or data provided in the Pigmented Lesion Treatment Industry report?
While the report offers comprehensive insights, it's advisable to review the specific contents or supplementary materials provided to ascertain if additional resources or data are available.
14. How can I stay updated on further developments or reports in the Pigmented Lesion Treatment Industry?
To stay informed about further developments, trends, and reports in the Pigmented Lesion Treatment Industry, consider subscribing to industry newsletters, following relevant companies and organizations, or regularly checking reputable industry news sources and publications.
Methodology
Step 1 - Identification of Relevant Samples Size from Population Database


Step 2 - Approaches for Defining Global Market Size (Value, Volume* & Price*)

Note*: In applicable scenarios
Step 3 - Data Sources
Primary Research
- Web Analytics
- Survey Reports
- Research Institute
- Latest Research Reports
- Opinion Leaders
Secondary Research
- Annual Reports
- White Paper
- Latest Press Release
- Industry Association
- Paid Database
- Investor Presentations

Step 4 - Data Triangulation
Involves using different sources of information in order to increase the validity of a study
These sources are likely to be stakeholders in a program - participants, other researchers, program staff, other community members, and so on.
Then we put all data in single framework & apply various statistical tools to find out the dynamic on the market.
During the analysis stage, feedback from the stakeholder groups would be compared to determine areas of agreement as well as areas of divergence


